0001535778False424B1MSC Income Fund, Inc.xbrli:pureiso4217:USDiso4217:USDxbrli:sharesxbrli:shares00015357782025-01-282025-01-2800015357782025-01-212025-01-210001535778msif:UncertaintyToTheValueOfPortfolioInvestmentsRiskMember2025-01-212025-01-210001535778msif:AdvisersManagementAndDeploymentOfCapitalRiskMember2025-01-212025-01-210001535778msif:InterestRateEnvironmentAndChangesInInterestRatesRiskMember2025-01-212025-01-210001535778msif:CompetitionForInvestmentOpportunitiesRiskMember2025-01-212025-01-210001535778msif:DependentUponAdvisersInvestmentPersonnelForFutureSuccessRiskMember2025-01-212025-01-210001535778msif:DependentUponAdvisersInvestmentPersonnelAndResourcesProvidedByMainStreetUnderASharingAgreementRiskMember2025-01-212025-01-210001535778msif:AbilityToAttractAndRetainQualifiedPersonnelRiskMember2025-01-212025-01-210001535778msif:MayNotReplicateHistoricalResultsRiskMember2025-01-212025-01-210001535778msif:DependsToASignificantExtentUponStrongReferralRelationshipsRiskMember2025-01-212025-01-210001535778msif:BoardOfDirectorsMayChangeOperatingPoliciesAndStrategiesRiskMember2025-01-212025-01-210001535778msif:NonDiversifiedInvestmentCompanyRiskMember2025-01-212025-01-210001535778msif:CashBalancesMayExceedFDICLimitsRiskMember2025-01-212025-01-210001535778msif:CorporateSocialResponsibilityRiskMember2025-01-212025-01-210001535778msif:BylawsIncludeAnExclusiveForumSelectionProvisionRiskMember2025-01-212025-01-210001535778msif:InvestmentsMayLoseMoneyRiskMember2025-01-212025-01-210001535778msif:EconomicRecessionsOrDownturnsRiskMember2025-01-212025-01-210001535778msif:RisingCreditSpreadsAndInterestRatesRiskMember2025-01-212025-01-210001535778msif:InflationRiskMember2025-01-212025-01-210001535778msif:OriginalIssueDiscountOrPIKInterestRiskMember2025-01-212025-01-210001535778msif:LiquidityRiskMember2025-01-212025-01-210001535778msif:MayNotHaveFundsToMakeInvestmentsRiskMember2025-01-212025-01-210001535778msif:ClaimsOfOtherCreditorsRiskMember2025-01-212025-01-210001535778msif:ControlOfPortfolioCompaniesRiskMember2025-01-212025-01-210001535778msif:PortfolioCompaniesDefaultRiskMember2025-01-212025-01-210001535778msif:UnrealizedDepreciationRiskMember2025-01-212025-01-210001535778msif:PrepaymentsOfDebtInvestmentsRiskMember2025-01-212025-01-210001535778msif:CovenantLiteLoansRiskMember2025-01-212025-01-210001535778msif:MayNotRealizeGainsFromEquityInvestmentsRiskMember2025-01-212025-01-210001535778msif:InvestmentsInForeignSecuritiesRiskMember2025-01-212025-01-210001535778msif:EffectsOfLeverageRiskMember2025-01-212025-01-2100015357782024-09-302024-09-300001535778msif:SeniorSecuritiesObligationsRiskMember2025-01-212025-01-210001535778msif:RevolvingCreditFacilityRiskMember2025-01-212025-01-210001535778msif:AbilityToSellInvestmentsHeldByAStructuredSubsidiaryRiskMember2025-01-212025-01-210001535778msif:InvestmentsInDerivativesRiskMember2025-01-212025-01-210001535778msif:ConflictsOfInterestMayLeadToRiskierInvestmentsRiskMember2025-01-212025-01-210001535778msif:ObligatedToPayIncentiveCompensationRiskMember2025-01-212025-01-210001535778msif:ConflictsOfInterestInAllocatingInvestmentOpportunitiesRiskMember2025-01-212025-01-210001535778msif:MainStreetCommonStockOwnershipCouldInfluenceStockholdersMember2025-01-212025-01-210001535778msif:AbilityToEnterIntoTransactionsWithOurAffiliatesIsRestrictedRiskMember2025-01-212025-01-210001535778msif:LiabilityIsLimitedUnderTheAdvisoryAgreementMayLeadAdviserToActInARiskierMannerRiskMember2025-01-212025-01-210001535778msif:AdviserCanResignRiskMember2025-01-212025-01-210001535778msif:BDCConstraintsRiskMember2025-01-212025-01-210001535778msif:BDCRegulationsRiskMember2025-01-212025-01-210001535778msif:LegislationMayAllowAdditionalLeverageRiskMember2025-01-212025-01-210001535778msif:InvestmentInSecuritiesMayInvolveRiskMember2025-01-212025-01-210001535778msif:MaterialLimitationsWithAvailablePreliminaryEstimatesRiskMember2025-01-212025-01-210001535778msif:NoActiveTradingMarketForCommonStockRiskMember2025-01-212025-01-210001535778msif:MarketPriceForCommonStockMayBeVolatileRiskMember2025-01-212025-01-210001535778msif:DistributionsRiskMember2025-01-212025-01-210001535778msif:PurchasesOfCommonStockUnderRule10b51RiskMember2025-01-212025-01-210001535778msif:SalesOfCommonStockInPublicMarketRiskMember2025-01-212025-01-210001535778msif:ClosingOfTheOfferingRiskMember2025-01-212025-01-210001535778msif:StockholdersMayExperienceDilutionInTheirOwnershipPercentageRiskMember2025-01-212025-01-210001535778msif:UseOfProceedsRiskMember2025-01-212025-01-210001535778msif:ArticlesOfIncorporationCouldDeterTakeoverAttemptsRiskMember2025-01-212025-01-210001535778msif:PreferredStockRiskMember2025-01-212025-01-210001535778msif:CorporateLevelU.S.FederalIncomeTaxRiskMember2025-01-212025-01-210001535778msif:MaintainingRICTaxTreatmentRiskMember2025-01-212025-01-210001535778msif:DividendsPaidWithStockRickMember2025-01-212025-01-210001535778msif:StockholdersCurrentTaxLiabilityRiskMember2025-01-212025-01-210001535778msif:LegislativeOrRegulatoryTaxChangesRiskMember2025-01-212025-01-210001535778msif:OutsideEventsIncludingPublicHealthCrisesSupplyChainDisruptionsAndInflationRiskMember2025-01-212025-01-210001535778msif:MarketConditionsMayAffectDebtAndEquityCapitalMarketsRiskMember2025-01-212025-01-210001535778msif:FailureToComplyWithApplicableLawsOrRegulationsRiskMember2025-01-212025-01-210001535778msif:FluctuationsInOperatingResultsRiskMember2025-01-212025-01-210001535778msif:TechnologicalInnovationsAndIndustryDisruptionsRiskMember2025-01-212025-01-210001535778msif:InformationSystemsAndSystemsFailuresRiskMember2025-01-212025-01-210001535778msif:FailureInCybersecuritySystemsRiskMember2025-01-212025-01-210001535778msif:CorporateFacilityMember2014-12-310001535778msif:CorporateFacilityMember2015-12-310001535778msif:CorporateFacilityMember2016-12-310001535778msif:CorporateFacilityMember2017-12-310001535778msif:CorporateFacilityMember2018-12-310001535778msif:CorporateFacilityMember2019-12-310001535778msif:CorporateFacilityMember2020-12-310001535778msif:CorporateFacilityMember2021-12-310001535778msif:CorporateFacilityMember2022-12-310001535778msif:CorporateFacilityMember2023-12-310001535778msif:CorporateFacilityMember2024-09-300001535778msif:SPVFacilityMember2021-12-310001535778msif:SPVFacilityMember2022-12-310001535778msif:SPVFacilityMember2023-12-310001535778msif:SPVFacilityMember2024-09-300001535778msif:SeriesANotesMember2021-12-310001535778msif:SeriesANotesMember2022-12-310001535778msif:SeriesANotesMember2023-12-310001535778msif:SeriesANotesMember2024-09-300001535778msif:DeutscheBankCreditFacilityMember2014-12-310001535778msif:DeutscheBankCreditFacilityMember2015-12-310001535778msif:DeutscheBankCreditFacilityMember2016-12-310001535778msif:DeutscheBankCreditFacilityMember2017-12-310001535778msif:DeutscheBankCreditFacilityMember2018-12-310001535778msif:DeutscheBankCreditFacilityMember2019-12-310001535778msif:DeutscheBankCreditFacilityMember2020-12-310001535778us-gaap:CommonStockMember2025-01-212025-01-210001535778us-gaap:PreferredStockMember2025-01-212025-01-210001535778msif:SPVFacilityMember2024-09-302024-09-300001535778msif:CorporateFacilityMember2024-09-302024-09-300001535778msif:SeriesANotesMember2024-09-302024-09-300001535778msif:SPVFacilityMember2023-12-312023-12-310001535778msif:CorporateFacilityMember2023-12-312023-12-310001535778msif:SeriesANotesMember2023-12-312023-12-3100015357782023-12-312023-12-310001535778msif:SPVFacilityMember2025-01-212025-01-210001535778msif:CorporateFacilityMember2025-01-212025-01-210001535778msif:SeriesANotesMember2025-01-212025-01-21
Filed pursuant to Rule 424(b)(1)
File No. 333-282501
File No. 333-284563
PROSPECTUS
5,500,000 Shares
Common Stock
We are an externally managed, closed-end, non-diversified management investment company that has elected to be regulated as a business development company (“BDC”) under the Investment Company Act of 1940 (the “1940 Act”). We are managed by MSC Adviser I, LLC (the “Adviser”), a registered investment adviser under the Investment Advisers Act of 1940 (the “Advisers Act”), which is wholly-owned by Main Street Capital Corporation, a New York Stock Exchange-listed BDC (“Main Street”).
Our principal investment objective is to maximize our investment portfolio’s total return, primarily by generating current income from our debt investments and, to a lesser extent, by generating current income and capital appreciation from our equity and equity-related investments, including warrants, convertible securities and other rights to acquire equity securities in a portfolio company. We seek to achieve our investment objective primarily by providing debt capital to private (“Private Loan”) companies owned by or in the process of being acquired by a private equity fund (our “Private Loan investment strategy”) and secondarily by providing customized long-term debt and equity capital solutions to lower middle market (“LMM”) companies (our “LMM investment strategy”). A portion of our Private Loan investments may include equity investments in our Private Loan companies. Our Private Loan investment strategy involves investments in companies that generally have annual revenues between $25 million and $500 million and annual earnings before interest, tax, depreciation and amortization expenses (“EBITDA”) between $7.5 million and $50 million. Our LMM investment strategy involves investments in companies that generally have annual revenues between $10 million and $150 million and annual EBITDA between $3 million and $20 million.
We also maintain a legacy portfolio of investments in larger middle market (“Middle Market”) companies, with annual revenues typically between $150 million and $1.5 billion (our “Middle Market investment portfolio”). Our Middle Market investments are generally debt investments in companies owned by a private equity fund that were originally issued through a syndication financing process. We have generally stopped making new Middle Market investments and expect our Middle Market investment portfolio to continue to decline in future periods as our existing Middle Market investments are repaid or sold. Our Private Loan, LMM and Middle Market investments generally range in size from $1 million to $20 million. Geographically, we maintain a diversified portfolio throughout the United States.
In contemplation of this public offering, our board of directors and the Adviser decided to shift our future investment strategy with respect to new platform investments to be solely focused on our Private Loan investment strategy. As a result, the size of our LMM investment portfolio is expected to decrease over time as we make new investments consistent with our Private Loan investment strategy and our existing LMM investments are repaid or sold in the ordinary course of business. We do, however, plan to continue executing follow on investments in our existing LMM portfolio companies going forward in accordance with our existing SEC order for co-investment exemptive relief.
Additionally, on December 16, 2024, we effectuated a 2-for-1 reverse stock split of our outstanding common stock pursuant to approval from our board of directors (the “Reverse Stock Split”). As a result of the Reverse Stock Split, every two shares of our issued and outstanding common stock were converted into one share of issued and outstanding common stock, without any change in the par value per share or the number of authorized shares of our common stock. Unless otherwise indicated, all figures in this prospectus reflect the implementation of the Reverse Stock Split.
This is a public offering of shares of our common stock. All of the shares of common stock offered by this prospectus are being sold by us.
Shares of our common stock have no history of public trading. The public offering price per share of our common stock is $15.53. Our shares have been approved for listing on The New York Stock Exchange under the symbol “MSIF”.
At the Company’s request, the underwriters have reserved for sale at the public offering price per share up to 7% of the shares of common stock sold in this offering to certain individuals, including our directors, officers, employees and certain other individuals identified by us, through a directed share program (the “DSP Reserved Shares”). We will not pay underwriting discounts and commissions on the DSP Reserved Shares sold to such persons. To the extent acquired by a director or executive officer of the Company, the DSP Reserved Shares will be subject to the lock-up agreement with the underwriters described elsewhere in this prospectus. Furthermore, as required by the Financial Industry Regulatory Authority, Inc., DSP Reserved Shares acquired by certain other program participants may also be subject to a lock-up restriction on their ability to transfer or otherwise sell their DSP Reserved Shares.
Our board of directors has authorized an open-market share repurchase program of up to $65.0 million in the aggregate of shares of our common stock. Pursuant to the program, we may, from time to time, purchase shares of our common stock in the open market, subject to market conditions and other factors, for a 12-month period starting on a date determined by the Company following the consummation of this offering. We will determine the timing and amount of repurchases based on our evaluation of market conditions and other factors. The repurchase program may be suspended or discontinued by us at any time. Pursuant to such authorization, we intend to enter into a share repurchase plan (the “Company Rule 10b5-1 Stock Repurchase Plan”), in connection with or shortly after the closing of this offering, to facilitate the repurchase of up to the full $65.0 million in shares of common stock authorized under the share repurchase program. The repurchases of shares pursuant to the Company Rule 10b5-1 Stock Repurchase Plan will be implemented in accordance with Rule 10b5-1 and Rule 10b-18 under the Securities Exchange Act of 1934 (the “Exchange Act”). See “Prospectus Summary — Open-Market Share Repurchase Program and Main Street Rule 10b5-1 Stock Purchase Plan.”
In addition, Main Street intends to purchase up to $20.0 million in the aggregate of shares of our common stock in the open market, for a 12-month period starting on a date determined by Main Street following the consummation of this offering, pursuant to the terms of a share purchase plan (the “Main Street Rule 10b5-1 Stock Purchase Plan”) that Main Street intends to enter in connection with or shortly after the closing of this offering. The purchases of shares pursuant to the Main Street Rule 10b5-1 Stock Purchase Plan will be implemented in accordance with Rule 10b5-1 and Rule 10b-18 under the Exchange Act. See “Prospectus Summary — Open-Market Share Repurchase Program and Main Street Rule 10b5-1 Stock Purchase Plan.”
The terms and conditions of the Company Rule 10b5-1 Stock Repurchase Plan and of the Main Street Rule 10b5-1 Purchase Plan will be substantially similar. Subject to the limitations under Rule 10b-18 under the Exchange Act and market conditions, the Company expects that the aggregate amount of shares of our common stock (1) repurchased under the Company Rule 10b5-1 Stock Repurchase Plan and (2) purchased under the Main Street Rule 10b5-1 Purchase Plan on any single trading day will be split among the Company and Main Street on a pro rata basis (or as close thereto as reasonably possible) based upon the proportion of the aggregate $85 million repurchase/purchase commitment represented by the respective share repurchase/purchase program (i.e., the Company expects that approximately 76.5% of the aggregate market value of shares purchased in a single trading day under the Company Rule 10b5-1 Stock Repurchase Plan and the Main Street Rule 10b5-1 Purchase Plan will be repurchased by the Company, while the remaining 23.5% will be purchased by Main Street). There is no assurance that the Company or Main Street will repurchase or purchase any shares of our common stock at any specific discount levels or in any specific amounts under the Company Rule 10b5-1 Stock Repurchase Plan or the Main Street Rule 10b5-1 Purchase Plan. There is no assurance that the market price of our shares of common stock, either absolutely or relative to NAV, will increase as a result of any share repurchases/purchases, or that the Company Rule 10b5-1 Stock Repurchase Plan or the Main Street Rule 10b5-1 Purchase Plan will enhance stockholder value over the long term.
This prospectus contains important information you should know before investing in our common stock. Please read it before you invest and keep it for future reference. We file annual, quarterly and current reports, proxy statements and other information about us with the Securities and Exchange Commission (the “SEC”). This information will be available by written or oral request and free of charge by contacting us at MSC Income Fund, Inc., 1300 Post Oak Blvd., 8th Floor, Houston, TX 77056, on our website at www.mscincomefund.com, or by calling us collect at (713) 350-6000. The SEC also maintains a website at www.sec.gov that contains this information.
Shares of closed-end investment companies that are listed on an exchange, including BDCs, may trade at a discount to their net asset value (“NAV”) per share. The NAV per share of our common stock as of September 30, 2024 was $15.38 (as adjusted for the Reverse Stock Split on a retrospective basis). If our shares trade at a discount to our NAV, it may increase the risk of loss for purchasers in this offering. At the public offering price of $15.53 per share, purchasers in this offering will experience immediate dilution of approximately $0.15 per share.
Investing in our common stock involves a high degree of risk, including credit risk and the risk of the use of leverage, and is highly speculative. The securities in which we invest generally would be rated below investment grade if they were rated by rating agencies. Below investment grade securities, which are often referred to as “junk,” have predominantly speculative characteristics with respect to the issuer’s capacity to pay interest and repay principal. They may also be difficult to value and are illiquid. Before buying any shares of our common stock, you should read the discussion of the material risks of investing in our common stock in “Risk Factors” beginning on page 46 of this prospectus. Neither the SEC nor any state securities commission, nor any other regulatory body, has approved or disapproved of these securities or determined if this prospectus is truthful or complete. Any representation to the contrary is a criminal offense.
| | | | | | | | | | | |
| | Per Share | Total |
Public offering price | | $15.5300 | $ | 85,415,000 | |
Sales load (underwriting discounts and commissions)(1)(2) | | $0.8827 | $ | 4,854,901 | |
Proceeds, before expenses, to us(2) | | $14.6473 | $ | 80,560,099 | |
_____________________________(1)For all shares sold in the offering described in this prospectus, except the 289,761 shares to be sold to Main Street (see “The Offering – Main Street Indication of Interest”) or any DSP Reserved Shares sold under the directed share program for this offering, the underwriters will be entitled to receive $0.9318 per share at settlement. See “Underwriting” for a more complete description of underwriting compensation. As a result, the per share and total sales load figures reflect that the underwriters will not receive any sales load on the 289,761 shares to be sold to Main Street.
(2)Offering expenses payable by us, exclusive of the underwriting discounts and commissions, are estimated to be approximately $2.0 million in connection with this offering. The calculation of proceeds to be received by us in the above table assumes the sale of 289,761 shares to Main Street (see “The Offering – Main Street Indication of Interest”) and that no shares are sold pursuant to the directed share program described elsewhere herein.
We granted the underwriters an option to purchase up to 825,000 additional shares of our common stock from us, at the public offering price, less underwriting discounts and commissions, within 30 days from the date of this prospectus to cover over-allotments, if any. If the underwriters exercise their over-allotment option, based on the assumptions in the above table, the total sales load payable to the underwriters will be approximately $5.6 million, and total proceeds to us, before offering expenses, will be approximately $92.6 million.
The shares will be delivered on or about January 30, 2025.
| | | | | | | | | | | | | | |
Joint Book-Running Managers |
| RBC Capital Markets | Truist Securities | Raymond James | UBS Investment Bank | Keefe, Bruyette & Woods |
| | | | A Stifel Company |
| | | | | | | | | | | |
Co-Managers |
Sanders Morris | B. Riley Securities | Citizens JMP |
|
| | | |
| Clear Street | Comerica Securities | Texas Capital Securities | Zions Capital Markets |
| | | |
The date of this prospectus is January 28, 2025.
TABLE OF CONTENTS
This prospectus may contain estimates and information concerning our industry that are based on industry publications and reports. This information involves many assumptions and limitations, and you are cautioned not to give undue weight to these estimates. We have not independently verified the accuracy or completeness of the data contained in these industry publications and reports. The industry in which we operate is subject to a high degree of uncertainty and risk due to a variety of factors, including those described in the section titled “Risk Factors,” that could cause results to differ materially from those expressed in these publications and reports.
This prospectus includes summaries of certain provisions contained in the documents described in this prospectus, but reference is made to the actual documents for complete information. All of the summaries are qualified in their entirety by the actual documents. Copies of the documents referred to herein have been filed, will be filed, or will be incorporated by reference as exhibits to the registration statement of which this prospectus is a part, and you may obtain copies of those documents as described in the section titled “Available Information.”
You should rely only on the information included in this prospectus. We have not, and the underwriters have not, authorized any dealer, salesperson or other person to provide you with different information or to make representations as to matters not stated in this prospectus. We take no responsibility for, and can provide no assurance as to the reliability of, any other information that others may give you. If anyone provides you with different or inconsistent information, you should not rely on it. This prospectus does not constitute an offer to sell, or a solicitation of an offer to buy, any securities by any person in any jurisdiction where it is unlawful for that person to make such an offer or solicitation or to any person in any jurisdiction to whom it is unlawful to make such an offer or solicitation. You should not assume that the information included in this prospectus is accurate as of any date other than their respective dates. Changes to the information contained in this prospectus may occur after that date, and we undertake no obligation to update the information except as required by law.
The references in this prospectus to the SEC’s or our website are not intended to and do not include or incorporate by reference into this prospectus the information on those websites.
PROSPECTUS SUMMARY
This summary highlights information included elsewhere in this prospectus. It is not complete and may not contain all of the information that you should consider before making your investment decision. You should carefully read the entire prospectus, including the risks of investing in our common stock discussed in the section titled “Risk Factors” and our financial statements and related notes contained in this prospectus, and the exhibits to the registration statement of which this prospectus is a part. Any yield information contained in this prospectus related to debt investments in our investment portfolio is not intended to approximate a return on your investment in us and does not take into account other aspects of our business, including our operating and other expenses, or other costs incurred by you in connection with your investment in us. Unless otherwise noted or the context otherwise indicates, the term “MSIF” refers to MSC Income Fund, Inc., and the terms “we,” “us,” “our,” the “Company” and “MSC Income Fund” refer to MSIF and its consolidated subsidiaries, including the Taxable Subsidiaries and the Structured Subsidiaries (defined below).
On December 16, 2024, we effectuated a 2-for-1 reverse stock split of our outstanding common stock pursuant to approval from our board of directors (the “Reverse Stock Split”). As a result of the Reverse Stock Split, every two shares of our issued and outstanding common stock were converted into one share of issued and outstanding common stock, without any change in the par value per share or the number of authorized shares of our common stock. Unless otherwise indicated, all figures in this prospectus reflect the implementation of the Reverse Stock Split.
MSC Income Fund
We are a principal investment firm primarily focused on providing debt capital to private (“Private Loan”) companies owned by or in the process of being acquired by a private equity fund (our “Private Loan investment strategy”) and secondarily focused on providing customized long-term debt and equity capital solutions to lower middle market (“LMM”) companies (our “LMM investment strategy”). A portion of our Private Loan investments may include equity investments in our Private Loan companies. Our portfolio investments are typically made to support leveraged buyouts, recapitalizations, growth financings, refinancings and acquisitions of companies that operate in diverse industry sectors. We seek to partner with private equity fund sponsors in our Private Loan investment strategy and primarily invest in secured debt investments of Private Loan companies generally headquartered in the United States. We maintain relationships with a diverse group of private equity fund sponsors, with no aggregate Private Loan portfolio investments with a single sponsor exceeding 13% of our total Private Loan portfolio investments at fair value as of September 30, 2024. We also seek to partner with entrepreneurs, business owners and management teams and generally provide “one-stop” debt and equity financing solutions within our LMM investment strategy. Through our LMM investment strategy, we primarily invest in secured debt investments, equity investments, warrants and other securities of LMM companies typically based in the United States.
We also maintain a legacy portfolio of investments in larger middle market (“Middle Market”) companies (our “Middle Market investment portfolio”) and a limited portfolio of other portfolio investments (“Other Portfolio”). Our Middle Market investments are generally debt investments in companies owned by a private equity fund that were originally issued through a syndication financing process. We have generally stopped making new Middle Market investments and expect our Middle Market investment portfolio to continue to decline in future periods as our existing Middle Market investments are repaid or sold. Our Other Portfolio investments primarily consist of investments that are not consistent with the typical profiles for our Private Loan, LMM or Middle Market portfolio investments, including investments in non-affiliated investment companies and private funds managed by third parties. The “Investment Portfolio,” as used herein, refers to all of our investments in Private Loan portfolio companies, investments in LMM portfolio companies, investments in Middle Market portfolio companies and Other Portfolio investments
We were formed on November 28, 2011 as a Maryland corporation to operate as an externally managed business development company (“BDC”) under the Investment Company Act of 1940, as amended (the “1940 Act”). MSIF has elected to be treated for U.S. federal income tax purposes as a regulated investment company (“RIC”) under Subchapter M of the Internal Revenue Code of 1986, as amended (the “Code”). As a result, MSIF generally does not pay corporate-level U.S. federal income taxes on any net ordinary taxable income or capital gains that it distributes to its stockholders.
On October 28, 2020, MSIF’s stockholders approved the appointment of MSC Adviser I, LLC (our “Adviser”), which is wholly-owned by Main Street Capital Corporation (“Main Street”), a New York Stock Exchange listed BDC, as MSIF’s investment adviser and administrator under an Investment Advisory and Administrative Services Agreement dated October 30, 2020 (the “Current Investment Advisory Agreement”). In such role, the Adviser has the responsibility to manage our business, including the responsibility to identify, evaluate, negotiate and structure prospective investments, make investment and portfolio management decisions, monitor our Investment Portfolio and provide ongoing administrative services.
MSIF has certain direct and indirect wholly-owned subsidiaries that have elected to be taxable entities (the “Taxable Subsidiaries”). The primary purpose of the Taxable Subsidiaries is to permit MSIF to hold equity investments in portfolio companies which are “pass-through” entities for tax purposes. MSIF also has certain direct and indirect wholly-owned subsidiaries formed for financing purposes (the “Structured Subsidiaries”).
Overview of Our Business
Our principal investment objective is to maximize our Investment Portfolio’s total return, primarily by generating current income from our debt investments and, to a lesser extent, by generating current income and capital appreciation from our equity and equity-related investments, including warrants, convertible securities and other rights to acquire equity securities in a portfolio company. We seek to achieve our investment objective through our Private Loan and LMM investment strategies. A portion of our Private Loan investments may include equity investments in our Private Loan companies. Our Private Loan investment strategy involves investments in companies that generally have annual revenues between $25 million and $500 million and annual earnings before interest, tax, depreciation and amortization expenses (“EBITDA”) between $7.5 million and $50 million. Our LMM investment strategy involves investments in companies that generally have annual revenues between $10 million and $150 million and annual EBITDA between $3 million and $20 million. Our Private Loan and LMM investments generally range in size from $1 million to $20 million. Geographically, we maintain a diversified portfolio throughout the United States.
Private Loan investments primarily consist of debt securities that have primarily been originated directly by our Adviser or, to a lesser extent, through our Adviser’s strategic relationships with other investment funds on a collaborative basis through investments that are often referred to in the debt markets as “club deals” because of the small lender group size. Our Private Loan investments are typically made in a company owned by or in the process of being acquired by a private equity fund. Our Private Loan portfolio debt investments are generally secured by a first priority lien on the assets of the portfolio company and typically have a term of between three and seven years from the original investment date. We may also co-invest with Main Street and the private equity funds in the equity securities of our Private Loan portfolio companies.
We seek to avoid Private Loan investments in businesses with the following characteristics: distressed situations, highly cyclical or seasonal revenues, low operating margins, high capital intensity, high customer concentration, and inexperienced management teams. Our target loan profiles for Private Loan investments typically include a total leverage level below 4.5x EBITDA, a debt-to-enterprise value below 60%, and companies with demonstrated historical cash flow generation. As of September 30, 2024 and based upon cost, our Private Loan investment portfolio generation consisted of 47.1% lead investments, which are investments where our Adviser was the lender leading the lenders’ activities on the Private Loan investment (which include, but are not limited to, sourcing the opportunity, due diligence procedures, negotiations, supervision of legal documentation and post-investment monitoring, with these activities together, the “Lender Activities”), 25.0% co-lead investments, which are investments where our Adviser was a co-lead with another lender for the Lender Activities, and 27.9% club investments, which are investments where our Adviser was not leading or co-leading the Lender Activities (excluding Private Loan investments closed by LMM investment teams, which in aggregate represent approximately 3.3% and 3.5% of our total Private Loan investment portfolio at cost and fair value, respectively, as of September 30, 2024). The portfolio company ownership within our Private Loan portfolio, based upon cost as of September 30, 2024, consisted of 97% owned by a private equity fund and 3% owned by a non-private equity fund party (excluding Private Loan investments closed by LMM investment teams). Since January 1, 2021 through September 30, 2024, our Adviser’s Private Credit investment team reviewed approximately 1,045 Private Loan investment opportunities and closed 74 investments; we participated in 73 of such investments.
We also seek to fill the financing gap for LMM businesses, which, historically, have had limited access to financing from commercial banks and other traditional sources. The underserved nature of the LMM creates the opportunity for us to meet the financing needs of LMM companies while also negotiating favorable transaction terms and equity participation. Our ability to invest across a company’s capital structure, from secured loans to equity securities, allows us to offer portfolio companies a comprehensive suite of financing options, or a “one-stop” financing solution. We believe that providing customized, “one-stop” financing solutions is important and valuable to LMM portfolio companies. We generally seek to partner directly with entrepreneurs, management teams and business owners in making our LMM investments. Our LMM portfolio debt investments are generally secured by a first lien on the assets of the portfolio company and typically have a term of between five and seven years from the original investment date. Our target purchase price multiple for LMM investments is between 4.5x – 6.5x enterprise value-to-EBITDA.
In contemplation of this public offering, our board of directors and the Adviser decided to shift our future investment strategy with respect to new platform investments to be solely focused on our Private Loan investment strategy. As a result, the size of our LMM investment strategy portfolio is expected to decrease over time as we make new investments consistent with our Private Loan investment strategy and our existing LMM investment strategy investments are repaid or sold in the ordinary course of business. We do, however, plan to continue executing follow on investments in our existing LMM portfolio companies going forward in accordance with our existing SEC order for co-investment exemptive relief.
We also maintain our legacy Middle Market investment portfolio. Our Middle Market investments are generally debt investments in companies owned by private equity funds that were originally issued through a syndication financing process. We have generally stopped making new Middle Market investments and expect our Middle Market investment portfolio to continue to decline in future periods as existing Middle Market investments are repaid or sold. Our Middle Market debt investments generally range in size from $1 million to $20 million, are generally secured by a first priority lien on the assets of the portfolio company and typically have an expected duration of between three and seven years from the original investment date.
Our other portfolio (“Other Portfolio”) investments primarily consist of investments that are not consistent with the typical profiles for our Private Loan, LMM or Middle Market portfolio investments, including investments in non-affiliated investment companies and private funds managed by third parties. In our Other Portfolio, we may incur indirect fees and expenses to third party managers. Similar to our Middle Market investments, we have generally stopped making new Other Portfolio investments and expect our Other Portfolio to continue to decline in future periods as existing Other Portfolio investments are repaid or sold.
Our portfolio investments are generally made through MSIF, the Taxable Subsidiaries and the Structured Subsidiaries. MSIF, the Taxable Subsidiaries and the Structured Subsidiaries share the same investment strategies and criteria. An investor’s return in MSIF will depend, in part, on the Taxable Subsidiaries’ and the Structured Subsidiaries’ investment returns as they are wholly-owned subsidiaries of MSIF.
The level of new portfolio investment activity will fluctuate from period to period based upon our view of the current economic fundamentals, our ability to identify new investment opportunities that meet our investment criteria, and our ability to consummate the identified opportunities and our available liquidity. The level of new investment activity, and associated interest and fee income, will directly impact future investment income. In addition, the level of dividends paid by portfolio companies and the portion of our portfolio debt investments on non-accrual status will directly impact future investment income. While we intend to grow our portfolio and our investment income over the long term, our growth and our operating results may be more limited during depressed economic periods. However, we intend to appropriately manage our cost structure and liquidity position based on applicable economic conditions and our investment outlook. The level of realized gains or losses and unrealized appreciation or depreciation on our investments will also fluctuate depending upon portfolio activity, economic conditions and the performance of our individual portfolio companies. The changes in realized gains and losses and unrealized appreciation or depreciation could have a material impact on our operating results.
We have received an exemptive order from the SEC permitting co-investments among us, Main Street and other funds and clients advised by our Adviser in certain negotiated transactions where co-investing would otherwise be prohibited under the 1940 Act. We have made co-investments with, and in the future intend to continue to make co-investments with Main Street and other funds and clients advised by our Adviser, in accordance with the conditions of the order. The order requires, among other things, that we and our Adviser consider whether each such investment opportunity is appropriate for us, Main Street and the other funds and clients advised by our Adviser, as applicable, and if it is appropriate, to propose an allocation of the investment opportunity between such parties. Because our Adviser is wholly-owned by Main Street and is not managing our investment activities as its sole activity, this may provide our Adviser an incentive to allocate opportunities to Main Street, other participating funds and other clients instead of us. However, both we and our Adviser have policies and procedures in place to manage this conflict, including oversight by the independent members of our board of directors. In addition to the co-investment program described above, we also co-invest in syndicated deals and other transactions where price is the only negotiated point by us and our affiliates.
Market Opportunity
We believe that the investing environment in the markets served by our Private Loan and LMM investment strategies continues to be attractive, providing strong risk-adjusted returns due to structural and market factors. We believe that when private equity sponsors experience the flexibility of private credit financing solutions and the speed and certainty of execution, they will continue to consider financing from non-bank lenders. Additionally, we believe that our target market in our Private Loan investment strategy (companies with $7.5 million to $50 million of EBITDA) continues to be underserved. This has allowed us to establish ourselves as a “go-to” player in the space. These factors present a compelling opportunity for us to invest in quality companies on attractive terms and conditions. Certain private equity sponsors who historically sought to finance their transactions in the public, syndicated markets or with commercial banks have turned to private credit providers, including us, to finance their transactions.
Competitive Advantage
Ability to leverage the Main Street platform
We believe that our Adviser’s expertise in analyzing, valuing, structuring, negotiating and closing transactions provides us with a competitive advantage in offering customized financing solutions to companies. Main Street has a substantial network of business relationships with individuals, companies and institutions in the United States, which we believe is a consistent source of investment opportunities for us and differentiates us relative to other BDCs. Additionally, we believe that this network assists our portfolio companies through our ability to make introductions and referrals to Main Street’s key third-party relationships.
Diversified investment strategy differentiates MSC Income Fund from other investment funds
We have a U.S.-focused Private Loan investment strategy, investing primarily in senior secured, first lien loans of companies owned by, or being acquired by private equity funds. We also have a LMM investment strategy focused on investing in partnership with business owners and management teams of companies in the underserved LMM. Our core focus is sourcing investment opportunities in companies with significantly lower EBITDA versus many BDC peers, as we believe these companies are underserved from a financing standpoint. We believe the underserved nature of the market we serve results in an enhanced risk profile: including smaller lending groups, more control over underwriting, structure and documentation, and better communication and more direct interaction with the portfolio company, its management team and its private equity sponsor. Lastly, we believe that the lower leverage ratios of our portfolio companies at the time of our initial debt investment allow for greater downside protection and that the lower equity investment valuations at the time of our initial equity investment allow opportunities for higher levels of future capital appreciation. As a result of our unique investment strategies, we also have minimal portfolio company overlap versus most BDC peers, many of which have significant overlap and commonality within their investment portfolios and therefore represent common risk profiles, which we believe allows us to provide a unique investment opportunity for our investors, including the benefits of differentiation and diversification away from most BDC peers.
Experienced investment team with a strong track record
Our Adviser is served by experienced investment professionals within Main Street’s platform. Our Adviser’s investment professionals are responsible for the origination, due diligence, underwriting, structuring and monitoring of each investment throughout its life cycle. In addition, the Main Street platform includes numerous professionals focused on its legal, compliance, risk management, finance, accounting and tax functions who help support our Adviser’s investment professionals by providing guidance on our operations. As of September 30, 2024, our Adviser had 104 professionals, including 58 dedicated investment professionals, with the senior investment professionals averaging 22 years of experience and with an average of 11 years of experience at Main Street.
Stockholder alignment
As of September 30, 2024, our directors and executive officers own 0.2% of our outstanding shares of common stock, while Main Street owns 2.7% of our outstanding shares. These ownership stakes are important factors that align interests between our Adviser, management and stockholders.
Stockholder friendly cost structure
Effective upon a listing of our shares of common stock on a national securities exchange (such as the New York Stock Exchange) (a “Listing”), we and the Adviser intend to amend the Current Investment Advisory Agreement to better align with our transition to focus on our Private Loan investment strategy. The changes to the Current Investment Advisory Agreement include (i) a reduction in the annual base management fees payable by us to our Adviser (with additional future contractual reductions based upon our investment portfolio composition), (ii) amendments to the structure of the subordinated incentive fee on income payable by us to our Adviser and reductions in the hurdle, catch-up percentage and incentive fee rates, including the adoption of a differentiated and stockholder friendly 50% / 50% catch-up feature, (iii) a reduction to and reset of the incentive fee on capital gains payable by us to our Adviser, (iv) establishment of a cap on the amount of expenses payable by us relating to certain internal administrative services, which varies based on the value of our total assets and (v) other changes to delete provisions required by the Omnibus Guidelines promulgated by the North American Securities Administrators Association, Inc. (“NASAA Guidelines”). We believe that our revised fee structure is among industry leaders and provides strong alignment with stockholders.
Investment Criteria
Our Adviser’s investment team has identified the following investment criteria that it believes are important in evaluating prospective portfolio companies. Our Adviser’s investment team uses these criteria in evaluating investment opportunities. However, not all of these criteria have been, or will be, met in connection with each of our investments:
•Established Companies with Positive Cash Flow. We seek to invest in established companies with sound historical financial performance. We primarily pursue investments in Private Loan companies that have historically generated annual EBITDA of $7.5 million to $50 million. We also seek to invest in LMM companies that have historically generated annual EBITDA of $3 million to $20 million. We generally do not invest in start-up companies or companies with speculative business plans.
•Defensible Competitive Advantages/Favorable Industry Position. We primarily focus on companies having competitive advantages in their respective markets and/or operating in industries with barriers to entry, which may help to protect their market position and profitability.
•Proven Management Team with Meaningful Equity Stake. We look for operationally-oriented management with direct industry experience and a successful track record. We believe management teams with these attributes are more likely to manage the companies in a manner that protects our investment.
•Exit Alternatives. We exit our debt investments primarily through the repayment of our investment from internally generated cash flow of the portfolio company and/or a refinancing. In addition, we seek to invest in companies whose business models and expected future cash flows may provide alternate methods of repaying our investment, such as through a strategic acquisition by other industry participants or a recapitalization.
Investment Portfolio
The following tables provide a summary of our investments in our Private Loan, LMM and Middle Market investment strategies as of September 30, 2024 and December 31, 2023 (excluding certain investments in Other Portfolio investments).
| | | | | | | | | | | | | | | | | |
| As of September 30, 2024 |
| Private Loan | | LMM (a) | | Middle Market |
| (dollars in millions) |
| Number of portfolio companies | 84 | | | 55 | | | 11 | |
| Fair value | $ | 679.9 | | | $ | 411.0 | | | $ | 46.1 | |
| Cost | $ | 700.0 | | | $ | 340.5 | | | $ | 73.0 | |
| Debt investments as a % of portfolio (at cost) | 95.6 | % | | 70.8 | % | | 88.9 | % |
| Equity investments as a % of portfolio (at cost) | 4.4 | % | | 29.2 | % | | 11.1 | % |
| % of debt investments at cost secured by first priority lien | 99.9 | % | | 99.9 | % | | 99.9 | % |
| Weighted-average annual effective yield (b) | 12.7 | % | | 13.2 | % | | 14.1 | % |
| Average EBITDA (c) | $ | 33.2 | | | $ | 10.0 | | | $ | 44.3 | |
_____________________________
(a)As of September 30, 2024, we had equity ownership in all of our LMM portfolio companies, and the average fully diluted equity ownership in those portfolio companies was 9%.
(b)The weighted-average annual effective yields were computed using the effective interest rates for all debt investments as of September 30, 2024, including amortization of deferred debt origination fees and accretion of original issue discount but excluding fees payable upon repayment of the debt instruments and any debt investments on non-accrual status, and are weighted based upon the principal amount of each applicable debt investment as of September 30, 2024. The weighted-average annual effective yield on our debt portfolio as of September 30, 2024 including debt investments on non-accrual status was 12.1% for our Private Loan portfolio, 11.8% for our LMM portfolio and 9.4% for our Middle Market portfolio. The weighted-average annual effective yield of our entire investment portfolio as of September 30, 2024, including debt investments on non-accrual status was 11.9%. The weighted-average annual effective yield is not reflective of what an investor in shares of our common stock will realize on its investment because it does not reflect our utilization of debt capital in our capital structure, our expenses or any sales load paid by an investor. The total return based on change in the Company’s net asset value (“NAV”) was 6.4% (not annualized) for the nine months ended September 30, 2024. See “Financial Highlights” below.
(c)The average EBITDA is calculated using a weighted-average for the Private Loan and Middle Market portfolios and a simple average for the LMM portfolio. These calculations exclude certain portfolio companies, including two Private Loan portfolio companies, two LMM portfolio companies and one Middle Market portfolio company, as EBITDA is not a meaningful valuation metric for our investments in these portfolio companies, and those portfolio companies whose primary purpose is to own real estate and those portfolio companies whose primary operations have ceased and only residual value remains.
| | | | | | | | | | | | | | | | | |
| As of December 31, 2023 |
| Private Loan | | LMM (a) | | Middle Market |
| (dollars in millions) |
| Number of portfolio companies | 78 | | | 50 | | | 16 | |
| Fair value | $ | 595.3 | | | $ | 387.0 | | | $ | 86.0 | |
| Cost | $ | 586.4 | | | $ | 315.7 | | | $ | 114.7 | |
| Debt investments as a % of portfolio (at cost) | 94.1 | % | | 70.2 | % | | 93.1 | % |
| Equity investments as a % of portfolio (at cost) | 5.9 | % | | 29.8 | % | | 6.9 | % |
| % of debt investments at cost secured by first priority lien | 100.0 | % | | 99.9 | % | | 100.0 | % |
| Weighted-average annual effective yield (b) | 13.1 | % | | 13.0 | % | | 13.0 | % |
| Average EBITDA (c) | $ | 30.5 | | | $ | 8.8 | | | $ | 74.2 | |
_____________________________
(a)As of December 31, 2023, we had equity ownership in all of our LMM portfolio companies, and the average fully diluted equity ownership in those portfolio companies was 9%.
(b)The weighted-average annual effective yields were computed using the effective interest rates for all debt investments as of December 31, 2023, including amortization of deferred debt origination fees and accretion of original issue discount but excluding fees payable upon repayment of the debt instruments and any debt investments on non-accrual status, and are weighted based upon the principal amount of each applicable debt investment as of December 31, 2023. The weighted-average annual effective yield on our debt portfolio as of December 31, 2023 including debt investments on non-accrual status was 12.6% for our Private Loan portfolio, 13.0% for our LMM portfolio and 9.9% for our Middle Market portfolio. The weighted-average annual effective yield on our entire investment portfolio as of December 31, 2023, including debt investments on non-accrual status, was 12.4%. The weighted-average annual effective yield is not reflective of what an investor in shares of our common stock will realize on its investment because it does not reflect our utilization of debt capital in our capital structure, our expenses or any sales load paid by an investor. The total return based on change in the Company’s NAV was 10.9% for the year ended December 31, 2023. See “Financial Highlights” below.
(c)The average EBITDA is calculated using a weighted-average for the Private Loan and Middle Market portfolios and a simple average for the LMM portfolio. These calculations exclude certain portfolio companies, including one Private Loan portfolio company, as EBITDA is not a meaningful valuation metric for our investment in this portfolio company, and those portfolio companies whose primary purpose is to own real estate.
Our Adviser and the Administrator
On October 28, 2020, our stockholders approved the appointment of the Adviser as our investment adviser and administrator under the Current Investment Advisory Agreement. In such role, our Adviser has the responsibility to manage our business, including the responsibility to identify, evaluate, negotiate and structure prospective investments, make investment and portfolio management decisions, monitor our Investment Portfolio and provide our ongoing administrative services.
Our Adviser is a wholly-owned subsidiary of Main Street, an internally managed, listed BDC whose common stock trades on the New York Stock Exchange under the ticker symbol “MAIN”. The same investment professionals who provide investment advisory services to us at the Adviser comprise the investment management team of Main Street. Main Street and the Adviser have developed a reputation in the marketplace as a responsible and efficient source of financing, which has created a stream of proprietary deal flow for us. As of September 30, 2024, Main Street had total investments with an aggregate fair value of $4.9 billion in 208 portfolio companies (including an aggregate of 193 Private Loan, LMM and Middle Market portfolio companies) and capital under management of $8.0 billion (including total assets and undrawn portions of debt capital of Main Street and clients managed by the Adviser, its wholly-owned subsidiary). As of September 30, 2024, Main Street had invested over $11.6 billion of capital since its inception. We believe that our Adviser’s expertise in analyzing, valuing, structuring, negotiating and closing transactions provides us with a competitive advantage in offering customized financing solutions to companies. Our Adviser’s investment team is responsible for identifying investment opportunities, conducting research and due diligence on prospective investments, structuring our investments and monitoring and servicing our investments. As of September 30, 2024, our Adviser’s
investment team was comprised of 58 investment professionals, all of whom dedicate a substantial portion of their time to us. In addition, our Adviser had 46 dedicated operations professionals as of September 30, 2024. The Adviser believes that it has experienced support personnel, including individuals with expertise in risk management, legal, accounting, tax, information technology and compliance, among others.
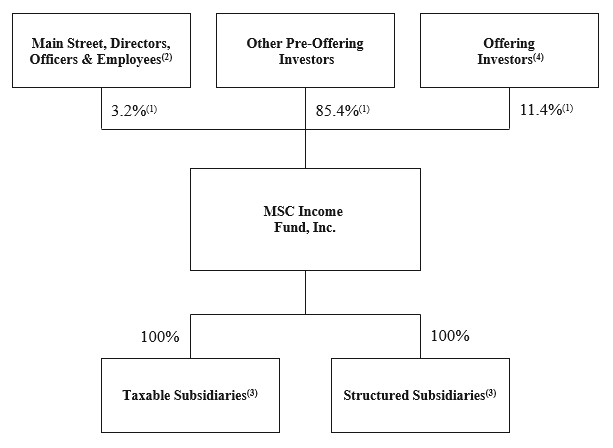
Corporate Structure
The following diagram depicts our organizational structure upon the closing of this offering:
_____________________________
(1)Assumes (1) that Main Street purchases 289,761 shares in this offering (see “The Offering – Main Street Indication of Interest”), (2) that no shares of our common stock are sold through the directed share program described elsewhere in this prospectus and (3) that the underwriters do not exercise their option to purchase additional shares of common stock.
(2)Includes Main Street, certain officers and employees of Main Street and certain directors and officers of the Company.
(3)From time to time, we may form subsidiaries to facilitate our normal course of business investing activities. A “subsidiary” is an entity that primarily engages in investment activities in securities or other assets that is wholly- owned by us, including existing Taxable Subsidiaries and Structured Subsidiaries. We comply with the 1940 Act provisions governing capital structure and leverage on an aggregate basis with such wholly-owned subsidiaries, and each such subsidiary complies with the 1940 Act provisions relating to affiliated transactions and custody and is subject to the same principal investment strategies and principal risks of the Company. Any investment adviser to such wholly-owned subsidiary will comply with the provisions of the 1940 Act relating to investment advisory contract approval as if it were an investment adviser to an investment company under the 1940 Act. We do not intend to create or acquire primary control of any subsidiary that primarily engages in investment activities in securities or other assets other than entities wholly-owned by us. Each of the Taxable Subsidiaries and the Structured Subsidiaries uses the same custodians as the Company.
(4)Excludes Main Street, officers and employees of Main Street and directors and officers of the Company.
Current Investment Advisory Agreement and New Investment Advisory Agreement
Subject to the overall supervision of our board of directors, our Adviser oversees our day-to-day operations and provides us with investment advisory services and ongoing administrative services. Under the terms of the Current Investment Advisory Agreement and the New Investment Advisory Agreement (as defined below), our Adviser, among other things: (i) determines the composition and allocation of our Investment Portfolio, the nature and timing of any changes therein and the manner of implementing such changes; (ii) identifies, evaluates and negotiates the structure of our investments; (iii) executes and closes the acquisition of, and monitors and services, our investments; (iv) determines the securities and other assets that we purchase, retain, or sell; and (v) performs due diligence on our prospective investments and portfolio companies.
The Current Investment Advisory Agreement was most recently re-approved by our board of directors, including a majority of members who are not “interested” persons (as defined by the 1940 Act) of MSC Income Fund or the Adviser, on July 17, 2024. In connection with this offering, we intend to enter into an amended and restated investment advisory and administrative services agreement with our Adviser (the “New Investment Advisory Agreement”), which was approved by our board of directors, including a majority of members who are not “interested” persons (as defined by the 1940 Act) of the Company or the Adviser, on July 17, 2024 (and subsequently ratified at an in-person meeting on August 13, 2024). The New Investment Advisory Agreement was approved by the affirmative vote of the holders of a majority of our outstanding voting securities, as defined in the 1940 Act, at a special meeting of stockholders held on December 11, 2024, and will be effective for an initial two-year term upon a Listing.
The New Investment Advisory Agreement, among other things, (i) reduces the annual base management fees payable by us to our Adviser, (ii) amends the structure of the subordinated incentive fee on income payable by us to our Adviser and reduces the hurdle, catch-up percentage and incentive fee rates, (iii) reduces and resets the incentive fee on capital gains payable by us to our Adviser, (iv) places a cap on the amount of expenses payable by us relating to certain internal administrative services, which varies based on the value of our total assets and (v) deletes provisions required by NASAA Guidelines.
Reduction in Base Management Fees
The New Investment Advisory Agreement reduces the annual base management fee from 1.75% of our average total assets to 1.5% of our average total assets (including cash and cash equivalents), payable quarterly in arrears. calculated based on the average value of our total assets (including cash and cash equivalents) at the end of the two most recently completed calendar quarters. The determination of total assets will reflect changes in the fair value of our portfolio investments reflecting both unrealized appreciation and unrealized depreciation.
In addition, under the New Investment Advisory Agreement, the base management fee will be further reduced to an annual rate of (i) 1.25% of the average fair value of our total assets (including cash and cash equivalents) commencing with the first full calendar quarter following the date on which the aggregate fair value of our investments in our lower middle market investment strategy (“LMM portfolio investments”) falls below 20% of our total Investment Portfolio at fair value, and (ii) 1.00% of the average fair value of our total assets (including cash and cash equivalents) commencing with the first full calendar quarter following the date on which the aggregate fair value of our LMM portfolio investments falls below 7.5% of our total Investment Portfolio at fair value.
Changes to the Subordinated Incentive Fee, Capital Gains Incentive Fee and Reduction in Hurdle and Incentive Fee Rates
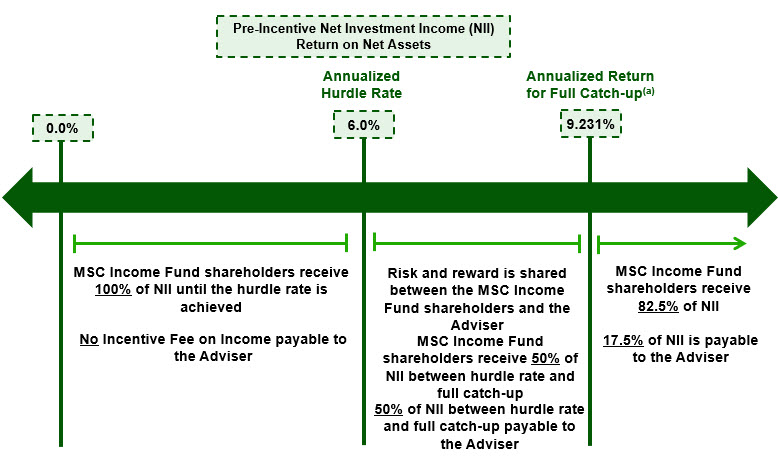
The New Investment Advisory Agreement amends the structure of the subordinated incentive fee on income in a manner that expresses the “hurdle rate” required for our Adviser to earn, and be paid, the incentive fee as a percentage of our “net assets” rather than “Adjusted Capital” (as defined below).
The New Investment Advisory Agreement also reduces the incentive fee rate and the hurdle rate. Under the New Investment Advisory Agreement, the subordinated incentive fee on income will be (i) reduced from 20% under the Current Investment Advisory Agreement to 17.5% and (ii) calculated and payable quarterly in arrears based on “pre-incentive fee net investment income” for the immediately preceding calendar quarter, subject to a “hurdle rate”, expressed as a rate of return on our net assets, equal to 1.5% per quarter, or an annualized rate of 6.0%. Our Adviser will receive 50% of pre-incentive fee net investment income once the hurdle rate is exceeded (decreased from 100% under the Current Investment Advisory Agreement) until the quarterly rate of 2.307692% (compared to 2.34375% under the
Current Investment Advisory Agreement), or 9.230769% annualized (compared to 9.375% under the Current Investment Advisory Agreement), is exceeded, at which point our Adviser will receive 17.5% (compared to 20% under the Current Investment Advisory Agreement) of all pre-incentive fee net investment income.
“Adjusted Capital” is defined in the Current Investment Advisory Agreement to mean cumulative gross proceeds generated from sales of our common stock (including proceeds from our distribution reinvestment plan) reduced for non-liquidating distributions, other than distributions of profits, paid to our stockholders and amounts paid for share repurchases pursuant to our share repurchase program.
In addition, the New Investment Advisory Agreement reduces the incentive fee on capital gains that we are obligated to pay to our Adviser to 17.5% from 20% of our incentive fee capital gains, which will be earned on liquidated investments from our Investment Portfolio, net of any income tax expense associated with such realized capital gains. Under the New Investment Advisory Agreement, the incentive fee on capital gains will be determined and payable in arrears as of the end of each calendar year (or upon termination of the New Investment Advisory Agreement). This fee will equal (a) 17.5% of our incentive fee capital gains, which will equal our realized capital gains (net of any related income tax expense) on a cumulative basis from the effective date of the New Investment Advisory Agreement, calculated as of the end of each calendar year thereafter (or upon termination of the New Investment Advisory Agreement), computed net of (1) all realized capital losses on a cumulative basis (net of any related income tax benefit) from the effective date of the New Investment Advisory Agreement, and (2) unrealized capital depreciation (net of any related income tax benefit) on a cumulative basis from the effective date of the New Investment Advisory Agreement, less (b) the aggregate amount of any previously paid capital gain incentive fees from the effective date of the New Investment Advisory Agreement. For purposes of calculating each component of the incentive fee capital gains under the New Investment Advisory Agreement, (1) the cost basis for any investment held as of the effective date of the New Investment Advisory Agreement will be deemed to be the fair value for such investment as of the most recent quarter end immediately prior to the effective date of the New Investment Advisory Agreement and, with respect to any investment acquired subsequent to the effective date of the New Investment Advisory Agreement, the cost basis will equal the cost basis of such investment as reflected in our financial statements and (2) the income tax expense or benefit associated with all investments will be measured from the most recent quarter end immediately prior to the effective date of the New Investment Advisory Agreement through the date of any such calculation.
In addition, the subordinated incentive fee on income for any partial quarter and the incentive fee on capital gains for any partial year and quarter under the New Investment Advisory Agreement will be appropriately pro-rated.
_____________________________
(a)Annualized pre-incentive fee net investment income return at which the catch-up is fully satisfied assuming a 17.5% incentive fee on pre-incentive fee net investment income and a 50%/50% catch-up feature as prescribed in the New Investment Advisory Agreement.
Administrative Expenses and Limitations on Reimbursement for Administrative Expenses
The Current Investment Advisory Agreement includes provisions stating that we shall bear the costs and expense of our organization, operations and administration and provides that we shall either pay such costs and expenses directly, or through reimbursement to our Adviser. The Current Investment Advisory Agreement additionally outlines a number of costs and expenses relating to our day-to-day administration and management, including certain expenses related to personnel. The Adviser has historically waived reimbursement for all such “internal administrative services expenses,” except for such expenses for services that were previously provided by an external third-party that were later internalized by the Adviser. This waiver is discretionary and can be discontinued at any point in the future. Under the New Investment Advisory Agreement, this waiver is memorialized as a quarterly cap on our obligation to reimburse the Adviser for “Internal Administrative Expenses.”
“Internal Administrative Expenses” are defined under the New Investment Advisory Agreement as the actual cost of the personnel of the Adviser or its affiliates performing the functions of chief financial officer and chief compliance officer and other personnel of the Adviser or its affiliates engaged to provide day-to-day administrative and non-advisory management services or professional services for us in-house (including legal services, tax services, internal audit services, technology-related services and services in connection with compliance with federal and state laws) including, without limitation, direct compensation costs, including the allocable portion of salaries, bonuses, benefits and other direct costs associated therewith), and related overhead costs, including rent, allocated by the Adviser to us in a reasonable manner, without markup. Under the New Investment Advisory Agreement, we will not, and will not be obligated, to reimburse the Adviser for Internal Administrative Expenses in an amount that exceeds on a quarterly basis the product obtained by multiplying (x) the value of our total assets (including cash and cash equivalents) at the end of each calendar quarter by (y) the applicable “Annual Basis Point Rate” set forth in the below table:
| | | | | | | | |
| Total Assets | | Annual Basis Point Rate |
| $0 – $500 million | | 6.0 |
| Over $500 million – $1.25 billion | | 5.125 |
| Greater than $1.25 billion | | 4.5 |
Summary Principal Risk Factors
An investment in our securities, including shares of our common stock, involves a high degree of risk and may be considered speculative. The following is a summary of the principal risks that you should carefully consider before investing in our securities. Further details regarding each risk included in the below summary list can be found in “Risk Factors” beginning on page 29 of this prospectus. Risks Related to our Business and Structure
•Because our investments are recorded at fair value, there is and will continue to be uncertainty as to the value of our investments.
•We are subject to risks associated with the interest rate environment and changes in interest rates will affect our cost of capital, net investment income and the value of our investments.
•We are dependent upon our Adviser’s key investment personnel for our future success.
•Our business model depends to a significant extent upon strong referral relationships.
Risks Related to our Investments
•The types of portfolio companies in which we invest involve significant risks and we could lose all or part of our investment.
•Economic recessions or downturns could impair our portfolio companies’ performance and defaults by our portfolio companies will harm our operating results.
•Inflation could adversely affect the business, results of operations and financial condition of our portfolio companies.
•We may be exposed to higher risks with respect to our investments that include original issue discount or Payment-in-Kind (“PIK”) interest.
•The lack of liquidity in our investments may adversely affect our business.
•There may be circumstances where our debt investments could be subordinated to claims of other creditors or we could be subject to lender liability claims.
•Defaults by our portfolio companies will harm our operating results.
•We may be subject to risks associated with “covenant-lite” loans.
Risks Related to Leverage
•Because we borrow money, the potential for gain or loss on amounts invested in us is magnified and may increase the risk of investing in us.
•Substantially all of our assets are subject to security interests under our senior securities and if we default on our obligations under our senior securities, we may suffer adverse consequences, including foreclosure on our assets.
Risks Related to our Adviser and its Affiliates
•Our Adviser has conflicts of interest that may create an incentive for the Adviser to enter into investments that are riskier or more speculative than would otherwise be the case and our Adviser may have an incentive to increase portfolio leverage in order to earn higher management fees.
•Our Adviser may face conflicts of interest in allocating investment opportunities between us, Main Street and the other funds and accounts managed by our Adviser.
Risks Related to this Offering and an Investment in Shares of our Common Stock
•Investing in our shares may involve a high degree of risk.
•There are material limitations with making available preliminary estimates of our financial results for the fiscal quarter and year ended December 31, 2024 prior to the completion of our and our auditor’s financial review procedures for such period.
•Prior to this offering, there has been no public market for shares of our common stock, and we cannot assure you that a market for shares of our common stock will develop or that the market price of shares of our common stock will not decline following the offering.
•We may not be able to pay distributions to our stockholders, our distributions may not grow over time, and a portion of distributions paid to our stockholders may be a return of capital.
•Purchases of shares of our common stock by us or Main Street under open-market purchase programs, including the Company Rule 10b5-1 Stock Repurchase Plan and the Main Street Rule 10b5-1 Purchase Plan, may result in the price of shares of our common stock being higher than the price that otherwise might exist in the open market.
•Sales of substantial amounts of our common stock in the public market may have an adverse effect on the market price of our common stock.
Federal Income Tax Risks
•We will be subject to corporate-level U.S. federal income tax if we are unable to qualify as a RIC under Subchapter M of the Code.
•We may have difficulty paying the distributions required to maintain RIC tax treatment under the Code if we recognize income before or without receiving cash representing such income.
Open-Market Share Repurchase Program and Main Street Rule 10b5-1 Stock Purchase Plan
In connection with or shortly after the closing of this offering, we intend to enter into the Company Rule 10b5-1 Stock Repurchase Plan, and Main Street intends to enter into the Main Street Rule 10b5-1 Stock Purchase Plan, each as described further below. The terms and conditions of the Company Rule 10b5-1 Stock Repurchase Plan and of the Main Street Rule 10b5-1 Purchase Plan will be substantially similar. Subject to the limitations under Rule 10b-18 under the Exchange Act and market conditions, the Company expects that the aggregate amount of shares of our common stock (1) repurchased under the Company Rule 10b5-1 Stock Repurchase Plan and (2) purchased under the Main Street Rule 10b5-1 Purchase Plan on any single trading day will be split among the Company and Main Street on a pro rata basis (or as close thereto as reasonably possible) based upon the proportion of the aggregate $85 million repurchase/purchase commitment represented by the respective share repurchase/purchase program (i.e., the Company expects that approximately 76.5% of the aggregate market value of shares purchased in a single trading day under the Company Rule 10b5-1 Stock Repurchase Plan and the Main Street Rule 10b5-1 Purchase Plan will be repurchased by the Company, while the remaining 23.5% will be purchased by Main Street). There is no assurance that the Company or Main Street will repurchase or purchase any shares of our common stock at any specific discount levels or in any specific amounts under the Company Rule 10b5-1 Stock Repurchase Plan or the Main Street Rule 10b5-1 Purchase Plan. There is no assurance that the market price of our shares of common stock, either absolutely or relative to NAV, will increase as a result of any share repurchases/purchases, or that the Company Rule 10b5-1 Stock Repurchase Plan or the Main Street Rule 10b5-1 Purchase Plan will enhance stockholder value over the long term.
Our board of directors authorized us to repurchase shares of our common stock through an open-market share repurchase program for up to $65.0 million in the aggregate of shares of our common stock for a 12-month period starting on a date determined by the Company following the consummation of this offering. Pursuant to such authorization, we intend to enter into the Company Rule 10b5-1 Stock Repurchase Plan, in connection with or shortly after the closing of this offering, to facilitate the repurchase of up to the full $65.0 million in shares of our common stock authorized under the share repurchase program.
The Company Rule 10b5-1 Stock Repurchase Plan is intended to allow us to repurchase shares of our common stock at times when we otherwise might be prevented from doing so under insider trading laws. The Company Rule 10b5-1 Stock Repurchase Plan will require our agent to repurchase shares of common stock on our behalf when the market price per share of our common stock is below the most recently reported NAV per share of our common stock by certain pre-determined levels (including any updates, corrections or adjustments publicly announced by us to any previously announced NAV per share). Under the Company Rule 10b5-1 Stock Repurchase Plan, the agent may increase the volume of purchases made as the price of our common stock declines, subject to volume restrictions.
The repurchase of shares pursuant to the Company Rule 10b5-1 Stock Repurchase Plan is intended to satisfy the conditions of Rule 10b5-1 and Rule 10b-18 under the Exchange Act and will otherwise be subject to applicable law, including Regulation M, which may prohibit purchases under certain circumstances.
The Company Rule 10b5-1 Stock Repurchase Plan will commence beginning 60 calendar days following the end of the “restricted period” under Regulation M and terminate upon the earliest to occur of (i) 12 months from the date of commencement of the Company Rule 10b5-1 Stock Repurchase Plan, (ii) the end of the trading day on which the aggregate purchase price for all shares purchased under the Company Rule 10b5-1 Stock Repurchase Plan equals $65.0 million and (iii) the occurrence of certain other events described in the Company Rule 10b5-1 Stock Repurchase Plan.
In addition, Main Street intends to purchase up to $20.0 million in the aggregate of shares of our common stock in the open market, for a 12-month period starting on a date determined by Main Street following the consummation of this offering, pursuant to the terms of the Main Street Rule 10b5-1 Stock Purchase Plan that Main Street intends to enter in connection with or shortly after the closing of this offering.
The Main Street Rule 10b5-1 Stock Purchase Plan is intended to allow Main Street to purchase shares of our common stock at times when it otherwise might be prevented from doing so under insider trading laws. The Main Street Rule 10b5-1 Stock Purchase Plan will require Main Street’s agent to purchase shares of common stock on Main Street’s behalf when the market price per share of our common stock is trading below the most recently reported NAV per share of our common stock by certain pre-determined levels (including any updates, corrections or adjustments publicly announced by us to any previously announced NAV per share). Under the Main Street Rule 10b-1 Stock Purchase Plan, the agent may increase the volume of purchases made as the price of our common stock declines, subject to volume restrictions.
The purchase of shares pursuant to the Main Street Rule 10b5-1 Stock Purchase Plan is intended to satisfy the conditions of Rule 10b5-1 and Rule 10b-18 under the Exchange Act and will otherwise be subject to applicable law, including Regulation M, which may prohibit purchases under certain circumstances.
The Main Street Rule 10b5-1 Stock Purchase Plan will commence beginning 60 calendar days following the end of the “restricted period” under Regulation M and terminate upon the earliest to occur of (i) 12 months from the date of commencement of Main Street Rule 10b5-1 Stock Purchase Plan, (ii) the end of the trading day on which the aggregate purchase price for all shares purchased under the Main Street Rule 10b5-1 Stock Purchase Plan equals $20.0 million and (iii) the occurrence of certain other events described in the Main Street Rule 10b5-1 Stock Purchase Plan.
The “restricted period” under Regulation M will end upon the closing of this offering and, therefore, the common stock repurchases/purchases described above shall not begin prior to 60 days after the closing of this offering. Under Regulation M, the restricted period could end at a later date if the underwriters were to exercise their over-allotment option to purchase shares of our common stock in excess of their short position at the time that they complete their initial distribution of shares of our common stock. In such event, the restricted period would not end until the excess shares of our common stock were distributed by the underwriters or placed in their investment accounts. However, the underwriters have agreed to only exercise their over-allotment option to close out their covered short positions, if any. Therefore, the restricted period under Regulation M will end on the closing of this offering.
Company Information
Our principal executive offices are located at 1300 Post Oak Boulevard, 8th Floor, Houston, Texas 77056. We maintain a website on the Internet at www.mscincomefund.com. We make available free of charge on our website our annual reports on Form 10-K, quarterly reports on Form 10-Q, current reports on Form 8-K and all amendments to those reports as soon as reasonably practicable after such material is electronically filed with or furnished to the SEC. Information contained on our website is not incorporated by reference into this prospectus, and you should not consider that information to be part of this prospectus. Our annual reports on Form 10-K, quarterly reports on Form 10-Q, current reports on Form 8-K, and all amendments to those reports and other public filings are also available free of charge on the EDGAR Database on the SEC’s website at www.sec.gov.
Preliminary Estimates of Fourth Quarter 2024 Results
Our preliminary estimate of fourth quarter 2024 net investment income is $0.35 to $0.36 per share of common stock.
Our preliminary estimate of NAV per share as of December 31, 2024 is $15.50 to $15.56, representing an increase of $0.12 to $0.18 per share, or 0.8% to 1.2% from the NAV per share of $15.38 as of September 30, 2024 (as adjusted for the Reverse Stock Split on a retrospective basis). The estimated increase in NAV per share is primarily due to the net tax benefit recognized for the quarter and the net fair value increase on the investment portfolio resulting from the net unrealized appreciation, partially offset by net realized losses on portfolio investments.
We preliminarily estimate that non-accrual investments comprised 1.5% of our total investment portfolio at fair value and 5.6% at cost as of December 31, 2024.
The preliminary estimates of fourth quarter and full year 2024 financial information and results set forth above are based on our management’s preliminary determinations and current expectations as of the date hereof, and such information is inherently uncertain. The preliminary financial estimates provided herein have been prepared by, and are the responsibility of, management and are subject to completion of our customary year-end closing and review procedures and third-party audit, including the determination of the fair value of our portfolio investments. As a result, actual results could differ materially from the current preliminary estimates based on adjustments made during our year-end closing and review procedures and third-party audit, and our reported information in our Annual Report on Form 10-K for the year ended December 31, 2024 may differ from this information, and any such differences may be material. Neither Grant Thornton LLP, our independent registered public accounting firm, nor any other independent accountants has audited, reviewed, compiled, or performed any procedures with respect to the preliminary financial data set forth above. Accordingly, Grant Thornton LLP does not express an opinion or any form of assurance with respect thereto and assumes no responsibility for, and disclaims any association with, this information.
In addition, the information furnished in set forth above does not include all of the information regarding our financial condition and results of operations for the quarter and full year periods ended December 31, 2024 that may be important to investors. See “Risk Factors — Risks Related to this Offering and an Investment in Shares of our Common Stock — There are material limitations with making available preliminary estimates of our financial results for the fiscal quarter and year ended December 31, 2024 prior to the completion of our and our auditor’s financial review procedures for such period” for more information.
Fourth Quarter 2024 Investment Portfolio Activity
Our fourth quarter 2024 operating activities include the following investment activity in the Private Loan investment portfolio, LMM investment portfolio and Middle Market investment portfolio:
•$29.5 million in total private loan portfolio investments, which after aggregate repayments of debt principal from several private loan portfolio investments and a decrease in cost basis due to a realized loss on a private loan portfolio investment resulted in a net decrease of $5.5 million in the total cost basis of the private loan investment portfolio;
•$30.5 million in total LMM portfolio investments, which after a decrease in cost basis due to a realized loss on a LMM portfolio investment and return of equity invested capital resulted in a net increase of $16.4 million in the total cost basis of the LMM investment portfolio; and
•a net decrease of $7.5 million in the total cost basis of the middle market investment portfolio.
THE OFFERING
Set forth below is additional information regarding the offering of our securities:
| | | | | | | | |
| Common stock offered by us | | 5,500,000 shares (or 6,325,000 shares if the underwriters exercise their option to purchase additional shares to cover over-allotments, if any, in full). |
Common stock to be outstanding immediately after this offering | | 45,740,358 shares (or 46,565,358 shares if the underwriters exercise their option to purchase additional shares in full). |
| Use of proceeds | | We estimate that the net proceeds from this offering (without exercise of the option to purchase additional shares and after deducting the underwriting discounts and commissions and estimated offering expenses payable by us of approximately $6.9 million) will be approximately $78.6 million, based on a public offering price of $15.53 per share. Such estimate assumes the sale of 289,761 shares to Main Street (see “Main Street Indication of Interest” below) and that no shares are sold pursuant to the directed share program described elsewhere in this prospectus. We intend to initially use all of the net proceeds from this offering to repay outstanding debt borrowed under our Credit Facilities (as defined below). However, through re-borrowing of the initial repayments under our Credit Facilities, we intend to make investments in accordance with our investment objective and strategies described in this prospectus and pay our operating expenses and other cash obligations. We also intend to use such re-borrowings for general corporate purposes. As of January 17, 2025, we had approximately $131.0 million outstanding under our senior secured revolving credit agreement dated March 6, 2017 (the “Corporate Facility”). Our Corporate Facility was scheduled to mature in March 2026 and was extended to May 2029, per an amendment executed on November 8, 2024. The amendment also extended the revolving period from September 2025 to November 2028 and reduced the interest rate, subject to our election, to (a) SOFR plus 2.05% or (b) the base rate plus 1.05%. Amounts repaid under our Corporate Facility will remain available for future borrowings. As of January 17, 2025, we had approximately $262.7 million outstanding under our special purpose vehicle revolving credit facility (as amended, the “SPV Facility” and, together with the Corporate Facility, the “Credit Facilities”). Our SPV Facility matures in February 2028, unless extended, and bears interest at a per annum rate equal to the three-month SOFR in effect, plus the applicable margin of 3.00%. Amounts repaid under our SPV Facility will remain available for future borrowings. See “Use of Proceeds” below. |
| | | | | | | | |
Main Street Indication of Interest | | Main Street has agreed to purchase an aggregate of 289,761 shares of our common stock (or approximately $4.5 million in aggregate amount based on the $15.53 public offering price per share) (the “Main Street Indicative Commitment Shares”). We will not pay underwriting discounts and commissions on the Main Street Indicative Commitment Shares sold to Main Street. The Main Street Indicative Commitment Shares will be subject to the lock-up agreement with the underwriters described elsewhere in this prospectus. Prior to this offering, Main Street beneficially owned 1,085,111 shares of our common stock (giving effect to the Reverse Stock Split effected on December 16, 2024), or 2.7% of our common stock outstanding as of January 17, 2025. Upon completion of this offering, Main Street will own approximately 3.0% of our outstanding common stock (or approximately 3.0% assuming the underwriters’ option to purchase additional shares is exercised in full). On January 20, 2025, in connection with this offering and Main Street’s potential acquisition in excess of 3% of our outstanding common stock as a result of the purchase by Main Street of the Main Street Indicative Commitment Shares and any additional acquisitions pursuant to the terms of the Main Street Rule 10b5-1 Stock Purchase Plan that Main Street intends to enter in connection with or shortly after the closing of this offering, we entered into a Fund of Funds Investment Agreement with Main Street (the “Main Street Fund of Funds Agreement”). The Main Street Fund of Funds Agreement provides for the acquisition of our shares of common stock by Main Street, and our sale of such shares to Main Street, in a manner consistent with the requirements of Rule 12d1-4 under the 1940 Act. |
Directed Share Program | | At the Company’s request, the underwriters have reserved for sale at the public offering price per share up to 7% of the shares of common stock sold in this offering to certain individuals, including our directors, officers, employees and certain other individuals identified by us, through a directed share program (the “DSP Reserved Shares”). We will not pay underwriting discounts and commissions on the DSP Reserved Shares sold to such persons. To the extent acquired by a director or executive officer of the Company, the DSP Reserved Shares will be subject to the lock-up agreement with the underwriters described elsewhere in this prospectus. Furthermore, as required by the Financial Industry Regulatory Authority, Inc. (“FINRA”), DSP Reserved Shares acquired by certain other program participants may also be subject to a lock-up restriction on their ability to transfer or otherwise sell their DSP Reserved Shares. We have agreed to indemnify the underwriters against certain liabilities and expenses, including liabilities under the Securities Act, in connection with the directed share program. |
Ticker symbol | | Our shares of common stock have been approved for listing on The New York Stock Exchange under the symbol “MSIF”. |
| | | | | | | | |
| Dividends and distributions | | We have paid, and intend to continue to pay, quarterly distributions to our stockholders out of assets legally available for distribution, as determined by our board of directors in its discretion and in accordance with the RIC requirements. Our dividends and other distributions, if any, will be determined by our board of directors from time to time. Our ability to declare dividends and other distributions depends on our earnings, our overall financial condition (including our liquidity position), maintenance of our RIC status and such other factors as our board of directors may deem relevant from time to time. When we make distributions, we are required to determine the extent to which such distributions are paid out of current or accumulated earnings, recognized capital gains or capital. To the extent there is a return of capital (a distribution of the stockholders’ invested capital), investors will be required to reduce their basis in our stock for federal tax purposes. In the future, our distributions may include a return of capital. |
| Taxation | | We have elected to be treated for U.S. federal income tax purposes as a RIC under Subchapter M of the Code. Our taxable income includes the taxable income generated by us and certain of our subsidiaries. As a RIC, we generally will not pay corporate level U.S. federal income taxes on any net ordinary taxable income or capital gains that we distribute to our stockholders. We must generally distribute at least 90% of our “investment company taxable income” (which is generally our net ordinary taxable income and realized net short term capital gains in excess of realized net long term capital losses) and 90% of our tax-exempt income to maintain our RIC status (pass through tax treatment for amounts distributed). As part of maintaining RIC status, undistributed taxable income (subject to a 4% non-deductible U.S. federal excise tax) pertaining to a given fiscal year may be distributed up to 12 months subsequent to the end of that fiscal year, provided such dividends are declared on or prior to the later of (i) the filing of the U.S. federal income tax return for the applicable fiscal year or (ii) the fifteenth day of the ninth month following the close of the year in which such taxable income was generated. |
| | | | | | | | |
| Leverage | | We use borrowed funds, referred to as “leverage,” when we believe that the terms and conditions are favorable to long-term investing and well-aligned with our investment strategy and portfolio composition in an effort to increase returns to our stockholders. However, this strategy involves significant risks. With certain limited exceptions, we are only allowed to borrow amounts such that our asset coverage, as defined in the 1940 Act, is at least 200% immediately after each such borrowing. The amount of leverage that we employ will depend on our assessment of market and other factors at the time of any proposed borrowing. 2018 legislation modified the 1940 Act to allow a BDC to increase the maximum amount of leverage it may incur from an asset coverage ratio, or BDC asset coverage ratio, of 200% to a BDC asset coverage ratio of 150%, if certain requirements are met. Upon Listing, we expect to seek the approval of our board of directors and/or stockholders to obtain access to the reduced 150% BDC asset coverage ratio for additional flexibility in our capital structure and operationally. Our investment strategy post-listing, which will be solely focused on our Private Loan investment strategy with respect to new platform investments, together with the approval of our board of directors or stockholders for the reduced asset coverage ratio requirement under the 1940 Act, as discussed above, will provide the opportunity to support a higher overall leverage profile, with our long-term profile targeting a total debt to NAV ratio of 1.15x – 1.25x compared to our historical target of 0.85x – 0.95x. |
| Risk factors | | Investing in our common stock involves risks. See “Risk Factors.” |
| Distribution Reinvestment Plan | | We have adopted a distribution reinvestment plan (the “DRIP”) for our stockholders, which is an “opt out” DRIP and which will become effective as of the date of our board of directors’ first declaration of a dividend or distribution on our common stock following a Listing. Under this plan, if we declare a cash distribution to our stockholders, the amount of such distribution will be automatically reinvested in additional shares of our common stock unless a stockholder specifically “opts out” of the DRIP. If a stockholder opts out, that stockholder will receive cash distributions. Stockholders who receive distributions in the form of shares of common stock generally will be subject to the same U.S. federal, state and local tax consequences as stockholders who elect to receive their distributions in cash, but will not receive any corresponding cash distributions with which to pay any applicable taxes.
For the avoidance of doubt, stockholders of the Company who did not elect to “opt in” to the DRIP in effect prior to the effective date of the “opt out” DRIP will be deemed to have made an election to “opt out” of our DRIP as of the effective date of the “opt out” DRIP and to continue to receive cash. See “Distribution Reinvestment Plan” for more information. |
| | | | | | | | |
| Trading at a Discount | | Shares of closed-end investment companies, including BDCs, frequently trade at a discount to their NAV. We are not generally able to issue and sell our common stock at a price below our NAV per share unless we have stockholder approval. At a special meeting of stockholders held on December 11, 2024, our stockholders authorized us, subject to approval of our board of directors, to sell or otherwise issue shares of our common stock during the next year at a price below our NAV per share, subject to certain conditions. The authorization is effective until December 11, 2025. The risk that our shares may trade at a discount to our NAV is separate and distinct from the risk that our NAV per share may decline. We cannot predict whether our shares will trade above, at or below NAV. See “Risk Factors.” |
| Available Information | | This prospectus constitutes part of a registration statement on Form N-2 that we have filed with the SEC under the Securities Act. This registration statement contains additional information about us and the shares of our common stock being offered by this prospectus. We also are required to file annual, quarterly and current periodic reports, proxy statements and other information meeting the informational requirements of the Exchange Act with the SEC. This information is available on the SEC’s website at www.sec.gov. |
FINANCIAL HIGHLIGHTS
The following table of financial highlights is intended to help a prospective investor understand our financial performance for the periods shown. The financial data set forth in the following table as of and for each of the fiscal years ended December 31, 2023, 2022, 2021, 2020, 2019, 2018, 2017, 2016, 2015 and 2014 are derived from our consolidated financial statements and give effect, on a retrospective basis, to the Reverse Stock Split effected on December 16, 2024. The financial data set forth in the following table as of and for each of the fiscal years ended December 31, 2023, 2022, 2021, 2020 and 2019 have been audited by Grant Thornton LLP, an independent registered public accounting firm whose reports thereon are included in this prospectus. The financial data set forth in the following table as of and for the nine months ended September 30, 2024 and 2023 have been derived from unaudited financial data, but in the opinion of our management, reflects all adjustments (consisting only of normal recurring adjustments and adjustments necessary to give effect, on a retrospective basis, to the Reverse Stock Split) that are necessary to present fairly the results for such interim periods.
| | | | | | | | | | | | | | | | | | | | | | | | | | | | | |
| Year Ended December 31, |
| Per Share Data (7): | 2023 | | 2022 | | 2021 | | 2020 | | 2019 |
| NAV at the beginning of the period | $ | 15.22 | | | $ | 15.36 | | | $ | 14.56 | | | $ | 15.54 | | | $ | 15.92 | |
| Net investment income (1)(6) | 1.44 | | | 1.32 | | | 1.34 | | | 1.18 | | | 1.42 | |
| Net realized loss (1)(2) | (0.85) | | | (0.10) | | | (0.07) | | | (1.32) | | | (0.47) | |
| Net unrealized appreciation (depreciation) (1)(2) | 1.16 | | | (0.04) | | | 0.62 | | | (0.08) | | | 0.08 | |
| Income tax provision (1)(2) | (0.10) | | | (0.04) | | | (0.05) | | | (0.03) | | | (0.02) | |
| Net increase (decrease) in net assets resulting from operations (1) | 1.65 | | | 1.14 | | | 1.84 | | | (0.25) | | | 1.01 | |
| Dividends paid from net investment income | (1.40) | | | (1.29) | | | (1.05) | | | (0.70) | | | (1.35) | |
| Distributions paid from capital gains | — | | | — | | | — | | | — | | | (0.05) | |
| Distributions paid or accrued (3) | (1.40) | | | (1.29) | | | (1.05) | | | (0.70) | | | (1.40) | |
| | | | | | | | | |
| Accretive effect of stock repurchases (repurchasing shares below NAV) (4) | 0.06 | | | — | | | — | | | — | | | — | |
| Other (5)(6) | 0.01 | | | 0.01 | | | 0.01 | | | (0.03) | | | 0.01 | |
| NAV at the end of the period | $ | 15.54 | | | $ | 15.22 | | | $ | 15.36 | | | $ | 14.56 | | | $ | 15.54 | |
| Shares outstanding at the end of the period | 40,054,433 | | | 40,053,000 | | | 39,913,303 | | | 39,804,152 | | | 39,231,689 | |
| | | | | | | | | | | | | | | | | | | | | | | | | | | | | |
| Year Ended December 31, |
| Per Share Data (7): | 2018 | | 2017 | | 2016 | | 2015 | | 2014 |
| NAV at the beginning of the period | $ | 16.29 | | | $ | 16.29 | | | $ | 15.76 | | | $ | 16.80 | | | $ | 17.82 | |
| Net investment income (1) | 1.48 | | | 1.46 | | | 1.40 | | | 1.50 | | | 1.32 | |
| Net realized gain (loss) (1)(2) | (0.46) | | | (0.06) | | | (0.58) | | | (0.22) | | | 0.08 | |
| Net unrealized appreciation (depreciation) (1)(2) | — | | | (0.04) | | | 1.12 | | | (1.56) | | | (1.78) | |
| Income tax provision (1)(2) | — | | | — | | | — | | | — | | | — | |
| Net increase (decrease) in net assets resulting from operations (1) | 1.02 | | | 1.36 | | | 1.94 | | | (0.28) | | | (0.38) | |
| Dividends paid from net investment income | (1.40) | | | (1.40) | | | (1.40) | | | (1.40) | | | (1.40) | |
| Distributions paid from capital gains | — | | | — | | | — | | | — | | | — | |
| Distributions paid or accrued (3) | (1.40) | | | (1.40) | | | (1.40) | | | (1.40) | | | (1.40) | |
| | | | | | | | | |
| Accretive effect of stock repurchases (repurchasing shares below NAV) (4) | — | | | — | | | — | | | — | | | — | |
| Other (5) | 0.01 | | | 0.04 | | | (0.01) | | | 0.64 | | | 0.76 | |
| NAV at the end of the period | $ | 15.92 | | | $ | 16.29 | | | $ | 16.29 | | | $ | 15.76 | | | $ | 16.80 | |
| Shares outstanding at the end of the period | 39,292,412 | | | 39,755,866 | | | 36,691,486 | | | 31,191,022 | | | 15,483,560 | |
_____________________________
(1)Based on weighted-average number of common shares outstanding for the period.
(2)Net realized gains or losses, net unrealized appreciation or depreciation and income tax provision or benefit can fluctuate significantly from period to period.
(3)Represents stockholder distributions paid or accrued for the period.
(4)Shares repurchased in connection with the modified Dutch auction tender offers. See Note H — Share Repurchases in the consolidated financial statements for the year ended December 31, 2023 in this prospectus for additional information.
(5)Includes the impact of the different share amounts as a result of calculating certain per share data based on the weighted-average basic shares outstanding during the period and certain per share data based on the shares outstanding as of a period end or transaction date.
(6)Reclassifications have been made to certain prior year per share data. The 2020 “Other” and 2019 “Net investment income” per share amounts have been adjusted to reflect the income tax provision effect separately rather than as a component of these values.
(7)Per share data and shares outstanding have been adjusted for the periods shown to reflect the Reverse Stock Split effected on December 16, 2024 on a retrospective basis.
| | | | | | | | | | | | | | | | | | | | | | | | | | | | | |
| Year Ended December 31, |
| 2023 | | 2022 | | 2021 | | 2020 | | 2019 |
| (dollars in thousands) |
| NAV at end of period | $ | 622,307 | | $ | 609,665 | | $ | 613,170 | | $ | 579,624 | | $ | 609,305 |
| Average NAV | $ | 613,525 | | $ | 611,214 | | $ | 593,440 | | $ | 557,382 | | $ | 622,708 |
| Average outstanding debt | $ | 487,271 | | $ | 494,957 | | $ | 321,973 | | $ | 386,084 | | $ | 474,000 |
| | | | | | | | | |
| Ratio of total expenses, including income tax expense, to average NAV(1)(2)(4) | 12.63 | % | | 8.60 | % | | 6.51 | % | | 7.38 | % | | 9.11 | % |
| Ratio of operating expenses to average NAV(2)(4) | 12.02 | % | | 8.33 | % | | 6.20 | % | | 7.16 | % | | 9.11 | % |
| Ratio of operating expenses, excluding interest expense, to average NAV(2)(4) | 6.07 | % | | 4.33 | % | | 3.76 | % | | 4.07 | % | | 4.86 | % |
| Ratio of operating expenses, excluding interest expense and incentive fees, to average NAV(2)(4) | 4.02 | % | | 3.98 | % | | 3.66 | % | | 4.07 | % | | 4.22 | % |
| Ratio of net investment income to average NAV(4) | 9.40 | % | | 8.65 | % | | 8.99 | % | | 8.40 | % | | 8.84 | % |
| Portfolio turnover ratio | 21.82 | % | | 18.92 | % | | 35.39 | % | | 8.93 | % | | 33.30 | % |
| Total return based on change in NAV(3)(4) | 10.86 | % | | 7.43 | % | | 12.71 | % | | (1.80) | % | | 6.41 | % |
| | | | | | | | | | | | | | | | | | | | | | | | | | | | | |
| Year Ended December 31, |
| 2018 | | 2017 | | 2016 | | 2015 | | 2014 |
| (dollars in thousands) |
| NAV at end of period | $ | 625,366 | | $ | 647,789 | | $ | 597,833 | | $ | 491,652 | | $ | 260,063 |
| Average NAV | $ | 642,625 | | $ | 629,775 | | $ | 535,175 | | $ | 400,045 | | $ | 142,603 |
| Average outstanding debt | $ | 482,200 | | $ | 427,200 | | $ | 396,000 | | $ | 304,973 | | $ | 89,846 |
| | | | | | | | | |
| Ratio of total expenses, including income tax expense, to average NAV(1)(2)(4) | 9.11 | % | | 7.88 | % | | 7.56 | % | | 8.27 | % | | 8.33 | % |
| Ratio of operating expenses to average NAV(2)(4) | 8.95 | % | | 7.78 | % | | 7.50 | % | | 8.24 | % | | 8.33 | % |
| Ratio of operating expenses, excluding interest expense, to average NAV(2)(4) | 5.09 | % | | 4.87 | % | | 4.69 | % | | 5.45 | % | | 6.00 | % |
| Ratio of operating expenses, excluding interest expense and incentive fees, to average NAV(2)(4) | 4.57 | % | | 4.61 | % | | 4.68 | % | | 4.91 | % | | 5.68 | % |
| Ratio of net investment income to average NAV(4) | 9.16 | % | | 9.01 | % | | 8.91 | % | | 9.01 | % | | 7.47 | % |
| Portfolio turnover ratio | 45.06 | % | | 50.66 | % | | 39.01 | % | | 24.23 | % | | 38.39 | % |
| Total return based on change in NAV(3)(4) | 6.26 | % | | 8.59 | % | | 12.31 | % | | 2.14 | % | | 2.13 | % |
_____________________________
(1)Total expenses are the sum of operating expenses and net income tax provision or benefit. Net income tax provision or benefit includes the accrual of net deferred tax provision or benefit relating to the net unrealized appreciation or depreciation on portfolio investments held in the Taxable Subsidiaries and due to the change in the loss carryforwards, which are non-cash in nature and may vary significantly from period to period. MSC Income Fund is required to include net deferred tax provision or benefit in calculating its total expenses even though these net deferred taxes are not currently payable or receivable.
(2)Unless otherwise noted, operating expenses include interest, management fees, incentive fees and general and administrative expenses.
(3)Total return is calculated based on the change in NAV per share and stockholder distributions declared per share during the reporting period, divided by the NAV per share at the beginning of the period. The total return does not reflect the sales load from the sale of MSC Income Fund’s common stock.
(4)Net of expense waivers of $8.3 million, $4.5 million, $4.3 million, $3.6 million, $3.1 million, $6.0 million, $4.6 million, $4.0 million, $4.6 million and $4.1 million in 2023, 2022, 2021, 2020, 2019, 2018, 2017, 2016, 2015 and 2014 respectively. Excluding these expense waivers, the expense and income ratios are as follows:
| | | | | | | | | | | | | | | | | | | | | | | | | | | | | |
| Year Ended December 31, |
| 2023 | | 2022 | | 2021 | | 2020 | | 2019 |
| Ratio of total expenses, including income tax expense, to average NAV(1)(2) | 13.98 | % | | 9.33 | % | | 7.24 | % | | 8.11 | % | | 9.84 | % |
| Ratio of operating expenses to average NAV(2) | 13.37 | % | | 9.06 | % | | 6.92 | % | | 7.89 | % | | 9.84 | % |
| Ratio of operating expenses, excluding interest expense, to average NAV(2) | 7.43 | % | | 5.07 | % | | 4.49 | % | | 4.80 | % | | 5.58 | % |
| Ratio of operating expenses, excluding interest expense and incentive fees, to average NAV(2) | 5.38 | % | | 4.72 | % | | 4.39 | % | | 4.80 | % | | 4.95 | % |
| Ratio of net investment income to average NAV | 8.05 | % | | 7.90 | % | | 8.26 | % | | 7.67 | % | | 8.11 | % |
| | | | | | | | | |
| | | | | | | | | | | | | | | | | | | | | | | | | | | | | |
| Year Ended December 31, |
| 2018 | | 2017 | | 2016 | | 2015 | | 2014 |
| Ratio of total expenses, including income tax expense, to average NAV(1)(2) | 9.13 | % | | 7.89 | % | | 7.57 | % | | 8.29 | % | | 8.38 | % |
| Ratio of operating expenses to average NAV(2) | 8.97 | % | | 7.79 | % | | 7.51 | % | | 8.26 | % | | 8.39 | % |
| Ratio of operating expenses, excluding interest expense, to average NAV(2) | 5.10 | % | | 4.88 | % | | 4.69 | % | | 5.46 | % | | 6.04 | % |
| Ratio of operating expenses, excluding interest expense and incentive fees, to average NAV(2) | 4.58 | % | | 4.61 | % | | 4.69 | % | | 4.93 | % | | 5.72 | % |
| Ratio of net investment income to average NAV | 8.25 | % | | 8.28 | % | | 8.48 | % | | 7.98 | % | | 4.79 | % |
| | | | | | | | | |
_____________________________
See footnotes (1), (2), (3) and (4) immediately prior to this table.
Interim results at and for the nine months ended September 30, 2024 are not necessarily indicative of the results that may be expected for the year ending December 31, 2024. You should read these financial highlights in conjunction with our consolidated financial statements and notes thereto and “Management’s Discussion and Analysis of Financial Condition and Results of Operations” included in this prospectus.
| | | | | | | | | | | |
| Nine Months Ended September 30, |
| Per Share Data (7): | 2024 | | 2023 |
| NAV as of the beginning of the period | $ | 15.54 | | | $ | 15.22 | |
| Net investment income (1) | 1.07 | | | 1.06 | |
| Net realized gain (loss) (1)(2) | 0.59 | | | (0.62) | |
| Net unrealized appreciation (depreciation) (1)(2) | (0.61) | | | 0.76 | |
| Income tax provision (1)(2) | (0.15) | | | (0.08) | |
| Net increase in net assets resulting from operations (1) | 0.90 | | | 1.12 | |
| Dividends paid from net investment income (6) | (0.76) | | | (1.05) | |
| Distributions paid from capital gains (6) | (0.33) | | | — | |
| Distributions paid or accrued (3)(6) | (1.09) | | | (1.05) | |
| | | |
| Accretive effect of stock repurchases (repurchasing shares below NAV per share) (4) | 0.02 | | | 0.04 | |
| Other (5) | 0.01 | | | 0.01 | |
| NAV as of the end of the period | $ | 15.38 | | | $ | 15.34 | |
| Shares outstanding as of the end of the period | 40,217,446 | | | 40,006,974 | |
_____________________________
(1)Based on weighted-average number of common shares outstanding for the period.
(2)Net realized gains or losses, net unrealized appreciation or depreciation, and income tax provision or benefit can fluctuate significantly from period to period.
(3)Represents stockholder distributions paid or accrued for the period.
(4)Shares repurchased in connection with Dutch auction tender offers. See Note G — Share Repurchases in the consolidated financial statements for the nine months ended September 30, 2024 in this prospectus for additional information.
(5)Includes the impact of the different share amounts as a result of calculating certain per share data based on the weighted-average basic shares outstanding during the period and certain per share data based on the shares outstanding as of a period end or transaction date.
(6)MSIF’s taxable income for each period is an estimate and will not be finally determined until MSIF files its tax return for each year. As a result, the character of MSIF’s dividends and distributions for each period is also an estimate. Therefore, the final character of MSIF’s dividends and distributions may be different than this estimate.
(7)Per share data and shares outstanding have been adjusted for the periods shown to reflect the Reverse Stock Split effected on December 16, 2024 on a retrospective basis.
| | | | | | | | | | | |
| Nine Months Ended September 30, |
| 2024 | | 2023 |
| (dollars in thousands) |
| NAV as of the end of the period | $ | 618,485 | | | $ | 613,569 | |
| Average NAV | $ | 620,622 | | | $ | 611,329 | |
| Average outstanding debt | $ | 512,088 | | | $ | 482,021 | |
| | | |
| Ratios to average NAV: | | | |
| Ratio of total expenses, including income tax provision, to average NAV(1)(2)(3)(5) | 10.38 | % | | 9.35 | % |
| Ratio of operating expenses to average NAV(2)(3)(5) | 9.39 | % | | 8.83 | % |
| Ratio of operating expenses, excluding interest expense, to average NAV(2)(3)(5) | 4.64 | % | | 4.48 | % |
| Ratio of operating expenses, excluding interest expense and incentive fees, to average NAV(2)(3)(5) | 3.13 | % | | 3.03 | % |
| Ratio of net investment income to average NAV(2)(5) | 6.94 | % | | 6.97 | % |
| Portfolio turnover ratio(2) | 18.54 | % | | 12.32 | % |
| Total return based on change in NAV(2)(4) | 6.41 | % | | 7.36 | % |
_____________________________
(1)Total expenses are the sum of operating expenses and net income tax provision. Net income tax provision includes the accrual of net deferred tax provision relating to the net unrealized appreciation or depreciation on portfolio investments held in Taxable Subsidiaries and due to the change in the loss carryforwards, which are non-cash in nature and may vary significantly from period to period. MSC Income Fund is required to include net deferred tax provision in calculating its total expenses even though these net deferred taxes are not currently payable or receivable.
(2)Not annualized.
(3)Unless otherwise noted, operating expenses include interest, management fees, incentive fees and general and administrative expenses.
(4)Total return is calculated based on the change in NAV per share and stockholder distributions declared per share during the reporting period, divided by the NAV per share at the beginning of the period. The total return does not reflect the sales load from the sale of MSC Income Fund’s common stock.
(5)Net of expense waivers of $6.7 million and $6.3 million for the nine months ended September 30, 2024 and 2023, respectively. Excluding these expense waivers, the expense and income ratios are as follows:
| | | | | | | | | | | |
| Nine Months Ended September 30, |
| 2024 | | 2023 |
| | | |
| Ratio of total expenses, including income tax provision, to average NAV(1)(2)(3) | 11.49 | % | | 10.39 | % |
| Ratio of operating expenses to average NAV(2)(3) | 10.49 | % | | 9.87 | % |
| Ratio of operating expenses, excluding interest expense, to average NAV(2)(3) | 5.73 | % | | 5.52 | % |
| Ratio of operating expenses, excluding interest expense and incentive fees, to average NAV(2)(3) | 4.22 | % | | 4.06 | % |
| Ratio of net investment income to average NAV(2) | 5.88 | % | | 5.95 | % |
_____________________________See footnotes (1), (2) and (3) immediately prior to this table.
FEES AND EXPENSES
The following table is intended to assist you in understanding the costs and expenses that an investor in this offering will bear directly or indirectly. We caution you that some of the percentages indicated in the table below are estimates and may vary. The expenses shown in the table under “annual expenses” are based on estimated amounts for our current fiscal year and assume that we issue 5,500,000 shares of our common stock in the offering, based on the offering price of $15.53 per share, the sale of 289,761 shares of our common stock to Main Street, that no shares are sold pursuant to the directed share program described herein and that the underwriters do not exercise their option to purchase additional shares. The following table should not be considered a representation of our future expenses. Actual expenses may be greater or less than shown. Except where the context suggests otherwise, whenever this prospectus contains a reference to fees or expenses paid by “you,” “us” or “MSC Income Fund,” or that “we” will pay fees or expenses, stockholders will indirectly bear such fees or expenses as investors in us.
| | | | | | | | | | | |
Stockholder Transaction Expenses (as a percentage of offering price): | | | |
Sales load (as a percentage of offering price) | | 6.00 | | %(1) |
Offering expenses (as a percentage of offering price) | | 2.34 | | %(2) |
Distribution reinvestment plan expenses | | — | %(3) |
Total stockholder transaction expenses (as a percentage of offering price) | | 8.34 | | % |
Estimated Annual Expenses of the Company (as a percentage of net assets attributable to common stock as of September 30, 2024): | | | |
| Base management fees | | 2.87 | | %(4)(5) |
| Incentive fees - subordinated incentive fee on income | | 2.03 | | %(5) |
| Incentive fees - capital gains incentive fee | | — | | %(5) |
Interest payments on borrowed funds | | 5.85 | | %(6) |
Other expenses | | 0.84 | | %(7) |
Income tax expense | | 0.61 | | %(8) |
Acquired fund fees and expenses | | 0.16 | | %(9) |
Total annual expenses | | 12.36 | | %(10) |
_____________________________(1)The underwriting discount and commission with respect to shares of common stock sold in this offering (other than with respect to the 289,761 shares to be sold to Main Street or any DSP Reserved Shares sold under the directed share program for this offering), which is a one-time fee paid to the underwriters, is the only sales load paid in connection with this offering. The 6.00% sales load figure in the table above has not been adjusted to take into account the fact that no sales load will be paid on the 289,761 shares to be sold to Main Street in this offering.
(2)Amount reflects estimated offering expenses of approximately $2.0 million.
(3)The expenses of administering our DRIP are included in “other expenses” in the table above.
(4)The base management fee is calculated at an annual rate of 1.5% of the average value of our total assets.
(5)Refer to “Management Agreements” below for a description of the structure and calculation of the management fees and incentive fees under the New Investment Advisory Agreement.
(6)Interest payments on borrowed funds represent our estimated annual interest payments on borrowed funds based on current debt levels as adjusted for projected increases (but not decreases) in debt levels over the next twelve months.
(7)Other expenses in this table represent the estimated expenses of MSC Income Fund for the current fiscal year.
(8)Income tax expense relates to the accrual of (a) deferred tax provision (benefit) primarily related to loss carryforwards, timing differences in net unrealized appreciation or depreciation and other temporary book-tax differences from our portfolio investments held in our taxable subsidiaries and (b) excise, state and other taxes. Deferred taxes are non-cash in nature and may vary significantly from period to period. We are required to include deferred taxes in calculating our annual expenses even though deferred taxes are not currently payable or receivable. Due to the variable nature of deferred tax expense, which can be a large portion of the income tax expense, and the difficulty in providing an estimate for future periods, this income tax expense estimate is based upon the actual amount of income tax expense for the year ended December 31, 2023.
(9)Acquired fund fees and expenses represent the estimated indirect expense incurred due to investments in other investment companies and private funds.
(10)The holders of shares of our common stock indirectly bear the cost associated with our annual expenses.
Example
The following example demonstrates the projected dollar amount of total cumulative expenses that would be incurred over various periods with respect to a hypothetical investment in our common stock. In calculating the following expense amounts, we have assumed we would have no additional leverage and that our annual operating expenses would remain at the levels set forth in the table above except for the incentive fee, which has been modified for the assumed 5% annual return instead of the actual historical returns, and that stockholders pay stockholder transaction expenses of 8.66% with respect to common stock sold by us in this offering.
| | | | | | | | | | | | | | | |
| 1 Year | 3 Years | 5 Years | | 10 Years |
| You would pay the following expenses on a $1,000 investment, assuming a 5.0% annual return (none of which is subject to the incentive fee on capital gains) | $178 | $348 | $499 | | $813 |
| You would pay the following expenses on a $1,000 investment, assuming a 5.0% annual return resulting entirely from realized capital gains (all of which is subject to the incentive fee on capital gains) | $183 | $364 | $523 | | $842 |
This example and the expenses in the table above should not be considered a representation of our future expenses, and actual expenses may be greater or less than those shown. While the example assumes, as required by the SEC, a 5.0% annual return, our performance will vary and may result in a return greater or less than 5.0%. The subordinated incentive fee on income under the New Investment Advisory Agreement, which, assuming a 5% annual return, would either not be payable or would have an insignificant impact on the expense amounts shown above, is not included in the example. The example assumes inclusion of offering expenses of approximately $2.0 million and reinvestment of all distributions at net asset value. In addition, while the example assumes reinvestment of all dividends at net asset value, participants in our DRIP will receive a number of shares of our common stock, determined by dividing the total dollar amount of the dividend payable to a participant by (i) the closing sales price per share of our common stock reported on the New York Stock Exchange on the trading day immediately preceding the applicable distribution payment date (or, if no sale is reported for such date, at the average of their reported bid and asked prices) in the event that we use newly issued shares to satisfy the share requirements of the DRIP or (ii) the weighted average purchase price paid per share of all shares of common stock purchased by the plan administrator in connection with such purchases in the event that shares are purchased in the open market to satisfy the share requirements of the DRIP. See “Distribution Reinvestment Plan” for more information.
RISK FACTORS
Investing in our securities, including shares of our common stock, involves a high degree of risk. Before deciding whether to invest in our securities, you should carefully consider the risks and uncertainties described below, together with other information in this prospectus. The risks described in this prospectus are not the only ones we face. Additional risks and uncertainties that we are unaware of, or that we currently believe are not material, may also become important factors that adversely affect our business or impair our operations and performance. Past financial performance may not be a reliable indicator of future performance, and historical trends should not be used to anticipate results or trends in future periods. If any of these risks actually occurs, our business, reputation, financial condition, results of operations, revenue, and future prospects could be materially and adversely affected. This could cause our net asset value and the trading price of our securities to decline, resulting in a loss of all or part of your investment. Please also read carefully the section titled “Cautionary Statement Concerning Forward-Looking Statements.”
RISKS RELATED TO OUR BUSINESS AND STRUCTURE
Because our investments are recorded at fair value, there is and will continue to be uncertainty as to the value of our portfolio investments.
Under the 1940 Act, we are required to carry our portfolio investments at market value or, if there is no readily available market value, at fair value as determined by us pursuant to procedures established and overseen by our board of directors. Typically, there is not a public market for the securities of the privately held companies in which we invest. As a result, we value these securities quarterly at fair value based on inputs from management and a nationally recognized independent financial advisory services firm (on a rotational basis) pursuant to valuation procedures approved by our board of directors (the “Valuation Procedures”).
The determination of fair value and consequently, the amount of unrealized gains and losses in our portfolio, are to a certain degree, subjective and dependent on a valuation process approved by our board of directors. Certain factors that may be considered in determining the fair value of our investments include external events, such as private mergers, sales and acquisitions involving comparable companies. Because such valuations, and particularly valuations of securities in privately held companies, are inherently uncertain, may fluctuate over short periods of time and may be based on estimates, our determinations of fair value may differ materially from the values that would have been used if a ready market for these securities existed. Due to this uncertainty, our fair value determinations may cause our NAV on a given date to materially understate or overstate the value that we may ultimately realize on one or more of our investments. As a result, investors purchasing our securities based on an overstated NAV would pay a higher price than the value of our investments might warrant. Conversely, investors selling our securities during a period in which the NAV understates the value of our investments may receive a lower price for their securities than the value of our investments might warrant.
Our financial condition and results of operations depends on our Adviser’s ability to effectively manage and deploy capital.
Our ability to achieve our investment objective depends on our Adviser’s ability to effectively manage and deploy capital, which depends, in turn, on our Adviser’s investment team’s ability to identify, evaluate and monitor, and our ability to finance and invest in, companies that meet our investment criteria.
Accomplishing our investment objective on a cost-effective basis is largely a function of our investment team’s handling of the investment process, its ability to provide competent, attentive and efficient services and our access to investments offering acceptable terms. In addition to monitoring the performance of our existing investments, members of our investment team are also called upon, from time to time, to provide managerial assistance to some of our portfolio companies. These demands on their time may distract them or slow the rate of investment.
Even if we are able to grow and build upon our investment operations, any failure to manage our growth effectively could have a material adverse effect on our business, financial condition, results of operations and prospects. The results of our operations will depend on many factors, including the availability of opportunities for investment, readily accessible short and long-term funding alternatives in the financial markets and economic conditions. Furthermore, if our Adviser cannot successfully operate our business or implement our investment policies and strategies as described herein, it could negatively impact our ability to pay dividends.
We are subject to risks associated with the interest rate environment and changes in interest rates will affect our cost of capital, net investment income and the value of our investments.
To the extent we borrow money or issue debt securities or preferred stock to make investments, our net investment income will depend, in part, upon the difference between the rate at which we borrow funds or pay interest or dividends on such debt securities or preferred stock and the rate at which we invest these funds. In addition, many of our debt investments and borrowings have floating interest rates that reset on a periodic basis, and many of our investments are subject to interest rate floors. As a result, a change in market interest rates could have a material adverse effect on our net investment income. In periods of rising interest rates, our cost of funds will increase because the interest rates on the amounts borrowed under our credit facilities are floating, and any new fixed rate debt may be issued at higher coupon rates, which could reduce our net investment income to the extent any debt investments have either fixed interest rates, or in periods when debt investments with floating interest rates are subject to an interest rate floor above then current levels. In periods of declining interest rates, our interest income and our net investment income could be reduced as the interest income earned on our floating rate debt investments declines and any new fixed rate debt may be issued at lower coupon rates.
We can use interest rate risk management techniques in an effort to limit our exposure to interest rate fluctuations. Such techniques could include various interest rate hedging activities to the extent permitted by the 1940 Act and applicable commodities laws. These activities could limit our ability to participate in the benefits of lower interest rates with respect to the hedged borrowings. Adverse developments resulting from changes in interest rates or hedging transactions could have a material adverse effect on our business, financial condition and results of operations.
An increase in the market pricing of the spreads charged over index rates on floating rate investments could lead to a decline in the fair value of the debt securities we own, which would adversely affect our NAV. Also, an increase in interest rates available to investors could make an investment in our common stock less attractive if we are not able to increase our dividends, which could reduce the value of our common stock.
We face increasing competition for investment opportunities.
We compete for investments with other investment funds (including private equity funds, debt funds, mezzanine funds, collateralized loan obligation funds and BDCs), as well as traditional financial services companies such as commercial banks and other sources of funding. Many of our competitors are substantially larger and have considerably greater financial, technical and marketing resources than we do. For example, some competitors may have a lower cost of capital and access to funding sources that are not available to us. In addition, some of our competitors may have higher risk tolerances or different risk assessments than we have. These characteristics could allow our competitors to consider a wider variety of investments, establish more relationships and offer better pricing and more flexible structuring than we are able to do. We may lose investment opportunities if we do not match our competitors’ pricing, terms and structure. If we are forced to match our competitors’ pricing, terms and structure, we may not be able to achieve acceptable returns on our investments or may bear substantial risk of capital loss. A significant increase in the number and/or the size of our competitors in our target market could force us to accept less attractive investment terms. Furthermore, many of our competitors are not subject to the regulatory restrictions that the 1940 Act imposes on us as a BDC.
We are dependent upon our Adviser’s key investment personnel for our future success.
We depend on the members of our Adviser’s investment team, particularly Dwayne L. Hyzak, David L. Magdol, Jesse E. Morris, Jaime Arreola, K. Colton Braud, III, Damian T. Burke, Samuel A. Cashiola, Diego Fernandez and Nicholas T. Meserve for the identification, review, final selection, structuring, closing and monitoring of our investments. These individuals have significant investment expertise and relationships that we rely on to implement our business plan. Although these executive officers and other key personnel have entered into non-compete arrangements with our Adviser or an affiliate of our Adviser, we cannot guarantee that any of these individuals will remain available to us. If we lose the services of the individuals mentioned above, we may not be able to operate our business as we expect, and our ability to compete could be harmed, which could cause our operating results to suffer.
The Adviser is dependent upon key investment personnel and resources provided to it by Main Street under a sharing agreement.
Main Street and the Adviser have entered into a sharing agreement pursuant to which Main Street provides the Adviser with investment professionals and access to its resources. Because the Adviser does not have any employees, it depends solely on the investment professionals provided to it by Main Street pursuant to the sharing agreement for its infrastructure, business relationships and management expertise in connection with its provision of investment advisory services to us. The Adviser depends on the investment professionals provided to it by Main Street under the sharing agreement, particularly Dwayne L. Hyzak, David L. Magdol, Jesse E. Morris, Jaime Arreola, K. Colton Braud, III, Damian T. Burke, Samuel A. Cashiola, Diego Fernandez and Nicholas T. Meserve, for the identification, review, final selection, structuring, closing and monitoring of our investments. These individuals have significant investment expertise and relationships that the Adviser relies on to implement its and our business plan. We cannot guarantee that any of these individuals will remain available to the Adviser. If the Adviser loses the services of the individuals mentioned above, it and we may not be able to operate our respective businesses as we expect, and our ability to compete could be harmed, which could cause our operating results to suffer.
Our success depends on our Adviser’s ability to attract and retain qualified personnel in a competitive environment.
Our growth will require that our Adviser is able to retain new investment and administrative personnel in a competitive market. Our Adviser’s ability to attract and retain personnel with the requisite credentials, experience and skills depends on several factors including, but not limited to, our ability to offer competitive wages, benefits and professional growth opportunities. Many of the entities, including investment funds (such as private equity funds, debt funds and mezzanine funds) and traditional financial services companies, with which our Adviser competes for experienced personnel have greater resources than our Adviser has. The inability of our Adviser to attract and retain experienced personnel would have a material adverse effect on our business.
We may not replicate the historical results achieved by Main Street or by other entities managed by our Adviser.
Although our investments partly overlap with investments made by Main Street, the parent company of our Adviser, we cannot assure stockholders that we will be able to replicate the historical results achieved by Main Street or other investment funds or clients managed by our Adviser. Because of the differences in our investment strategy, business structure and portfolio composition, our investment returns could be substantially lower than the returns achieved by Main Street or other investment funds or clients managed by our Adviser in prior periods. Additionally, all or a portion of the prior results may have been achieved in particular market conditions that may never be repeated. Moreover, current or future market volatility and regulatory uncertainty may have an adverse impact on our future performance.
Our business model depends to a significant extent upon strong referral relationships.
We expect that members of our Adviser’s management team will maintain their relationships with intermediaries, financial institutions, investment bankers, commercial bankers, financial advisors, attorneys, accountants, consultants and other individuals within our network, and we will rely to a significant extent upon these relationships to provide us with potential investment opportunities. If our Adviser’s management team fails to maintain its existing relationships or develop new relationships with sources of investment opportunities, we will not be able to grow our Investment Portfolio. In addition, individuals with whom members of our Adviser’s management team have relationships are not obligated to provide us with investment opportunities, and, therefore, there is no assurance that such relationships will generate investment opportunities for us.
Our board of directors may change our investment objective, operating policies and strategies without prior notice or stockholder approval, the effects of which may be adverse.
Our board of directors has the authority, except as otherwise provided in the 1940 Act, to modify or waive our investment objective, current operating policies, investment criteria and strategies without prior notice and without stockholder approval. However, absent stockholder approval, we may not change the nature of our business so as to cease to be regulated as, or withdraw our election as, a BDC. We cannot predict the effect any changes to our investment objective, current operating policies, investment criteria and strategies would have on our business, NAV, operating results and value of our stock. However, the effects might be material and adverse, which could negatively affect our business and impair our ability to pay interest and principal payments to holders of our debt instruments and to make distributions to our stockholders and cause our investors to lose all or part of their investment in us.
We are a non-diversified investment company within the meaning of the 1940 Act, and therefore we are not limited with respect to the proportion of our assets that may be invested in securities of a single issuer.
We are classified as a non-diversified investment company within the meaning of the 1940 Act, which means that we are not limited by the 1940 Act with respect to the proportion of our assets that we may invest in securities of a single issuer. Under the 1940 Act, a “diversified” investment company is required to invest at least 75% of the value of its total assets in cash and cash items, government securities, securities of other investment companies and other securities limited in respect of any one issuer to an amount not greater than 5% of the value of the total assets of such company and no more than 10% of the outstanding voting securities of such issuer. As a non-diversified investment company, we are not subject to this requirement. To the extent that we assume large positions in the securities of a small number of issuers, our NAV may fluctuate to a greater extent than that of a diversified investment company as a result of changes in the financial condition or the market’s assessment of the issuer. We may also be more susceptible to any single economic or regulatory occurrence than a diversified investment company. Beyond our RIC asset diversification requirements and any requirements under our financing arrangements, we do not have fixed guidelines for diversification, and our investments could be concentrated in relatively few portfolio companies. Although we have historically operated as a non-diversified investment company within the meaning of the 1940 Act, our investment portfolio may, from time to time, be compromised of assets that could permit us to qualify as a “diversified” investment company under the 1940 Act. To the extent that we operate as a non-diversified investment company, we may be subject to greater risk.
We and our portfolio companies may maintain cash balances at financial institutions that exceed federally insured limits and may otherwise be materially affected by adverse developments affecting the financial services industry, such as actual events or concerns involving liquidity, defaults or non-performance by financial institutions or transactional counterparties.
Cash held by us and by our portfolio companies in non-interest-bearing and interest-bearing operating accounts may exceed the Federal Deposit Insurance Corporation (“FDIC”) insurance limits. If such banking institutions were to fail, we or our portfolio companies could lose all or a portion of those amounts held in excess of such insurance limitations. In addition, actual events involving limited liquidity, defaults, non-performance or other adverse developments that affect financial institutions, transactional counterparties or other companies in the financial services industry or the financial services industry generally, or concerns or rumors about any events of these kinds or other similar risks, have in the past and may in the future lead to market-wide liquidity problems, which could adversely affect our and our portfolio companies’ business, financial condition, results of operations and prospects.
Although we assess our portfolio companies’ banking relationships as we believe necessary or appropriate, our and our portfolio companies’ access to funding sources and other credit arrangements in amounts adequate to finance or capitalize our respective current and projected future business operations could be significantly impaired by factors that affect us or our portfolio companies, the financial institutions with which we or our portfolio companies have arrangements directly or the financial services industry or economy in general. These factors could include, among others, events such as liquidity constraints or failures, the ability to perform obligations under various types of financial, credit or liquidity agreements or arrangements, disruptions or instability in the financial services industry or financial markets or concerns or negative expectations about the prospects for companies in the financial services industry. These factors could involve financial institutions or financial services industry companies with which we or our portfolio companies have financial or business relationships, but could also include factors involving financial markets or the financial services industry generally.
In addition, investor concerns regarding the U.S. or international financial systems could result in less favorable commercial financing terms, including higher interest rates or costs and tighter financial and operating covenants or systemic limitations on access to credit and liquidity sources, thereby making it more difficult for us or our portfolio companies to acquire financing on acceptable terms or at all.
We are subject to risks related to corporate social responsibility.
Our business faces increasing public scrutiny related to environmental, social and governance (“ESG”) activities. We risk damage to our brand and reputation if we or our Adviser fail to act responsibly in a number of areas, such as diversity and inclusion, environmental stewardship, support for local communities, corporate governance and transparency and considering ESG factors in our investment processes. Adverse incidents with respect to ESG activities could impact the value of our brand, the cost of our operations and relationships with investors, all of which could adversely affect our business and results of operations. Additionally, new regulatory initiatives related to ESG could adversely affect our business.
Our bylaws include an exclusive forum selection provision, which could limit our stockholders’ ability to obtain a favorable judicial forum for disputes with us or our directors, officers, or other agents.
Our bylaws provides that, unless we consent in writing to the selection of a different forum, the Circuit Court for Baltimore City, Maryland, or, if that court does not have jurisdiction, the United States District Court for the District of Maryland, Baltimore Division, shall be, except for any claims made under the federal U.S. securities laws, the sole and exclusive forum for (a) any derivative action or proceeding brought on behalf of the Company, (b) any action asserting a claim of breach of any duty owed by a director or officer or other employee of the Company to the Company or to the stockholders of the Company, (c) any action asserting a claim against the Company or any director or officer or other employee of the Company arising pursuant to any provision of the Maryland General Corporation Law, our Articles of Incorporation or our bylaws, or (d) any action asserting a claim against the Company or any director or officer or other employee of the Company that is governed by the internal affairs doctrine. Such provision does not apply to any claims, suits, actions or proceedings arising under the federal securities laws. This provision may increase costs for shareholders in bringing a claim against us or our directors, officers or other agents. Any person or entity purchasing or otherwise acquiring any interest in shares of our capital stock will be deemed, to the fullest extent permitted by law, to have notice of and consented to these exclusive forum provisions. The exclusive forum selection provision in our bylaws may limit our stockholders’ ability to obtain a favorable judicial forum for disputes with us or our directors, officers or other agents, which may discourage lawsuits against us and such persons. It is also possible that, notwithstanding such exclusive forum selection provision, a court could rule that such provision is inapplicable or unenforceable. If this occurred, we may incur additional costs associated with resolving such action in another forum, which could materially adversely affect our business, financial condition and results of operations.
RISKS RELATED TO OUR INVESTMENTS
The types of portfolio companies in which we invest involve significant risks and we could lose all or part of our investment.
Investing in the types of companies that comprise our portfolio companies exposes us to a number of significant risks. Among other things, these companies:
•may have limited financial resources and may be unable to meet their obligations under their debt instruments that we hold, which may be accompanied by a deterioration in the value of any collateral and a reduction in the likelihood of us realizing any guarantees from subsidiaries or affiliates of our portfolio companies that we may have obtained in connection with our investment, as well as a corresponding decrease in the value of our investments;
•may have shorter operating histories, narrower product lines, smaller market shares and/or significant customer concentrations than larger businesses, which tend to render them more vulnerable to competitors’ actions and market conditions, as well as general economic downturns;
•are more likely to depend on the management talents and efforts of a small group of persons; therefore, the death, disability, resignation, termination or significant under-performance of one or more of these persons could have a material adverse impact on our portfolio company and, in turn, on us;
•generally have less predictable operating results, may from time to time be parties to litigation, may be engaged in rapidly changing businesses with products subject to a substantial risk of obsolescence, and may require substantial additional capital to support their operations, finance expansion or maintain their competitive position; and
•generally have less publicly available information about their businesses, operations and financial condition. We are required to rely on the ability of our Adviser to obtain adequate information to evaluate the potential returns from investing in these companies. If we are unable to uncover all material information about these companies, we may not make a fully informed investment decision, and may lose all or part of our investment.
In addition, certain of our officers and directors or officers and directors of our Adviser may serve as directors on the boards of our portfolio companies. To the extent that litigation arises out of our investments in these companies, our officers and directors or officers and directors of our Adviser may be named as defendants in such litigation, which could result in an expenditure of funds (through our indemnification of such officers and directors) and the diversion of management time and resources.
Economic recessions or downturns could impair our portfolio companies’ performance and defaults by our portfolio companies will harm our operating results.
Many of our portfolio companies are susceptible to economic slowdowns or recessions and could be unable to repay our loans during these periods. Therefore, the number of non-performing assets are likely to increase and the value of our portfolio is likely to decrease during these periods. Adverse economic conditions could decrease the value of collateral securing any of our loans and the value of any equity investments. A severe recession could further decrease the value of such collateral and result in losses of value in our portfolio and a decrease in our revenues, net income, assets and net worth. Economic slowdowns or recessions could lead to financial losses in our portfolio and a decrease in revenues, net income and assets. Unfavorable economic conditions also could increase our funding costs, limit our access to the capital markets or result in a decision by lenders not to extend credit to us. These events could prevent us from maintaining or increasing the level of our investments and harm our operating results.
Any deterioration of general economic conditions could lead to significant declines in corporate earnings or loan performance, and the ability of corporate borrowers to service their debt, any of which could trigger a period of global economic slowdown, and have an adverse impact on our performance and financial results, and the value and the liquidity of our investments. In an economic downturn, we could have non-performing assets or an increase in non-performing assets, and we would anticipate that the value of our portfolio would decrease during these periods. Failure to satisfy financial or operating covenants imposed by lenders, including us, to a portfolio company could lead to defaults and, potentially, acceleration of payments on such loans and foreclosure on the assets representing collateral for the portfolio company’s obligations. Cross default provisions under other agreements could be triggered and thus limit the portfolio company’s ability to satisfy its obligations under any debt that we hold and affect the value of any securities we own. We would expect to incur expenses to the extent necessary to seek recovery upon default or to negotiate new terms with a portfolio company following or in anticipation of a default.
Rising credit spreads could affect the value of our investments, and rising interest rates make it more difficult for portfolio companies to make periodic payments on their loans.
Some of our portfolio investments are debt securities that bear interest at variable rates and may be negatively affected by changes in market interest rates. Rising interest rates make it more difficult for borrowers to repay debt, which could increase the risk of payment defaults and cause the portfolio companies to defer or cancel needed investment. Any failure of one or more portfolio companies to repay or refinance its debt at or prior to maturity or the inability of one or more portfolio companies to make ongoing payments following an increase in contractual interest rates could have a material adverse effect on our business, financial condition, results of operations and cash flows. The value of our securities could also be reduced from an increase in market credit spreads as rates available to investors could make an investment in our securities, including shares of our common stock, less attractive than alternative investments.
Conversely, decreases in market interest rates could negatively impact the interest income from our variable rate debt investments while the interest we pay on our fixed rate debt securities does not change. A decrease in market interest rates may also have an adverse impact on our returns by requiring us to accept lower yields on our debt investments and by increasing the risk that our portfolio companies will prepay our debt investments, resulting in the need to redeploy capital at potentially lower rates.
Inflation could adversely affect the business, results of operations and financial condition of our portfolio companies.
Certain of our portfolio companies are in industries that could be impacted by inflation. If such portfolio companies are unable to pass any increases in their costs of operations along to their customers, it could adversely affect their operating results and impact their ability to pay dividends on our equity investments and/or interest and principal on our loans, particularly if interest rates rise in response to inflation. In addition, any projected future decreases in our portfolio companies’ operating results due to inflation could adversely impact the fair value of those investments. Any decreases in the fair value of our investments could result in future realized or unrealized losses and therefore reduce our net increase (decrease) in net assets resulting from operations.
We may be exposed to higher risks with respect to our investments that include original issue discount or PIK interest.
Our investments may include original issue discount and contractual PIK interest, which represents contractual interest added to a loan balance and due at the end of such loan’s term. To the extent original issue discount or PIK interest constitute a portion of our income, we are exposed to typical risks associated with such income being required to be included in taxable and accounting income prior to receipt of cash, including the following:
•original issue discount and PIK instruments may have higher yields, which reflect the payment deferral and credit risk associated with these instruments;
•cash distributions paid to investors representing original issue discount income may be effectively paid from offering proceeds or borrowings during any given period; thus, although the source for the cash used to pay a distribution of original issue discount income may come from the cash invested by investors, or our borrowings, the 1940 Act does not require that investors be given notice of this fact;
•original issue discount and PIK instruments may have unreliable valuations because their continuing accruals require continuing judgments about the collectability of the deferred payments and the value of the collateral; and
•original issue discount and PIK instruments may represent a higher credit risk than coupon loans; even if the conditions for income accrual under the generally accepted accounting principles in the United States of America (“U.S. GAAP”) are satisfied, a borrower could still default when actual payment is due upon the maturity of such loan.
The lack of liquidity in our investments may adversely affect our business.
We generally invest in companies whose securities are not publicly traded and whose securities will be subject to legal and other restrictions on resale or will otherwise be less liquid than publicly traded securities. The illiquidity of these investments may make it difficult for us to sell these investments when desired. In addition, if we are required to liquidate all or a portion of our portfolio quickly, we may realize significantly less than the value at which we had previously recorded these investments. As a result, we do not expect to achieve liquidity in our investments in the near-term. The illiquidity of most of our investments may make it difficult for us to dispose of them at a favorable price and, as a result, we may suffer losses.
We may not have the funds or ability to make additional investments in our portfolio companies.
We may not have the funds or ability to make additional investments in our portfolio companies. After our initial investment in a portfolio company, we may be called upon from time to time to provide additional funds to such company or have the opportunity to increase our investment through the extension of additional loans, the exercise of a warrant to purchase equity securities, or the funding of additional equity investments. There is no assurance that we will make, or will have sufficient funds to make, follow-on investments. Any decisions not to make a follow-on investment or any inability on our part to make such an investment may have a negative impact on a portfolio company in need of such an investment, may result in a missed opportunity for us to increase our participation in a successful operation, may reduce our ability to protect an existing investment or may reduce the expected yield on the investment.
There may be circumstances where our debt investments could be subordinated to claims of other creditors or we could be subject to lender liability claims.
Our portfolio companies may have, or may be permitted to incur, other debt that ranks equally with, or senior to, the debt in which we invest. By their terms, such debt instruments may entitle the holders to receive payment of interest or principal on or before the dates on which we are entitled to receive payments with respect to the debt instruments in which we invest. Also, in the event of insolvency, liquidation, dissolution, reorganization or bankruptcy of a portfolio company, holders of debt instruments ranking senior to our investment in that portfolio company would typically be entitled to receive payment in full before we receive any distribution. After repaying such senior creditors, such portfolio company may not have any remaining assets to use for repaying its obligation to us. In the case of debt ranking equally with debt instruments in which we invest, we would have to share on an equal basis any distributions with other creditors holding such debt in the event of an insolvency, liquidation, dissolution, reorganization or bankruptcy of the relevant portfolio company.
Even if our investment is structured as a senior-secured loan, principles of equitable subordination, as defined by existing case law, could lead a bankruptcy court to subordinate all or a portion of our claim to that of other creditors and transfer any lien securing such subordinated claim to the bankruptcy estate. The principles of equitable subordination defined by case law have generally indicated that a claim may be subordinated only if its holder is guilty of misconduct or where the senior loan is re-characterized as an equity investment and the senior lender has actually provided significant managerial assistance to the bankrupt debtor. We may also be subject to lender liability claims for actions taken by us with respect to a borrower’s business or instances where we exercise control over the borrower. It is possible that we could become subject to a lender liability claim, including as a result of actions taken in rendering significant managerial assistance or actions to compel and collect payments from the borrower outside the ordinary course of business.
We generally will not control our portfolio companies.
We do not, and do not expect to, control the decision making in many of our portfolio companies, even though we may have board representation or board observation rights, and our debt agreements may contain certain restrictive covenants. As a result, we are subject to the risk that a portfolio company in which we invest will make business decisions with which we disagree and the management of such company will take risks or otherwise act in ways that do not serve our interests as debt investors or minority equity holders. Due to the lack of liquidity for our investments in non-traded companies, we may not be able to dispose of our interests in our portfolio companies as readily as we would like or at an appropriate valuation. As a result, a portfolio company may make decisions that would decrease the value of our portfolio holdings.
Defaults by our portfolio companies will harm our operating results.
A portfolio company’s failure to satisfy financial or operating covenants imposed by us or other lenders could lead to non-payment of interest and other defaults and, potentially, termination of its loans and foreclosure on its secured assets, which could trigger cross-defaults under other agreements and jeopardize a portfolio company’s ability to meet its obligations under the debt or equity securities that we hold. We may incur expenses to the extent necessary to seek recovery upon default or to negotiate new terms, which may include the waiver of certain financial covenants, with a defaulting portfolio company.
Any unrealized depreciation that we experience in our portfolio may be an indication of future realized losses, which could reduce our income and gains available for distribution.
As a BDC, we are required to carry our investments at market value or, if no market value is ascertainable, at the fair value as determined in accordance with our Valuation Procedures adopted pursuant to Rule 2a-5 under the 1940 Act. Decreases in the market values or fair values of our investments will be recorded as unrealized depreciation. Any unrealized depreciation in our portfolio could be an indication of a portfolio company’s inability to meet its repayment obligations to us with respect to affected loans or a potential impairment of the value of affected equity investments. This could result in realized losses in the future and ultimately in reductions of our income and gains available for distribution in future periods.
Prepayments of our debt investments by our portfolio companies could adversely impact our results of operations and reduce our return on equity.
We are subject to the risk that the investments we make in our portfolio companies may be repaid prior to maturity. When this occurs, we will generally reinvest these proceeds in temporary investments, pending their future investment in new portfolio companies. These temporary investments will typically have substantially lower yields than the debt being prepaid and we could experience significant delays in reinvesting these amounts. Any future investment in a new portfolio company may also be at lower yields than the debt that was repaid. As a result, our results of operations could be materially adversely affected if one or more of our portfolio companies elect to prepay amounts owed to us. Additionally, prepayments could negatively impact our return on equity, which could result in a decline in the market price of our securities.
We may be subject to risks associated with “covenant-lite” loans.
Some of the loans in which we invest may be “covenant-lite” loans, which means the loans contain fewer maintenance covenants than other loans (in some cases, none) and do not include terms which allow the lender to monitor the performance of the borrower and declare a default if certain criteria are breached. Generally, “covenant-lite” loans provide borrower companies more freedom to negatively impact lenders because their covenants are incurrence-based, which means they are only tested and can only be breached following an affirmative action of the borrower, rather than by a deterioration in the borrower’s financial condition. To the extent we invest in covenant-lite loans, we may have fewer rights against a borrower and may have a greater risk of loss on such investments as compared to investments in loans with finance maintenance covenants.
We may not realize gains from our equity investments.
Certain investments that we have made in the past and may make in the future include warrants or other equity securities. Investments in equity securities involve a number of significant risks, including the risk of further dilution as a result of additional issuances, inability to access additional capital and failure to pay current distributions. Investments in preferred securities involve special risks, such as the risk of deferred distributions, credit risk, illiquidity and limited voting rights. In addition, we may from time to time make non-control, equity investments in portfolio companies. Our goal is ultimately to realize gains upon our disposition of such equity interests. However, these equity interests may not appreciate in value and, in fact, may decline in value. Accordingly, we may not be able to realize gains from our equity interests, and any gains that we do realize on the disposition of any equity interests may not be sufficient to offset any other losses we experience. We also may be unable to realize any value if a portfolio company does not have a liquidity event, such as a sale of the business, recapitalization or public offering, which would allow us to sell the underlying equity interests. We often seek puts or similar rights to give us the right to sell our equity securities back to the portfolio company issuer; however, we may be unable to exercise these put rights for the consideration provided in our investment documents if the issuer is in financial distress.
Our investments in foreign securities may involve significant risks in addition to the risks inherent in U.S. investments.
Our investment strategy contemplates potential investments in debt securities of foreign companies. Investing in foreign companies may expose us to additional risks not typically associated with investing in securities of U.S. companies. These risks include changes in exchange control regulations, political and social instability, expropriation, imposition of foreign taxes, less liquid markets and less available information than is generally the case in the U.S., higher transaction costs, less government supervision of exchanges, brokers and issuers, less developed bankruptcy laws, difficulty in enforcing contractual obligations, lack of uniform accounting and auditing standards and greater price volatility.
Although most of our investments will be U.S. dollar denominated, any investments denominated in a foreign currency will be subject to the risk that the value of a particular currency will change in relation to one or more other currencies. Among the factors that may affect currency values are trade balances, the level of short-term interest rates, differences in relative values of similar assets in different currencies, long-term opportunities for investment and capital appreciation, and political developments.
RISKS RELATED TO LEVERAGE
Because we borrow money, the potential for gain or loss on amounts invested in us is magnified and may increase the risk of investing in us.
Borrowings, also known as leverage, magnify the potential for loss on investments in our indebtedness and gain or loss on investments in our equity capital. As we use leverage to partially finance our investments, you will experience increased risks of investing in our securities. Accordingly, any event that adversely affects the value of an investment would be magnified to the extent we use leverage. Such events could result in a substantial loss to us, which would be greater than if leverage had not been used. In addition, our investment objectives are dependent on the continued availability of leverage at attractive relative interest rates.
We or our wholly-owned subsidiaries may also borrow from banks and other lenders and may issue debt securities or enter into other types of borrowing arrangements in the future. Lenders of these senior securities will have fixed dollar claims on our or our subsidiaries’ assets that are superior to the claims of equity holders, and we would expect such lenders to seek recovery against our or our subsidiaries’ assets in the event of a default. We have the ability to pledge up to 100% of our assets and can grant a security interest in all of our assets under the terms of any debt instruments we could enter into with lenders. The terms of our and our wholly-owned subsidiary’s existing indebtedness require compliance with certain financial and operational covenants, and we expect similar covenants in future debt instruments. Failure to comply with such covenants could result in a default under the applicable credit facility or debt instrument if we are unable to obtain a waiver from the applicable lender or holder, and such lender or holder could accelerate repayment under such indebtedness and negatively affect our business, financial condition, results of operations and cash flows. In addition, under the terms of any credit facility or other debt instrument we or any of our subsidiaries enter into, in the event of a default, we are likely to be required by its terms to use the net proceeds of any investments that we sell to repay a portion of the amount borrowed under such facility or instrument before applying such net proceeds to any other uses.
If the value of our assets decreases, leveraging would cause NAV to decline more sharply than it otherwise would have had we not leveraged our business. Similarly, any decrease in our income would cause net investment income to decline more sharply than it would have had we not leveraged our business. Such a decline could negatively affect our ability to pay common stock dividends, scheduled debt payments or other payments related to our securities.
Illustration: The following table illustrates the effect of leverage on returns from an investment in our common stock assuming various annual returns, net of expenses. The calculations in the table below are hypothetical and actual returns may be higher or lower than those appearing below.
| | | | | | | | | | | | | | | | | | | | | | | | | | | | | |
Assumed Return on Our Portfolio(1) (net of expenses) | (10.0)% | | (5.0)% | | 0.0% | | 5.0% | | 10.0% |
Corresponding Net Return to Common Stock Holder(2) | (26.0)% | | (16.1)% | | (6.2)% | | 3.8% | | 13.7% |
_____________________________
(1)Assumes, as of September 30, 2024, $1,227.3 million in total assets, $556.7 million in debt outstanding, $618.5 million in net assets and a weighted-average interest rate of 6.8%. Actual interest payments may be different.
(2)In order for us to cover our annual interest payments on indebtedness, we must achieve annual returns on our September 30, 2024 total assets of at least 3.1%.
Our ability to achieve our investment objective may depend in part on our ability to access additional leverage on favorable terms and there can be no assurance that such additional leverage can in fact be achieved. If we are unable to obtain leverage or if the interest rates of such leverage are not attractive, we could experience diminished returns. The number of leverage providers and the total amount of financing available could decrease or remain static.
Substantially all of our assets are subject to security interests under our senior securities and if we default on our obligations under our senior securities, we may suffer adverse consequences, including foreclosure on our assets.
Substantially all of our assets are currently pledged as collateral under our credit facilities. If we default on our obligations under our credit facilities, our lenders may have the right to foreclose upon and sell, or otherwise transfer, the collateral subject to their security interests or their superior claim. In such event, we may be forced to sell our investments to raise funds to repay our outstanding borrowings in order to avoid foreclosure and these forced sales may be at times and at prices we would not consider advantageous. Moreover, such deleveraging of our company could significantly impair our ability to effectively operate our business in the manner in which we have historically operated. As a result, we could be forced to curtail or cease new investment activities and lower or eliminate the dividends that we have historically paid to our stockholders. In addition, if the lenders exercise their right to sell the assets pledged under our credit facilities, such sales may be completed at distressed sale prices, thereby diminishing or potentially eliminating the amount of cash available to us after repayment of the amounts of outstanding borrowings.
If our operating performance declines and we are not able to generate sufficient cash flow to service our debt obligations, we may in the future need to refinance or restructure our debt, sell assets, reduce or delay capital investments, seek to raise additional capital or seek to obtain waivers from the required lenders under our debt obligations to avoid being in default. If we are unable to implement one or more of these alternatives, we may not be able to meet our payment obligations under our debt obligations. If we breach our covenants under our debt obligations and seek a waiver, we may not be able to obtain a waiver from the required lenders or debt holders. If this occurs, we would be in default under our debt obligations, the lenders or debt holders could exercise their rights as described above, and we could be forced into bankruptcy or liquidation. If we are unable to repay debt, lenders having secured obligations could proceed against the collateral securing the debt. Because certain of our debt obligations have customary cross-default provisions, if the indebtedness under our debt obligations is accelerated, we may be unable to repay or finance the amounts due.
We are subject to risks associated with any revolving credit facility that utilizes a structured subsidiary as our interests in any structured subsidiary are subordinated and we could be prevented from receiving cash on our equity interests from a structured subsidiary.
We own directly or indirectly 100% of the equity interests in MSIF Funding, LLC (“MSIF Funding”), a special purpose structured subsidiary (the “Structured Subsidiary”) utilized in our senior secured special purpose vehicle revolving credit facility (the “SPV Facility”). We consolidate the financial statements of MSIF Funding in our consolidated financial statements and treat the indebtedness under the SPV Facility as our leverage. Our interest in MSIF Funding is subordinated in priority of payment to every other obligation of MSIF Funding and is subject to certain payment restrictions set forth in the SPV Facility.
We receive cash from MSIF Funding only to the extent that we receive distributions on our equity interests therein. MSIF Funding could make distributions on its equity interests only to the extent permitted by the payment priority provisions of the SPV Facility. The SPV Facility generally provides that payments on the respective interests could not be made on any payment date unless all amounts owing to the lenders and other secured parties are paid in full. In addition, if MSIF Funding does not meet the leverage and borrowing base requirements set forth in the agreement governing the SPV Facility, a default could occur. In the event of a default under the SPV Facility credit agreement, cash would be diverted from us to pay the applicable lenders and other secured parties in amounts sufficient to cause such tests to be satisfied. In the event that we fail to receive cash from MSIF Funding, we could be unable to make distributions to our stockholders in amounts sufficient to maintain our status as a RIC, or at all. We also could be forced to sell investments in portfolio companies at less than their fair value in order to continue making such distributions. We cannot assure you that distributions on the assets held by MSIF Funding will be sufficient to make any distributions to us or that such distributions will meet our expectations.
Our equity interest in MSIF Funding ranks behind all of the secured and unsecured creditors, known or unknown, including the lenders in the SPV Facility. Consequently, to the extent that the value of MSIF Funding’s portfolio of loan investments has been reduced as a result of conditions in the credit markets, defaulted loans, capital gains and losses on the underlying assets, prepayment or changes in interest rates, the returns on our investments in MSIF Funding could be reduced. Accordingly, our investments in MSIF Funding could be subject to up to 100% loss.
The ability to sell investments held by a Structured Subsidiary is limited.
The credit agreement governing the SPV Facility places significant restrictions on our ability, as servicer, to sell investments. As a result, there could be times or circumstances during which we are unable to sell investments or take other actions that might be in our best interests.
We may invest in derivatives or other assets that expose us to certain risks, including market risk, liquidity risk and other risks similar to those associated with the use of leverage.
We may invest in derivatives and other assets that are subject to many of the same types of risks related to the use of leverage. Derivative transactions, if any, will generally create leverage for us and involve significant risks. The primary risks related to derivative transactions include counterparty, correlation, liquidity, leverage, volatility, over-the-counter trading, operational and legal risks. In addition, a small investment in derivatives could have a large potential impact on our performance, effecting a form of investment leverage on our portfolio. In certain types of derivative transactions, we could lose the entire amount of our investment; in other types of derivative transactions the potential loss is theoretically unlimited.
Under Rule 18f-4 under the 1940 Act (“Rule 18f-4”), related to use of derivatives, short sales, reverse repurchase agreements and certain other transactions by BDCs, we are permitted to enter into derivatives and other transactions that create future payment or delivery obligations, including short sales, notwithstanding the senior security provision of the 1940 Act if we comply with certain value-at-risk leverage limits, adopt a derivatives risk management program and implement board oversight and reporting requirements or otherwise comply with a “limited derivatives users” exception. Rule 18f-4 also permits us to enter into reverse repurchase agreements or similar financing transactions notwithstanding the senior security provision of the 1940 Act if we aggregate the amount of indebtedness associated with our reverse repurchase agreements or similar financing transactions with the aggregate amount of any other senior securities representing indebtedness when calculating the asset coverage ratios as discussed herein. We may otherwise engage in such transaction as a “derivatives transaction” for purposes of compliance with the rule. Furthermore, we are permitted to enter into an unfunded commitment agreement, and such unfunded commitment agreement will not be subject to the asset coverage requirements under the 1940 Act if we reasonably believe, at the time we enter into such agreement, that we will have sufficient cash and cash equivalents to meet our obligations with respect to all such agreements as they come due. We cannot predict the effects of these requirements.
We have adopted updated policies and procedures in compliance with Rule 18f-4. We expect to qualify as a “limited derivatives user.” Future legislation or rules may modify how we treat derivatives and other financial arrangements for purposes of our compliance with the leverage limitations of the 1940 Act, which may be materially adverse to us and our investors.
RISKS RELATED TO OUR ADVISER AND ITS AFFILIATES
Our Adviser has conflicts of interest that may create an incentive for the Adviser to enter into investments that are riskier or more speculative than would otherwise be the case and our Adviser may have an incentive to increase portfolio leverage in order to earn higher management fees.
Our Adviser and its affiliates, including our officers, may have conflicts of interest as a result of compensation arrangements, time constraints and competition for investments, which they will attempt to resolve in a fair and equitable manner, but which may result in actions that are not in the best interests of our stockholders. Our Adviser receives substantial fees from us in return for its services and these fees could influence the investment and other decisions they make on our behalf.
The incentive fee payable by us to our Adviser may create an incentive for it to make investments on our behalf that are risky or more speculative than would be the case in the absence of such compensation arrangement. The way in which the incentive fee payable to our Adviser is determined may encourage it to use leverage to increase the return on our investments. As additional leverage would magnify positive returns, if any, on our portfolio, our incentive fee would become payable to our Adviser (i.e., exceed the hurdle rate) at a lower average gross return on our portfolio. Additionally, the incentive fee payable by us to the Adviser may create an incentive for the Adviser to cause us to realize capital gains or losses that may not be in the best interests of us or our stockholders. Under the incentive fee structure, the Adviser benefits when we recognize capital gains and, because the Adviser determines when an investment is sold, the Adviser can influence the timing of the recognition of such capital gains.
In addition, the fact that our management fee is payable based upon our total assets, which includes any borrowings for investment purposes, may encourage our Adviser to use leverage to make additional investments. Under certain circumstances, the use of leverage (or an investment in companies that are highly leveraged) may increase the likelihood of default, which would result in higher investment losses.
We may be obligated to pay our Adviser incentive compensation even if we incur a net loss due to a decline in the value of our portfolio.
The New Investment Advisory Agreement entitles our Adviser to receive incentive compensation on income regardless of any capital losses. In such case, we may be required to pay our Adviser incentive compensation for a fiscal quarter even if there is a decline in the value of our portfolio or if we incur a net loss for that quarter.
Any incentive fee payable by us that relates to our net investment income may be computed and paid on income that may include interest that has been accrued but not yet received. If a portfolio company defaults on a loan that is structured to provide accrued interest, it is possible that accrued interest previously included in the calculation of the incentive fee will become uncollectible. Our Adviser will not be under any obligation to reimburse us for any part of the incentive fee it received that was based on accrued income that we never received in cash as a result of a default by an entity on the obligation that resulted in the accrual of such income and such circumstances would result in our paying an incentive fee on income we never received in cash.
Our Adviser may face conflicts of interest in allocating investment opportunities between us, Main Street and the other funds and clients managed by our Adviser.
The investment professionals utilized by our Adviser are also the investment professionals responsible for investing and managing Main Street’s investment portfolio as well as the investment portfolios of other funds and clients managed by our Adviser. These professionals are responsible for allocating investment opportunities between us, Main Street and other funds and clients managed by it. We have made and, in the future, intend to make co-investments with Main Street and other funds or clients advised by the Adviser in accordance with the conditions of an exemptive relief order from the SEC permitting such co-investment transactions. The order requires, among other things, that Main Street and the Adviser consider whether each such investment opportunity is appropriate for us, Main Street and the Adviser’s advised clients and, if it is appropriate, to propose an allocation of the investment opportunity between such other parties. As a consequence, it may be more difficult for us to maintain or increase the size of our investment portfolio in the future. Although the Adviser and Main Street will endeavor to allocate investment opportunities in a fair and equitable manner, including in accordance with the conditions set forth in the order issued by the SEC when relying on such order, we may face conflicts in allocating investment opportunities between us, Main Street and other funds and clients managed by the Adviser. Because our Adviser may receive performance-based fee compensation from the other funds and clients it manages if such funds or client have more favorable terms or provisions than with us, this may provide our Adviser an incentive to allocate opportunities to other funds and clients our Adviser manages instead of us. Our Adviser and Main Street have implemented an allocation policy to ensure the equitable distribution of investment opportunities and, as a result, we may be unable to participate in certain investments based upon such allocation policy.
Main Street will own in excess of 3% of our common stock, which could result in its influence over the outcome of matters submitted to the vote of our stockholders.
Upon completion of this offering, Main Street will own approximately 3.0% of our outstanding common stock (or approximately 3.0% assuming the underwriters’ option to purchase additional shares is exercised in full). In addition, Main Street intends to purchase up to $20.0 million in the aggregate of shares of our common stock in the open market for a 12-month period starting on a date determined by Main Street following the consummation of this offering, pursuant to the terms of the Main Street Rule 10b5-1 Stock Purchase Plan that Main Street intends to enter in connection with or shortly after the closing of this offering. As a result, Main Street may have influence over the outcome of matters submitted to a vote of our stockholders, including the election of our directors or transactions involving a change in control. Their interests may conflict with, or differ from, the interests of our other stockholders, including you. So long as Main Street continues to own shares of our common stock, it could influence our corporate decisions submitted to our stockholders for approval, regardless of whether we terminate the management agreement with the Adviser.
Under Section 12 of the 1940 Act, investment companies, including other business development companies such as Main Street, generally cannot acquire more than 3% of our total outstanding voting stock, among other limitations. In light of these restrictions, on January 20, 2025, in connection with this offering and Main Street’s potential acquisition in excess of 3% of our outstanding common stock as a result of the purchase by Main Street of the Main Street Indicative Commitment Shares and any additional acquisitions pursuant to the terms of the Main Street Rule 10b5-1 Stock Purchase Plan that Main Street intends to enter in connection with or shortly after the closing of this offering, we entered into the Main Street Fund of Funds Agreement. The Main Street Fund of Funds Agreement provides for the acquisition of our shares of common stock by Main Street, and our sale of such shares to Main Street, in a manner consistent with the requirements of Rule 12d1-4 under the 1940 Act.
Our ability to enter into transactions with our affiliates is restricted.
As a BDC, we are prohibited under the 1940 Act from participating in certain transactions with certain of our affiliates without the prior approval of a majority of our independent directors and, in some cases, the SEC. Any person that owns, directly or indirectly, 5% or more of our outstanding voting securities is our affiliate for purposes of the 1940 Act, and we are generally prohibited from buying or selling any securities from or to such affiliate on a principal basis, absent the prior approval of our board of directors and, in some cases, the SEC. The 1940 Act also prohibits certain “joint” transactions with certain of our affiliates, which in certain circumstances could include investments in the same portfolio company (whether at the same or different times to the extent the transaction involves a joint investment), without prior approval of our board of directors and, in some cases, the SEC. If a person acquires more than 25% of our voting securities, we will be prohibited from buying or selling any security from or to such person or certain of that person’s affiliates, or entering into prohibited joint transactions with such persons, absent the prior approval of the SEC. Similar restrictions limit our ability to transact business with our officers or directors or their affiliates.
The SEC has interpreted the BDC regulations governing transactions with affiliates to prohibit certain joint transactions involving the BDC and entities that share a common investment adviser or are otherwise affiliated with the BDC’s investment adviser. As a result of these restrictions, we are prohibited from buying or selling any security from or to any portfolio company that is controlled by a fund advised by the Adviser or their respective affiliates or is otherwise affiliated with the BDC’s investment adviser without the prior approval of the SEC, which may limit the scope of investment opportunities that would otherwise be available to us.
We may, however, invest alongside our Adviser’s and/or its affiliates’ other clients or entities otherwise affiliated with our Adviser (including Main Street), in certain circumstances where doing so is consistent with applicable law and SEC staff interpretations, guidance and exemptive relief orders. However, although the Adviser endeavors to fairly allocate investment opportunities in the long run, we can offer no assurance that investment opportunities will be allocated to us fairly or equitably in the short-term or over time. As noted above, the SEC has granted us, Main Street and our Adviser an exemptive order that allows us to enter into certain negotiated co-investment transactions alongside Main Street and other funds or clients advised by the Adviser in a manner consistent with our investment objective, positions, policies, strategies, and restrictions as well as regulatory requirements and other pertinent factors, subject to compliance with the exemptive order. Pursuant to the exemptive order, we are permitted to co-invest with our affiliates, including Main Street, if a “required majority” (as defined in Section 57(o) of the 1940 Act) of our eligible directors make certain conclusions in connection with a co-investment transaction, including that (1) the terms of the transactions, including the consideration to be paid, are reasonable and fair to us and our stockholders and do not involve overreaching in respect of us or our stockholders on the part of any person concerned, and (2) the transaction is consistent with the interests of our stockholders and is consistent with our investment objective and strategies.
In situations where co-investment with affiliates’ other clients or entities otherwise affiliated with our Adviser (such as Main Street) is not permitted under the 1940 Act and related rules, existing or future staff guidance, or the terms and conditions of the exemptive order granted to us by the SEC (as discussed above), our Adviser will need to decide which entity or entities will proceed with the investment. Generally, we will not have an entitlement to make a co-investment in these circumstances and, to the extent that another entity elects to proceed with the investment, we will not be permitted to participate. Moreover, except in certain circumstances, we will not invest in any issuer in which an affiliate or an affiliate’s other client holds a controlling interest.
Our Adviser’s liability is limited under the New Investment Advisory Agreement, and we have agreed to indemnify our Adviser against certain liabilities, which may lead our Adviser to act in a riskier manner on our behalf than it would when acting for its own account.
Under the New Investment Advisory Agreement, our Adviser and its officers, directors, managers, partners, shareholders, members (and their shareholders or members, including the owners of their shareholders or members), agents, employees, controlling persons and any other person or entity affiliated with or acting on behalf of the Adviser are not liable to us for acts or omissions performed by our Adviser in accordance with and pursuant to the New Investment Advisory Agreement, except those resulting from acts constituting fraud, willful misfeasance, bad faith or gross negligence in the performance of the Adviser’s duties or by reason of the reckless disregard of the Adviser’s duties and obligations under the New Investment Advisory Agreement. In addition, we have agreed to indemnify our Adviser and its officers, directors, managers, partners, shareholders, members (and their shareholders or members, including the owners of their shareholders or members), agents, employees, controlling persons and any other person or entity affiliated with or acting on behalf of the Adviser from and against any claims or liabilities, including reasonable legal fees, arising out of or in connection with any action taken or omitted on our behalf pursuant to authority granted by the New Investment Advisory Agreement, except where attributable to fraud, willful misfeasance, bad faith or gross negligence in the performance of the Adviser’s duties or by reason of the reckless disregard of the Adviser’s duties and obligations under the New Investment Advisory Agreement. These protections may lead our Adviser to act in a riskier manner when acting on our behalf than they would when acting for their own account.
Our Adviser can resign on 120 days’ notice and we may not be able to find a suitable replacement within that time, resulting in a disruption in our operations that could adversely affect our financial condition, business and results of operations.
Our Adviser has the right, under the New Investment Advisory Agreement, to resign at any time upon not less than 120 days’ written notice, whether we have found a replacement or not. If our Adviser resigns, we may not be able to find a replacement or hire internal management with similar expertise and ability to provide the same or equivalent services on acceptable terms within 120 days or at all. If we are unable to do so quickly, our operations are likely to experience a disruption, our financial condition, business and results of operations as well as our ability to pay distributions are likely to be adversely affected and the value of our shares may decline. Even if we are able to retain comparable management, whether internal or external, the integration of such management and their lack of familiarity with our investment objective may result in additional costs and time delays that may adversely affect our business, financial condition, results of operations and cash flows.
RISKS RELATED TO BDCs
Operating under the constraints imposed on us as a BDC and RIC may hinder the achievement of our investment objectives.
The 1940 Act and the Code impose numerous constraints on the operations of BDCs and RICs that do not apply to certain of the other investment vehicles that we may compete with. BDCs are required, for example, to invest at least 70% of their total assets in certain qualifying assets, including U.S. private or thinly traded public companies, cash, cash equivalents, U.S. government securities and other high-quality debt instruments that mature in one year or less from the date of investment. Moreover, qualification for taxation as a RIC requires satisfaction of source-of-income, asset diversification and distribution requirements. Operating under these constraints may hinder our ability to take advantage of attractive investment opportunities and to achieve our investment objective. Any failure to do so could subject us to enforcement action by the SEC, cause us to fail to satisfy the requirements associated with RIC status and subject us to entity-level corporate income taxation, cause us to fail the 70% test described above or otherwise have a material adverse effect on our business, financial condition or results of operations.
We may be precluded from investing in what our Adviser believes are attractive investments if such investments are not qualifying assets for purposes of the 1940 Act. If we do not invest a sufficient portion of our assets in qualifying assets, we will be prohibited from making any additional investment that is not a qualifying asset and could be forced to forgo attractive investment opportunities. Similarly, these rules could prevent us from making follow-on investments in existing portfolio companies (which could result in the dilution of our position).
If we fail to maintain our status as a BDC, we might be regulated as a closed-end investment company that is required to register under the 1940 Act, which would subject us to additional regulatory restrictions and significantly decrease our operating flexibility. In addition, any such failure could cause an event of default under any outstanding indebtedness we might have, which could have a material adverse effect on our business, financial condition or results of operations.
Regulations governing our operation as a BDC will affect our ability to, and the way in which we, raise additional capital.
Our business will require capital to operate and grow. We may acquire such additional capital from the following sources:
Senior Securities
We may issue debt securities or preferred stock and/or borrow money from banks or other financial institutions, which we refer to collectively as senior securities. As a result of issuing senior securities, we will be exposed to additional risks, including the following:
•Under the provisions of the 1940 Act, we are permitted, as a BDC, to issue senior securities only in amounts such that our asset coverage, as defined in the 1940 Act, equals at least 200% (or 150% if certain requirements are met) immediately after each issuance of senior securities. If the value of our assets declines, we may be unable to satisfy this test. If that happens, we will be prohibited from issuing debt securities or preferred stock and/or borrowing money from banks or other financial institutions and may not be permitted to declare a cash dividend or make any cash distribution to stockholders or repurchase shares until such time as we satisfy this test.
•Any amounts that we use to service our debt or make payments on preferred stock will not be available for dividends to our common stockholders.
•It is likely that any senior securities or other indebtedness we issue will be governed by an indenture or other instrument containing covenants restricting our operating flexibility. Additionally, some of these securities or other indebtedness may be rated by rating agencies, and in obtaining a rating for such securities and other indebtedness, we may be required to abide by operating and investment guidelines that further restrict operating and financial flexibility.
•We and, indirectly, our stockholders will bear the cost of issuing and servicing such securities and other indebtedness.
•Preferred stock or any convertible or exchangeable securities that we issue in the future may have rights, preferences and privileges more favorable than those of our common stock, including separate voting rights and could delay or prevent a transaction or a change in control to the detriment of the holders of our common stock.
•Any unsecured debt issued by us would generally rank (i) pari passu with our current and future unsecured indebtedness and effectively subordinated to all of our existing and future secured indebtedness, to the extent of the value of the assets securing such indebtedness, and (ii) structurally subordinated to all existing and future indebtedness and other obligations of any of our subsidiaries.
Additional Common Stock
We are not generally able to issue and sell our common stock at a price below NAV per share. We may, however, sell our common stock, warrants, options or rights to acquire our common stock, at a price below the current NAV per share of the common stock if our board of directors determines that such sale is in the best interests of our stockholders, and our stockholders approve such sale. Moreover, we can offer no assurance that we will be able to issue and sell additional equity securities in the future, on favorable terms or at all.
Previously enacted legislation may allow us to incur additional leverage.
The 1940 Act generally prohibits us from incurring indebtedness unless immediately after such borrowing we have an asset coverage for total borrowings of at least 200% (i.e., the amount of debt may not exceed 50% of the value of our assets). However, legislation passed in March 2018 modified the 1940 Act by allowing a BDC to increase the maximum amount of leverage it may incur by lowering the required asset coverage ratio of 200% to an asset coverage ratio of 150% (i.e., the amount of debt may not exceed 662/3% of the value of our assets), if certain requirements are met. Under the legislation, we are allowed to increase our leverage capacity if stockholders representing at least a majority of the votes cast, when a quorum is met, approve a proposal to do so. If we receive stockholder approval, we would be allowed to increase our leverage capacity on the first day after such approval. Alternatively, the legislation allows a “required majority” (as defined in Section 57(o) of the 1940 Act) of the members of our board of directors to approve an increase in our leverage capacity, and such approval would become effective after one year from the date of approval. As a result of this legislation, we may be able to increase our leverage up to an amount that reduces our asset coverage ratio from 200% to 150%.
RISKS RELATED TO THIS OFFERING AND AN INVESTMENT IN SHARES OF OUR COMMON STOCK
Investing in our securities may involve a high degree of risk.
The investments we make in accordance with our investment objective may result in a higher amount of risk than alternative investment options and a higher risk of volatility or loss of principal. Our investments in portfolio companies involve higher levels of risk, and therefore, an investment in our securities, including shares of our common stock, may not be suitable for someone with lower risk tolerance.
There are material limitations with making available preliminary estimates of our financial results for the fiscal quarter and year ended December 31, 2024 prior to the completion of our and our auditor’s financial review procedures for such period.
The preliminary financial estimates contained in the section entitled “Prospectus Summary—Preliminary Estimates of Fourth Quarter 2024 Results” are not a comprehensive statement of our financial results for the fiscal year ended December 31, 2024 and have not been audited, reviewed, compiled, examined or subject to any procedures by Grant Thornton LLP, our independent registered public accounting firm, or any other independent accountants. Our consolidated financial statements for the fiscal year ended December 31, 2024 will not be available until after this offering is completed and, consequently, will not be available to you prior to making an investment decision in this offering. Our actual financial results for the fiscal year ended December 31, 2024 could differ materially from the preliminary financial estimates we have provided as a result of the completion of our customary financial year-end closing and related internal controls over financial reporting, final determination of the fair value of our portfolio investments, final adjustments and other developments arising between now and the time that our financial results for the fiscal year ended December 31, 2024 are finalized. The preliminary financial data included herein has been prepared by, and is the responsibility of, management. Grant Thornton LLP has not audited, reviewed, compiled, examined or performed any procedures with respect to such preliminary estimates, and, accordingly, does not express an opinion or any other form of assurance with respect thereto. In addition, the preliminary financial estimates do not include all of the information regarding our financial condition and results of operations for the fiscal quarter or year ended December 31, 2024 that may be important to investors.
Prior to this offering, there has been no public market for shares of our common stock, and we cannot assure you that a market for shares of our common stock will develop or that the market price of shares of our common stock will not decline following the offering.
Our common stock has no history of public trading. Our common stock has been approved for listing on The New York Stock Exchange under the symbol “MSIF.” We cannot assure you that a trading market will develop for our common stock after this offering or, if one develops, that such trading market can be sustained. In addition, we cannot predict the prices at which our common stock will trade. The offering price for our common stock was determined through our negotiations with the underwriters and may not bear any relationship to the market price at which it may trade after this offering. Shares of companies offered in a public offering often trade at a discount to the initial offering price due to underwriting discounts and commissions and related offering expenses. Also, shares of closed-end investment companies, including BDCs, frequently trade at a discount from NAV per share and our common stock may also be discounted in the market. This characteristic of closed-end investment companies is separate and distinct from the risk that our net asset value per share may decline. We cannot predict whether our common stock will trade at, above or below NAV per share. The risk of loss associated with this characteristic of closed-end management investment companies may be greater for investors expecting to sell shares of common stock purchased in the offering soon after the offering. In addition, if our common stock trades below its NAV per share, we will generally not be able to sell additional shares of our common stock to the public at its market price without, among other things, the requisite stockholders approving such a sale.
The market price of our common stock may be volatile and may fluctuate significantly.
The market price and liquidity of the market for our common stock that will prevail in the market after this offering may be higher or lower than the price you pay and may be significantly affected by numerous factors, some of which are beyond our control and may not be directly related to our operating performance. These factors include:
•Significant volatility in the market price and trading volume of securities of BDCs or other companies in our sector, which are not necessarily related to the operating performance of these companies;
•Price and volume fluctuations in the overall stock market from time to time;
•The inclusion or exclusion of our common stock from certain indices;
•Changes in the value of our portfolio of investments and derivative instruments as a result of changes in market factors, such as interest rate shifts, and also portfolio specific performance, such as portfolio company defaults, among other reasons;
•Changes in regulatory policies or tax guidelines, particularly with respect to RICs or BDCs;
•Loss of RIC tax treatment or BDC status;
•Distributions that exceed our net investment income and net income as reported according to U.S. GAAP;
•Changes in earnings or variations in operating results;
•Changes in accounting guidelines governing valuation of our investments;
•Any shortfall in revenue or net income or any increase in losses from levels expected by investors;
•Departure of our Adviser or certain of its key personnel;
•Inability of the Adviser to employ additional experienced investment professionals;
•General economic trends and other external factors;
•Escalation of tensions and conflicts in Europe and elsewhere, including in Ukraine and the Middle East, and disruptions in local, regional, national and global markets and economies affected thereby, including the potential for volatility in energy prices and its impact on the industries in which we invest;
•Elevating levels of inflation, and its impact on our portfolio companies and on the industries in which we invest;
•The impact of supply chain constraints on our portfolio companies and the global economy;
•Loss of a major funding source;
•The impact of information technology system failures, data security breaches, data privacy compliance, network disruptions, and cybersecurity attacks; and
•The economic and other impacts of disease outbreaks, pandemics, or any other serious public health concern, such as the Coronavirus pandemic, in the United States as well as worldwide.
We may not be able to pay distributions to our stockholders, our distributions may not grow over time, and a portion of distributions paid to our stockholders may be a return of capital.
We intend to pay distributions to our stockholders out of assets legally available for distribution. We cannot assure you that we will achieve investment results that will allow us to pay a specified level of cash distributions, previously projected distributions for future periods, or year-to-year increases in cash distributions. Our ability to pay distributions might be adversely affected by, among other things, the impact of one or more of the risk factors described herein. In addition, the inability to satisfy the asset coverage test applicable to us as a BDC could limit our ability to pay distributions. All distributions will be paid at the discretion of our board of directors and will depend on our earnings, our financial condition, maintenance of our RIC status, compliance with applicable BDC regulations, compliance with our debt covenants and such other factors as our board of directors may deem relevant from time to time. We cannot assure you that we will pay distributions to our stockholders in the future.
When we make distributions, we will be required to determine the extent to which such distributions are paid out of current or accumulated taxable earnings, recognized capital gains or capital. To the extent there is a return of capital, investors will be required to reduce their basis in our stock for U.S. federal income tax purposes, which may result in higher tax liability when the shares are sold, even if they have not increased in value or have lost value. In addition, any return of capital will be net of any sales load and offering expenses associated with sales of shares of our common stock. In the future, our distributions may include a return of capital.
Purchases of shares of our common stock by us or Main Street under open-market purchase programs, including the Company Rule 10b5-1 Stock Repurchase Plan and the Main Street Rule 10b5-1 Purchase Plan, may result in the price of shares of our common stock being higher than the price that otherwise might exist in the open market.
Our Board authorized us to repurchase shares of our common stock through an open-market share repurchase program for up to $65.0 million in the aggregate of shares of our common stock for a 12-month period starting on a date determined by the Company following the consummation of this offering. Pursuant to such authorization, in connection with or shortly after the closing of this offering, we intend to enter into the Company Rule 10b5-1 Stock Repurchase Plan to facilitate the repurchase of up to the full $65.0 million in shares of our common stock authorized under the share repurchase program in accordance with the guidelines specified in Rule 10b-18 and Rule 10b5-1 of the Exchange Act. In addition, Main Street intends to purchase up to $20.0 million in the aggregate of shares of our common stock in the open market for a 12-month period starting on a date determined by Main Street following the consummation of this offering, pursuant to the terms of the Main Street Rule 10b5-1 Stock Purchase Plan that Main Street intends to enter in connection with or shortly after the closing of this offering. The purchases of shares pursuant to the Main Street Rule 10b5-1 Stock Purchase Plan will be implemented in accordance with Rule 10b5-1 and Rule 10b-18 under the Exchange Act. These activities may have the effect of maintaining the market price of shares our common stock or mitigating a decline in the market price of the shares of our common stock, and, as a result, the price of our shares of common stock may be higher than the price that otherwise might exist in the open market.
Sales of substantial amounts of our common stock in the public market may have an adverse effect on the market price of our common stock.
Upon completion of this offering, 45,740,358 shares of our common stock will be outstanding, assuming no exercise of the underwriters’ option to purchase additional shares. The 5,500,000 shares of common stock sold in the offering (assuming no exercise of the underwriters’ option to purchase additional shares) will be freely tradable without restriction or limitation under the Securities Act, other than those shares that will be subject to a lock-up agreement with the underwriters as described below or that may be acquired through the directed share program by certain program participants, as described elsewhere in this prospectus. Any shares purchased in this offering by our affiliates, as defined in the Securities Act, will be subject to the public information, manner of sale and volume limitations of Rule 144 under the Securities Act (“Rule 144”). The shares of our common stock that were issued prior to the completion of this offering, other than 1,160,412 shares of our common stock (adjusted to reflect the Reverse Stock Split effected on December 16, 2024) held by Main Street and our executive officers and directors, will be freely tradeable without restriction or limitation under the Securities Act, other than as set forth in our Articles of Incorporation (as defined below).
The Company, its directors and executive officers, the Adviser and Main Street have agreed that, without the prior written consent of the representatives on behalf of the underwriters, they will not, and will not publicly disclose an intention to, during the period ending 180 days after the date of this prospectus (the “restricted period”), subject to certain customary exceptions:
•offer, pledge, sell, contract to sell, sell any option or contract to purchase, purchase any option or contract to sell, grant any option, right or warrant to purchase, lend or otherwise transfer or dispose of, directly or indirectly, any shares of our common stock or any securities convertible into or exercisable or exchangeable for shares of our common stock;
•file any registration statement with the SEC relating to the offering of any shares of our common stock or any securities convertible into or exercisable or exchangeable for our common stock; or
•engage in any hedging or other transaction or arrangement (including, without limitation, any short sale or the purchase or sale of, or entry into, any put or call option, or combination thereof, forward, swap or any other derivative transaction or instrument, however described or defined) which is designed or intended to, or which reasonably could be expected to lead to or result in, a sale or disposition of our common stock, or any securities convertible into or exercisable or exchangeable for our common stock (whether by the undersigned or someone other than the undersigned), or transfer of any of the economic consequences of ownership, in whole or in part, directly or indirectly, of our common stock or other securities, in cash or otherwise,
whether any such transaction described above is to be settled by delivery of our common stock or such other securities, in cash or otherwise. In addition, each such person agrees that, without the prior written consent of the representatives on behalf of the underwriters, such person will not, during the restricted period, make any demand for, or exercise any right with respect to, the registration of any shares of our common stock or any security convertible into or exercisable or exchangeable for common stock.
Additionally our articles of amendment and restatement, which will become effective upon a Listing (our “Articles of Incorporation”) contains a provision that limits the transferability of all of our shares of common stock outstanding at the time of this offering for the 365-day period following the commencement of trading of our shares of common stock on a national securities exchange (the “Trading Date”). Specifically, without the prior written consent of our board of directors (with respect to all or any portion of the Restricted Shares (as defined below)), a stockholder may not transfer (whether by sale, gift, merger, operation of law or otherwise), exchange, assign, pledge, hypothecate or otherwise dispose of or encumber (collectively, “Transfer”) shares of our common stock acquired by such stockholder prior to the Listing (the “Restricted Shares”) until:
•180 days after the Trading Date for one-third of the Restricted Shares held by such stockholder;
•270 days after the Trading Date for two-thirds of the Restricted Shares held by such stockholder; and
•365 days after the Trading Date for all remaining Restricted Shares held by such stockholder.
Any purported Transfer in violation of this provision of our Articles of Incorporation would be void and have no force or effect.
Following this offering and the expiration of applicable lock-up periods describe above, and subject to applicable securities laws, including Rule 144, sales of substantial amounts of our common stock, or the perception that such sales could occur, could adversely affect the prevailing market prices for our common stock. If these sales occur, it could impair our ability to raise additional capital through the sale of equity securities should we desire to do so. We cannot predict what effect, if any, future sales of securities, or the availability of securities for future sales, will have on the market price of our common stock prevailing from time to time. See “Shares Eligible for Future Sale” for more information.
Investors in this offering may experience immediate dilution upon the closing of the offering.
If you purchase shares of our common stock in this offering, you may experience immediate dilution if the price that you pay is greater than the pro forma NAV per share of the common stock you acquire. Investors in this offering could pay a price per share of common stock that exceeds the NAV per share after the closing of the offering. At the public offering price of $15.53 per share, purchasers in this offering will experience immediate dilution of approximately $0.15 per share. See “Dilution.”
Our stockholders may experience dilution in their ownership percentage.
Our stockholders do not have preemptive rights to purchase any shares of our common stock we issue in the future. To the extent that we issue additional equity interests at or below NAV your percentage ownership interest in us may be diluted. In addition, depending upon the terms and pricing of any future sales of common stock and the value of our investments, you may also experience dilution in the NAV and fair value of your shares of common stock.
Under the 1940 Act, we generally are prohibited from issuing or selling shares of our common stock at a price below NAV per share, which may be a disadvantage as compared with certain public companies. We may, however, sell shares of our common stock, or warrants, options, or rights to acquire shares of our Common Stock, at a price below the current NAV of shares of our common stock if our board of directors determines that such sale is in our best interests and the best interests of our stockholders, and our stockholders, including a majority of those stockholders that are not affiliated with us, approve such sale. In any such case, the price at which our securities are to be issued and sold may not be less than a price that, in the determination of our board of directors, closely approximates the fair value of such securities (less any distributing commission or discount). At a special meeting of stockholders held on December 11, 2024, our stockholders authorized us, subject to approval of our board of directors, to sell or otherwise issue shares of our common stock during the next year at a price below our NAV per share, subject to certain conditions. The authorization is effective until December 11, 2025.
If we raise additional funds by issuing shares of our common stock or senior securities convertible into, or exchangeable for, shares of our common stock, then the percentage ownership of our stockholders at that time will decrease and you will experience dilution.
We may use proceeds of this offering in a way with which you may not agree.
We will have significant flexibility in applying the proceeds of this offering and may use the net proceeds from this offering in ways with which you may not agree, or for purposes other than those contemplated at the time of this offering. We will also pay operating expenses, and may pay other expenses such as due diligence expenses of potential new investments, from the net proceeds of this offering. Our ability to achieve our investment objectives may be limited to the extent that net proceeds of this offering, pending full investment, are used to pay expenses rather than to make investments.
Provisions of the Maryland General Corporation Law and our articles of incorporation and bylaws could deter takeover attempts and have an adverse impact on the price of our common stock.
The Maryland General Corporation Law and our Articles of Incorporation and bylaws contain provisions that may have the effect of discouraging, delaying or making difficult a change in control of our company or the removal of our incumbent directors. The existence of these provisions, among others, may have a negative impact on the price of our common stock and may discourage third-party bids for ownership of our company. These provisions may prevent any premiums being offered to you for our common stock.
We may in the future determine to issue preferred stock, which could adversely affect the value of our common stock.
The issuance of shares of preferred stock with dividend or conversion rights, liquidation preferences or other economic terms favorable to the holders of preferred stock could adversely affect the value for our common stock by making an investment in the common stock less attractive. In addition, the dividends on any preferred stock we issue must be cumulative. Payment of dividends and repayment of the liquidation preference of preferred stock must take preference over any dividends or other payments to our common stockholders, and holders of preferred stock are not subject to any of our expenses or losses and are not entitled to participate in any income or appreciation in excess of their stated preference (other than convertible preferred stock that converts into common stock). In addition, under the 1940 Act, preferred stock constitutes a “senior security” for purposes of the asset coverage test.
FEDERAL INCOME TAX RISKS
We will be subject to corporate-level U.S. federal income tax if we are unable to qualify as a RIC under Subchapter M of the Code.
To maintain RIC tax treatment under the Code, we must meet the following annual distribution, income source and asset diversification requirements:
•The annual distribution requirement (the “Annual Distribution Requirement”) for a RIC will be satisfied if we distribute to our stockholders on an annual basis at least 90% of our net ordinary taxable income and realized net short-term capital gains in excess of realized net long-term capital losses, if any. Depending on the level of taxable income earned in a tax year, we may choose to carry forward taxable income in excess of current year distributions into the next tax year and pay a 4% U.S. federal excise tax on such income. Any such carryover taxable income must be distributed through a dividend declared prior to the later of (i) filing the final tax return related to the year which generated such taxable income or (ii) the fifteenth day of the ninth month following the close of the year which generated such taxable income. Because we use debt financing, we are subject to certain asset coverage ratio requirements under the 1940 Act and are (and may in the future become) subject to certain financial covenants under loan and credit agreements that could, under certain circumstances, restrict us from making distributions necessary to satisfy the distribution requirement. In addition, because we receive non-cash sources of income such as PIK interest which involves us recognizing taxable income without receiving the cash representing such income, we may have difficulty meeting the distribution requirement. If we are unable to obtain cash from other sources, we could fail to qualify for RIC tax treatment and thus become subject to corporate-level U.S. federal income tax.
•The source-of-income requirement will be satisfied if we obtain at least 90% of our gross income for each year from dividends, interest, gains from the sale of stock or securities or similar sources.
•The asset diversification requirement will be satisfied if we meet certain asset diversification requirements at the end of each quarter of our taxable year. To satisfy this requirement, at least 50% of the value of our assets must consist of cash, cash equivalents, U.S. government securities, securities of other RICs, and other acceptable securities; and no more than 25% of the value of our assets can be invested in the securities, other than U.S. government securities or securities of other RICs, (i) of one issuer, (ii) of two or more issuers that are controlled, as determined under applicable Code rules, by us and that are engaged in the same or similar or related trades or businesses or (iii) of certain “qualified publicly traded partnerships.”
Failure to meet these requirements may result in our having to dispose of certain investments quickly in order to prevent the loss of RIC status. Because most of our investments are in privately held companies, and therefore illiquid, any such dispositions could be made at disadvantageous prices and could result in substantial losses. Moreover, if we fail to maintain RIC tax treatment for any reason and are subject to corporate income tax, the resulting corporate taxes could substantially reduce our net assets, the amount of income available for distribution and the amount of our distributions.
We may have difficulty paying the distributions required to maintain RIC tax treatment under the Code if we recognize income before or without receiving cash representing such income.
We will include in income certain amounts that we have not yet received in cash, such as: (i) amortization of original issue discount, which may arise if we receive warrants in connection with the origination of a loan such that ascribing a value to the warrants creates original issue discount in the debt instrument, if we invest in a debt investment at a discount to the par value of the debt security or possibly in other circumstances; (ii) contractual PIK interest, which represents contractual interest added to the loan balance and due at the end of the loan term; (iii) contractual preferred dividends, which represents contractual dividends added to the preferred stock and due at the end of the preferred stock term, subject to adequate profitability at the portfolio company; or (iv) amortization of market discount, which is associated with loans purchased in the secondary market at a discount to par value. Such amortization of original issue discounts, increases in loan balances as a result of contractual PIK arrangements, cumulative preferred dividends, or amortization of market discount will be included in income before we receive the corresponding cash payments. We also may be required to include in income certain other amounts before we receive such amounts in cash. Investments structured with these features may represent a higher level of credit risk compared to investments generating income which must be paid in cash on a current basis.
Since, in certain cases, we may recognize taxable income before or without receiving cash representing such income, we may have difficulty meeting the Annual Distribution Requirement necessary to maintain RIC tax treatment under the Code. Accordingly, we may have to sell some of our investments at times and/or at prices we would not consider advantageous, raise additional debt or equity capital or forgo new investment opportunities for this purpose. If we are not able to obtain cash from other sources, we may fail to qualify for RIC tax treatment and thus become subject to corporate-level U.S. federal income tax.
We may in the future choose to pay dividends in our own stock, in which case you may be required to pay tax in excess of the cash you receive.
We may distribute taxable dividends that are payable in part in our stock. Under certain applicable provisions of the Code and the U.S. Department of Treasury (“Treasury”) regulations, distributions payable by us in cash or in shares of stock (at the stockholders’ election) would satisfy the Annual Distribution Requirement. The IRS has issued guidance providing that a dividend payable in stock or in cash at the election of the stockholders will be treated as a taxable dividend eligible for the dividends paid deduction provided at least 20% of the total distribution is payable in cash and certain other requirements are satisfied. According to this guidance, if too many stockholders elect to receive their distributions in cash, each such stockholder would receive a pro rata share of the total cash to be distributed and would receive the remainder of their distribution in shares of stock. Taxable stockholders receiving such dividends will be required to include the full amount of the dividend as ordinary income (or as long-term capital gain to the extent such dividend is properly reported as a capital gain dividend) to the extent of our current and accumulated earnings and profits for U.S. federal income tax purposes. As a result, a U.S. stockholder may be required to pay tax with respect to such dividends in excess of any cash received. If a U.S. stockholder sells the stock it receives as a dividend in order to pay this tax, the sales proceeds may be less than the amount included in income with respect to the dividend, depending on the market price of our stock at the time of the sale. Furthermore, with respect to non-U.S. stockholders, we may be required to withhold U.S. tax with respect to such dividends, including in respect of all or a portion of such dividend that is payable in stock. In addition, if a significant number of our stockholders determine to sell shares of our stock in order to pay taxes owed on dividends, it may put downward pressure on the trading price of our stock.
Stockholders may have current tax liability on dividends they elect to reinvest in our common stock but would not receive cash from such dividends to pay such tax liability.
If stockholders participate in our DRIP, they will be deemed to have received, and for federal income tax purposes will be taxed on, the amount reinvested in our common stock to the extent the amount reinvested was not a tax-free return of capital. As a result, unless a stockholder is a tax-exempt entity, it may have to use funds from other sources to pay its tax liability on the value of the dividend that they have elected to have reinvested in our common stock.
Legislative or regulatory tax changes could adversely affect our stockholders.
At any time, the federal income tax laws governing RICs or the administrative interpretations of those laws or regulations may be amended. Any new laws, regulations or interpretations may take effect retroactively and could adversely affect the taxation of us or our stockholders. Therefore, changes in tax laws, regulations or administrative interpretations or any amendments thereto could diminish the value of an investment in our shares or the value or the resale potential of our investments. If we do not comply with applicable laws and regulations, we could lose any licenses that we then hold for the conduct of our business and may be subject to civil fines and criminal penalties.
GENERAL RISK FACTORS
Events outside of our control, including public health crises, supply chain disruptions and inflation, could negatively affect our portfolio companies and the results of our operations.
Periods of market volatility could occur in response to pandemics or other events outside of our control. We and the portfolio companies in which we invest in could be affected by force majeure events (i.e., events beyond the control of the party claiming that the event has occurred, such as acts of God, fire, flood, earthquakes, outbreaks of an infectious disease, pandemic or any other serious public health concern, war, terrorism, labor strikes, major plant breakdowns, pipeline or electricity line ruptures, failure of technology, defective design and construction, accidents, demographic changes, government macroeconomic policies, social instability, etc.). Some force majeure events could adversely affect the ability of a party (including us, a portfolio company or a counterparty to us) to perform its obligations until it is able to remedy the force majeure event. In addition, force majeure events, such as the cessation of the operation of equipment for repair or upgrade, could similarly lead to the unavailability of essential equipment and technologies. These risks could, among other effects, adversely impact the cash flows available from a portfolio company, cause personal injury or loss of life, including to an officer, director or a member of our investment team, damage property, or instigate disruptions of service. In addition, the cost to a portfolio company or us of repairing or replacing damaged assets resulting from such force majeure event could be considerable.
It will not be possible to insure against all such events, and insurance proceeds received, if any, could be inadequate to completely or even partially cover any loss of revenues or investments, any increases in operating and maintenance expenses, or any replacements or rehabilitation of property. Certain events causing catastrophic loss could be either uninsurable, or insurable at such high rates as to adversely impact us or portfolio companies, as applicable. Force majeure events that are incapable of or are too costly to cure could have permanent adverse effects. Certain force majeure events (such as war or an outbreak of an infectious disease) could have a broader negative impact on the world economy and international business activity generally, or in any of the countries in which we invest or our portfolio companies operate specifically. Such force majeure events could result in or coincide with: increased volatility in the global securities, derivatives and currency markets; a decrease in the reliability of market prices and difficulty in valuing assets; greater fluctuations in currency exchange rates; increased risk of default (by both government and private issuers); further social, economic, and political instability; nationalization of private enterprise; greater governmental involvement in the economy or in social factors that impact the economy; less governmental regulation and supervision of the securities markets and market participants and decreased monitoring of the markets by governments or self-regulatory organizations and reduced enforcement of regulations; limited, or limitations on, the activities of investors in such markets; controls or restrictions on foreign investment, capital controls and limitations on repatriation of invested capital; inability to purchase and sell investments or otherwise settle security or derivative transactions (i.e., a market freeze); unavailability of currency hedging techniques; substantial, and in some periods extremely high, rates of inflation, which can last many years and have substantial negative effects on credit and securities markets as well as the economy as a whole; recessions; and difficulties in obtaining and/or enforcing legal judgments.
Market conditions may materially and adversely affect debt and equity capital markets in the United States and abroad, which may have a negative impact on our business and operations.
The success of our activities is affected by general economic and market conditions, including, among others, interest rates, availability of credit, inflation rates, economic uncertainty, changes in laws, and trade barriers. These factors could affect the level and volatility of securities prices and the liquidity of our investments. Volatility or illiquidity could impair our profitability or result in losses. These factors also could adversely affect the availability or cost of our leverage, which would result in lower returns.
These disruptions in the capital markets could increase the spread between the yields realized on risk-free and higher risk securities, resulting in illiquidity in parts of the capital markets. Such disruptions could adversely affect our business, financial condition, results of operations and cash flows, and future market disruptions and/or illiquidity could negatively impact us. These unfavorable economic conditions could increase our funding costs and limit our access to the capital markets, and could result in a decision by lenders not to extend credit to us in the future. These events could limit our investments, our ability to grow and could negatively impact our operating results and the fair values of our debt and equity investments.
Failure to comply with applicable laws or regulations and changes in laws or regulations governing our operations may adversely affect our business or cause us to alter our business strategy.
We, our Adviser, and our portfolio companies are subject to applicable local, state and federal laws and regulations. Failure to comply with any applicable local, state or federal law or regulation could negatively impact our reputation and our business results. New legislation may also be enacted or new interpretations, rulings or regulations could be adopted, including those governing the types of investments we are permitted to make, any of which could harm us and our stockholders, potentially with retroactive effect. Additionally, any changes to the laws and regulations governing our operations relating to permitted investments may cause us to alter our investment strategy in order to avail ourselves of new or different opportunities. Such changes could result in material differences to the strategies and plans set forth herein and may result in our investment focus shifting from the areas of expertise of our investment team to other types of investments in which our investment team may have less expertise or little or no experience. Thus, any such changes, if they occur, could have a material adverse effect on our results of operations and the value of your investment.
We may experience fluctuations in our operating results.
We could experience fluctuations in our operating results due to a number of factors, including our ability or inability to make investments in companies that meet our investment criteria, the interest rate payable on the debt securities we acquire, the level of portfolio dividend and fee income, the level of our expenses, variations in and the timing of the recognition of realized and unrealized gains or losses, the degree to which we encounter competition in our markets and general economic conditions. As a result of these factors, operating results for any period should not be relied upon as being indicative of performance in future periods.
Technological innovations and industry disruptions may negatively impact us.
Technological innovations have disrupted traditional approaches in multiple industries and can permit younger companies to achieve success and in the process disrupt markets and market practices. We can provide no assurance that new businesses and approaches will not be created that would compete with us and/or our portfolio companies or alter the market practices in which we have been designed to function within and on which we depend on for our investment return. New approaches could damage our investments, disrupt the market in which we operate and subject us to increased competition, which could materially and adversely affect our business, financial condition and results of investments.
We are highly dependent on information systems and systems failures could significantly disrupt our business, which may, in turn, negatively affect the market price of our common stock and our ability to pay dividends.
Our business is highly dependent on our and third parties’ communications and information systems. Any failure or interruption of those systems, including as a result of the termination of an agreement with any third-party service providers, could cause delays or other problems in our activities. Our and our Adviser’s financial, accounting, data processing, backup or other operating systems and facilities may fail to operate properly or become disabled or damaged as a result of a number of factors including events that are wholly or partially beyond our control and adversely affect our business. There could be:
•sudden electrical or telecommunications outages;
•natural disasters such as earthquakes, tornadoes and hurricanes;
•disease pandemics;
•events arising from local or larger scale political or social matters, including terrorist acts; and
•cyber-attacks, including software viruses, ransomware, malware and phishing and vishing schemes.
The failure in cybersecurity systems, as well as the occurrence of events unanticipated in our and our Adviser’s disaster recovery systems and management continuity planning could impair our ability to conduct business effectively.
The occurrence of a disaster such as a cyber-attack, a natural catastrophe, an industrial accident, a terrorist attack or war, events unanticipated in our and our Adviser’s disaster recovery systems, or a support failure from external providers, could have an adverse effect on our ability to conduct business and on our results of operations and financial condition, particularly if those events affect our computer-based data processing, transmission, storage, and retrieval systems or destroy data. If a significant number of our managers were unavailable in the event of a disaster, our ability to effectively conduct our business could be severely compromised.
We depend heavily upon computer systems to perform necessary business functions. Despite our implementation of a variety of security measures, our and our Adviser’s computer systems could be subject to cyber-attacks and unauthorized access, such as physical and electronic break-ins or unauthorized tampering. Like other companies, we may experience threats to our data and systems, including malware and computer virus attacks, unauthorized access, system failures and disruptions. If one or more of these events occurs, it could potentially jeopardize the confidential, proprietary and other information processed and stored in, and transmitted through, our computer systems and networks, or otherwise cause interruptions or malfunctions in our operations, which could result in damage to our reputation, financial losses, litigation, increased costs, regulatory penalties and/or customer dissatisfaction or loss.
Third parties with which we do business (including, but not limited to, service providers, such as accountants, custodians, transfer agents and administrators, and the issuers of securities in which we invest) may also be sources or targets of cybersecurity or other technological risks. While we engage in actions to reduce our exposure resulting from outsourcing, we cannot control the cybersecurity plans and systems put in place by these third parties and ongoing threats may result in unauthorized access, loss, exposure or destruction of data, or other cybersecurity incidents, with increased costs and other consequences, including those described above. Privacy and information security laws and regulation changes, and compliance with those changes, may also result in cost increases due to system changes and the development of new administrative processes.
CAUTIONARY STATEMENT CONCERNING FORWARD-LOOKING STATEMENTS
This prospectus contains forward-looking statements, including statements regarding our future financial condition, business strategy, and plans and objectives of management for future operations. All statements other than statements of historical facts, including statements regarding our future results of operations or financial condition, business strategy and plans, and objectives of management for future operations, are forward-looking statements. The forward-looking statements contained in this prospectus may include statements as to:
•our future operating results and dividend projections;
•our business prospects and the prospects of our portfolio companies;
•the impact of the investments that we expect to make;
•the ability of our portfolio companies to achieve their objectives;
•our expected financings and investments;
•the adequacy of our cash resources and working capital; and
•the timing of cash flows, if any, from the operations of our portfolio companies.
In some cases, you can identify forward-looking statements because they contain words such as “anticipate,” “believe,” “contemplate,” “continue,” “could,” “estimate,” “expect,” “intend,” “may,” “plan,” “potential,” “predict,” “project,” “should,” “target,” “will,” or “would” or the negative of these words or other similar terms or expressions, although not all forward-looking statements include these words or expressions. The forward-looking statements contained in this prospectus involve risks and uncertainties. Our actual results could differ materially from those implied or expressed in the forward-looking statements for any reason, including the factors set forth in “Risk Factors” in this prospectus supplement. Other factors that could cause actual results to differ materially include:
•uncertainty and changes in the general interest rate environment, including as a result of recent rate increases by the Federal Reserve;
•changes in the economy, political and industry trends and other external factors, including uncertainty surrounding the financial and political stability of the United States and other countries;
•the effect of an inflationary economic environment on our portfolio companies, our financial condition and our results of operations;
•the impact of interruptions in the supply chain on our portfolio companies;
•the ability of our portfolio companies to achieve their objectives;
•the adequacy of our financing sources and working capital;
•the ability of our Adviser to locate suitable investments for us and to monitor and administer our investments;
•the ability of our Adviser and its affiliates to attract and retain highly talented professionals;
•our ability to maintain our qualification as a BDC, and as a RIC under the Code;
•risks associated with possible disruption in our operations or the economy generally due to disease pandemic, acts of war, terrorist acts, cyberattacks or natural disasters; and
•future changes in laws or regulations and conditions in our operating areas.
We discuss in greater detail many of these risks and uncertainties in the sections titled “Risk Factors” in this prospectus. In addition, statements that we “believe” and similar statements reflect our beliefs and opinions on the relevant subject. These statements are based on information available to us as of the applicable date of this prospectus, and while we believe such information forms a reasonable basis for such statements, such information may be limited or incomplete, and our statements should not be read to indicate that we have conducted an exhaustive inquiry into, or review of, all potentially available relevant information. These statements are inherently uncertain and investors are cautioned not to unduly rely on these statements.
USE OF PROCEEDS
We estimate that the net proceeds we will receive from the sale of shares of our common stock in this offering will be approximately $78.6 million (or approximately $90.6 million if the underwriters exercise in full their option to purchase additional shares of our common stock), based on the offering price of $15.53 per share, after deducting the underwriting discounts and commissions paid by us and including estimated offering expenses of approximately $2.0 million payable by us. Such estimate assumes the sale of all of the Main Street Indicative Commitment Shares and that no shares are sold pursuant to the directed share program described elsewhere in this prospectus. In addition, such estimate is subject to change and no assurances can be given that actual expenses will not exceed such amount.
We intend to initially use all of the net proceeds from this offering to repay outstanding debt borrowed under our Credit Facilities. However, through re-borrowing of the initial repayments under our Credit Facilities, we intend to make investments in accordance with our investment objective and strategies described in this prospectus and pay our operating expenses and other cash obligations. We also intend to use such re-borrowings for general corporate purposes. Based on prevailing market conditions, we expect to invest the net proceeds from this offering within six months. The precise timing will depend on the availability of investment opportunities that are consistent with our investment objectives and strategies.
Our ability to achieve our investment objective may be limited to the extent that the net proceeds from this offering, pending full investment, are held in interest bearing deposits or other short-term instruments.
On January 17, 2025, we had approximately $131.0 million outstanding under our Corporate Facility. Our Corporate Facility matures in May 2029, unless extended, and bears interest, at our election, on a per annum basis at a rate equal to (i) SOFR plus 2.05% or (ii) the base rate plus 1.05%. The base rate is defined as the higher of (a) the Prime rate, (b) the Federal Funds Rate (as defined in the credit agreement) plus 0.5% or (c) SOFR plus 1.1%. Amounts repaid under our Corporate Facility will remain available for future borrowings.
On January 17, 2025, we had approximately $262.7 million outstanding under our SPV Facility. Our SPV Facility matures in February 2028, unless extended, and bears interest at a per annum rate equal to the three-month SOFR in effect, plus the applicable margin of 3.00%. Amounts repaid under our SPV Facility will remain available for future borrowings.
Affiliates of certain underwriters are lenders under our Credit Facilities. As described above, we may use net proceeds of this offering to repay a portion of the outstanding indebtedness under our Credit Facilities. Certain of the net proceeds from the sale of the common stock, not including underwriting compensation, may be paid to affiliates of certain underwriters in connection with the repayment of debt owed under our Credit Facilities. As a result, certain underwriters and/or their affiliates may receive more than 5% of the net proceeds of this offering, not including underwriting compensation. See “Underwriting — Conflicts of Interest” below.
DISTRIBUTIONS
To the extent that we have income available, we intend to make quarterly distributions to our stockholders. Our quarterly distributions, if any, will be determined by our board of directors. Any distributions to our stockholders will be declared out of assets legally available for distribution.
We have elected to be treated, and intend to operate in a manner so as to continuously qualify, as a RIC under Subchapter M of the Code. To obtain and maintain RIC tax treatment, among other things, we must distribute to our stockholders in respect of each taxable year at least 90% of the sum of our net ordinary income and net short-term capital gains in excess of our net long-term capital losses (“investment company taxable income”), determined without regard to any deduction for dividends paid. In order to avoid certain excise taxes imposed on RICs, we currently intend to distribute to our stockholders in respect of each calendar year an amount at least equal to the sum of: (1) 98% of our net ordinary income (taking into account certain deferrals and elections) for such calendar year; (2) 98.2% of our capital gains in excess of capital losses (“capital gain net income”), adjusted for certain ordinary losses, generally for the one-year period ending December 31 of such calendar year; and (3) any net ordinary income and capital gain net income for preceding years that were not distributed during such years and on which we previously paid no U.S. federal income tax. Under certain applicable provisions of the Code and Treasury regulations, distributions payable in cash or in shares of stock at the election of the stockholders are treated as taxable dividends. The IRS has published guidance in the context of publicly offered RICs indicating that this rule will apply even where the total amount of cash that may be distributed is limited to no more than 20% of the total distribution. Under this guidance, if too many stockholders elect to receive their distributions in cash, the cash available for distribution must be allocated among the stockholders electing to receive cash (with the balance of the distribution paid in stock). If we decide to make any distributions consistent with this guidance that are payable in part in stock, taxable stockholders receiving such distributions will be required to include the full amount of the distribution (whether received in cash, shares of our stock, or a combination thereof) as ordinary income (or as long-term capital gain to the extent such distribution is properly reported as a capital gain distribution) to the extent of our current and accumulated earnings and profits for U.S. federal income tax purposes. As a result, a U.S. stockholder may be required to pay tax with respect to such distributions in excess of any cash received. If a U.S. stockholder sells the stock it receives in order to pay this tax, the sales proceeds may be less than the amount included in income with respect to the distribution, depending on the value of our stock at the time of the sale. Furthermore, with respect to non-U.S. stockholders, the Company may be required to withhold U.S. tax with respect to such distributions, including in respect of all or a portion of such distribution that is payable in stock.
For these excise tax purposes, we will be deemed to have distributed any net ordinary taxable income or capital gain net income on which we have paid U.S. federal income tax. Depending on the level of taxable income earned in a calendar year, we may choose to carry forward taxable income for distribution in the following calendar year, and pay any applicable U.S. federal excise tax. We cannot assure you that we will achieve results that will permit the payment of cash distributions.
We currently intend to distribute net capital gains (i.e., net long-term capital gains in excess of net short-term capital losses), if any, at least annually out of the assets legally available for such distributions. However, we may decide in the future to retain such capital gains for investment, incur a corporate-level tax on such capital gains, and elect to treat such capital gains as deemed distributions to you. If this happens, you will be treated for U.S. federal income tax purposes as if you had received an actual distribution of the capital gains that we retain and reinvested the net after tax proceeds in us. In this situation, you would be eligible to claim a tax credit equal to your allocable share of the tax we paid on the capital gains deemed distributed to you. We cannot assure you that we will achieve results that will permit us to pay any cash distributions, and if we issue senior securities, we will be prohibited from making distributions if doing so would cause us to fail to maintain the asset coverage ratios stipulated by the 1940 Act or if such distributions are limited by the terms of any of our borrowings.
We have adopted a DRIP, which will become effective as of the date of our board of directors’ first declaration of a dividend or distribution on our common stock following a Listing, that will provide for reinvestment of our distributions on behalf of our stockholders, unless a stockholder elects to receive cash. As a result, if our board of directors authorizes, and we declare, a cash distribution, then stockholders who do not “opt out” of our DRIP will have their cash distributions automatically reinvested in additional shares of our common stock, rather than receiving cash distributions.
The following table summarizes our distributions declared and payable since inception through September 30, 2024 (without giving effect to the Reverse Stock Split):
| | | | | | | | | | | | | | | | | | | | | | | | | | |
| Date Declared | | Record Date | | Date Payable | | Per Share Amount (1) | | Type |
| | | | | | | | |
| 5/14/2024 | | 6/28/2024 | | 8/1/2024 | | $ | 0.180 | | | U.S. Currency |
| 3/8/2024 | | 3/29/2024 | | 5/1/2024 | | 0.185 | | U.S. Currency |
| | | | | | | | | | | | | | | | | | | | | | | | | | |
| Date Declared | | Record Date | | Date Payable | | Per Share Amount (1) | | Type |
| 11/13/2023 | | 12/29/2023 | | 1/31/2024 | | 0.175 | | | U.S. Currency |
| 8/10/2023 | | 9/29/2023 | | 11/1/2023 | | 0.175 | | | U.S. Currency |
| 5/11/2023 | | 6/30/2023 | | 8/1/2023 | | 0.175 | | | U.S. Currency |
| 3/10/2023 | | 3/31/2023 | | 5/1/2023 | | 0.175 | | | U.S. Currency |
| 11/10/2022 | | 12/30/2022 | | 1/31/2023 | | 0.160 | | | U.S. Currency |
| 8/11/2022 | | 9/30/2022 | | 11/1/2022 | | 0.160 | | | U.S. Currency |
| 5/12/2022 | | 6/30/2022 | | 8/1/2022 | | 0.160 | | | U.S. Currency |
| 3/10/2022 | | 3/31/2022 | | 5/2/2022 | | 0.165 | | | U.S. Currency |
| 11/11/2021 | | 12/31/2021 | | 2/1/2022 | | 0.150 | | | U.S. Currency |
| 8/10/2021 | | 9/30/2021 | | 11/1/2021 | | 0.150 | | | U.S. Currency |
| 5/11/2021 | | 6/30/2021 | | 8/2/2021 | | 0.125 | | | U.S. Currency |
| 3/2/2021 | | 3/31/2021 | | 4/1/2021 | | 0.100 | | | U.S. Currency |
| 3/4/2020 | | 6/30/2020 | | 7/1/2020 | | 0.058 | | | U.S. Currency |
| 3/4/2020 | | 5/29/2020 | | 6/1/2020 | | 0.059 | | | U.S. Currency |
| 3/4/2020 | | 4/30/2020 | | 5/1/2020 | | 0.058 | | | U.S. Currency |
| 12/12/2019 | | 3/31/2020 | | 4/1/2020 | | 0.059 | | | U.S. Currency |
| 12/12/2019 | | 2/28/2020 | | 3/2/2020 | | 0.056 | | | U.S. Currency |
| 12/12/2019 | | 1/31/2020 | | 2/4/2020 | | 0.059 | | | U.S. Currency |
| 9/9/2019 | | 12/31/2019 | | 1/3/2020 | | 0.059 | | | U.S. Currency |
| 9/9/2019 | | 11/29/2019 | | 12/3/2019 | | 0.058 | | | U.S. Currency |
| 9/9/2019 | | 10/31/2019 | | 11/1/2019 | | 0.059 | | | U.S. Currency |
| 6/25/2019 | | 9/30/2019 | | 10/1/2019 | | 0.058 | | | U.S. Currency |
| 6/25/2019 | | 8/30/2019 | | 9/3/2019 | | 0.059 | | | U.S. Currency |
| 6/25/2019 | | 7/31/2019 | | 8/1/2019 | | 0.059 | | | U.S. Currency |
| 3/26/2019 | | 6/28/2019 | | 7/1/2019 | | 0.058 | | | U.S. Currency |
| 3/26/2019 | | 5/31/2019 | | 6/3/2019 | | 0.059 | | | U.S. Currency |
| 3/26/2019 | | 4/30/2019 | | 5/1/2019 | | 0.058 | | | U.S. Currency |
| 12/13/2018 | | 3/29/2019 | | 4/1/2019 | | 0.059 | | | U.S. Currency |
| 12/13/2018 | | 2/28/2019 | | 3/1/2019 | | 0.054 | | | U.S. Currency |
| 12/13/2018 | | 1/31/2019 | | 2/1/2019 | | 0.059 | | | U.S. Currency |
| 9/14/2018 | | 12/31/2018 | | 1/2/2019 | | 0.059 | | | U.S. Currency |
| 9/14/2018 | | 11/30/2018 | | 12/3/2018 | | 0.058 | | | U.S. Currency |
| 9/14/2018 | | 10/31/2018 | | 11/1/2018 | | 0.059 | | | U.S. Currency |
| 6/21/2018 | | 9/28/2018 | | 10/1/2018 | | 0.058 | | | U.S. Currency |
| 6/21/2018 | | 8/31/2018 | | 9/4/2018 | | 0.059 | | | U.S. Currency |
| 6/21/2018 | | 7/31/2018 | | 8/1/2018 | | 0.059 | | | U.S. Currency |
| 3/22/2018 | | 6/29/2018 | | 7/2/2018 | | 0.058 | | | U.S. Currency |
| 3/22/2018 | | 5/31/2018 | | 6/1/2018 | | 0.059 | | | U.S. Currency |
| 3/22/2018 | | 4/30/2018 | | 5/1/2018 | | 0.058 | | | U.S. Currency |
| 12/14/2017 | | 3/29/2018 | | 4/2/2018 | | 0.059 | | | U.S. Currency |
| 12/14/2017 | | 2/28/2018 | | 3/1/2018 | | 0.054 | | | U.S. Currency |
| 12/14/2017 | | 1/31/2018 | | 2/1/2018 | | 0.059 | | | U.S. Currency |
| 9/14/2017 | | 12/29/2017 | | 1/2/2018 | | 0.059 | | | U.S. Currency |
| 9/14/2017 | | 11/30/2017 | | 12/1/2017 | | 0.058 | | | U.S. Currency |
| 9/14/2017 | | 10/31/2017 | | 11/1/2017 | | 0.059 | | | U.S. Currency |
| 6/26/2017 | | 9/29/2017 | | 10/2/2017 | | 0.058 | | | U.S. Currency |
| 6/26/2017 | | 8/31/2017 | | 9/1/2017 | | 0.059 | | | U.S. Currency |
| 6/26/2017 | | 7/31/2017 | | 8/1/2017 | | 0.059 | | | U.S. Currency |
| 3/23/2017 | | 6/30/2017 | | 7/3/2017 | | 0.058 | | | U.S. Currency |
| 3/23/2017 | | 5/31/2017 | | 6/1/2017 | | 0.059 | | | U.S. Currency |
| 3/23/2017 | | 4/28/2017 | | 5/1/2017 | | 0.058 | | | U.S. Currency |
| | | | | | | | | | | | | | | | | | | | | | | | | | |
| Date Declared | | Record Date | | Date Payable | | Per Share Amount (1) | | Type |
| 12/15/2016 | | 3/31/2017 | | 4/3/2017 | | 0.059 | | | U.S. Currency |
| 12/15/2016 | | 2/28/2017 | | 3/1/2017 | | 0.054 | | | U.S. Currency |
| 12/15/2016 | | 1/31/2017 | | 2/1/2017 | | 0.059 | | | U.S. Currency |
| 9/14/2016 | | 12/30/2016 | | 1/3/2017 | | 0.059 | | | U.S. Currency |
| 9/14/2016 | | 11/30/2016 | | 12/1/2016 | | 0.058 | | | U.S. Currency |
| 9/14/2016 | | 10/31/2016 | | 11/1/2016 | | 0.059 | | | U.S. Currency |
| 6/23/2016 | | 9/30/2016 | | 10/3/2016 | | 0.058 | | | U.S. Currency |
| 6/23/2016 | | 8/31/2016 | | 9/1/2016 | | 0.059 | | | U.S. Currency |
| 6/23/2016 | | 7/29/2016 | | 8/1/2016 | | 0.059 | | | U.S. Currency |
| 3/23/2016 | | 6/30/2016 | | 7/1/2016 | | 0.058 | | | U.S. Currency |
| 3/23/2016 | | 5/31/2016 | | 6/1/2016 | | 0.059 | | | U.S. Currency |
| 3/23/2016 | | 4/29/2016 | | 5/2/2016 | | 0.058 | | | U.S. Currency |
| 12/17/2015 | | 3/31/2016 | | 4/1/2016 | | 0.059 | | | U.S. Currency |
| 12/17/2015 | | 2/29/2016 | | 3/1/2016 | | 0.056 | | | U.S. Currency |
| 12/17/2015 | | 1/29/2016 | | 2/1/2016 | | 0.059 | | | U.S. Currency |
| 9/23/2015 | | 12/31/2015 | | 1/4/2016 | | 0.059 | | | U.S. Currency |
| 9/23/2015 | | 11/30/2015 | | 12/1/2015 | | 0.058 | | | U.S. Currency |
| 9/23/2015 | | 10/30/2015 | | 11/2/2015 | | 0.059 | | | U.S. Currency |
| 6/25/2015 | | 9/30/2015 | | 10/1/2015 | | 0.058 | | | U.S. Currency |
| 6/25/2015 | | 8/31/2015 | | 9/1/2015 | | 0.059 | | | U.S. Currency |
| 6/25/2015 | | 7/31/2015 | | 8/3/2015 | | 0.059 | | | U.S. Currency |
| 3/24/2015 | | 6/30/2015 | | 7/1/2015 | | 0.058 | | | U.S. Currency |
| 3/24/2015 | | 5/29/2015 | | 6/1/2015 | | 0.059 | | | U.S. Currency |
| 3/24/2015 | | 4/30/2015 | | 5/1/2015 | | 0.058 | | | U.S. Currency |
| 12/18/2014 | | 3/31/2015 | | 4/1/2015 | | 0.059 | | | U.S. Currency |
| 12/18/2014 | | 2/27/2015 | | 3/2/2015 | | 0.054 | | | U.S. Currency |
| 12/18/2014 | | 1/30/2015 | | 2/2/2015 | | 0.059 | | | U.S. Currency |
| 9/22/2014 | | 12/31/2014 | | 1/5/2015 | | 0.059 | | | U.S. Currency |
| 9/22/2014 | | 11/28/2014 | | 12/1/2014 | | 0.058 | | | U.S. Currency |
| 9/22/2014 | | 10/31/2014 | | 11/3/2014 | | 0.059 | | | U.S. Currency |
| 6/24/2014 | | 9/30/2014 | | 10/1/2014 | | 0.058 | | | U.S. Currency |
| 6/24/2014 | | 8/29/2014 | | 9/2/2014 | | 0.059 | | | U.S. Currency |
| 6/24/2014 | | 7/31/2014 | | 8/1/2014 | | 0.059 | | | U.S. Currency |
| 3/25/2014 | | 6/30/2014 | | 7/1/2014 | | 0.058 | | | U.S. Currency |
| 3/25/2014 | | 5/30/2014 | | 6/2/2014 | | 0.059 | | | U.S. Currency |
| 3/25/2014 | | 4/30/2014 | | 5/1/2014 | | 0.058 | | | U.S. Currency |
| 12/19/2013 | | 3/31/2014 | | 4/1/2014 | | 0.059 | | | U.S. Currency |
| 12/19/2013 | | 2/28/2014 | | 3/3/2014 | | 0.054 | | | U.S. Currency |
| 12/19/2013 | | 1/31/2014 | | 2/3/2014 | | 0.059 | | | U.S. Currency |
| 9/27/2013 | | 12/31/2013 | | 1/2/2014 | | 0.059 | | | U.S. Currency |
| 9/27/2013 | | 11/29/2013 | | 12/2/2013 | | 0.058 | | | U.S. Currency |
| 9/27/2013 | | 10/31/2013 | | 11/1/2013 | | 0.059 | | | U.S. Currency |
| 6/27/2013 | | 9/30/2013 | | 10/1/2013 | | 0.058 | | | U.S. Currency |
| 6/27/2013 | | 8/30/2013 | | 9/3/2013 | | 0.059 | | | U.S. Currency |
| 6/27/2013 | | 7/31/2013 | | 8/1/2013 | | 0.059 | | | U.S. Currency |
| 3/25/2013 | | 6/28/2013 | | 7/1/2013 | | 0.058 | | | U.S. Currency |
| 3/25/2013 | | 5/31/2013 | | 6/3/2013 | | 0.059 | | | U.S. Currency |
| 3/25/2013 | | 4/30/2013 | | 5/1/2013 | | 0.058 | | | U.S. Currency |
| 12/18/2012 | | 3/28/2013 | | 4/1/2013 | | 0.059 | | | U.S. Currency |
| 12/18/2012 | | 2/28/2013 | | 3/1/2013 | | 0.054 | | | U.S. Currency |
| 12/18/2012 | | 1/31/2013 | | 2/1/2013 | | 0.059 | | | U.S. Currency |
| | | | | | | | | | | | | | | | | | | | | | | | | | |
| Date Declared | | Record Date | | Date Payable | | Per Share Amount (1) | | Type |
| 9/28/2012 | | 12/31/2012 | | 1/2/2013 | | 0.059 | | | U.S. Currency |
| 9/28/2012 | | 11/30/2012 | | 12/3/2012 | | 0.058 | | | U.S. Currency |
| 9/28/2012 | | 10/31/2012 | | 11/1/2012 | | 0.059 | | | U.S. Currency |
| 6/29/2012 | | 9/28/2012 | | 10/1/2012 | | 0.058 | | | U.S. Currency |
| 6/29/2012 | | 8/31/2012 | | 9/4/2012 | | 0.059 | | | U.S. Currency |
| 6/29/2012 | | 7/31/2012 | | 8/1/2012 | | 0.059 | | | U.S. Currency |
_____________________________
(1)Per share amounts through September 30, 2024 have not been adjusted to reflect the Reverse Stock Split effected on December 16, 2024.
The following table summarizes our distributions declared and payable since inception through September 30, 2024 (per share amounts have been adjusted to reflect the Reverse Stock Split effected on December 16, 2024, on a retrospective basis):
| | | | | | | | | | | | | | | | | | | | | | | | | | |
| Date Declared | | Record Date | | Date Payable | | Per Share Amount (1) | | Type |
| | | | | | | | |
| 5/14/2024 | | 6/28/2024 | | 8/1/2024 | | $ | 0.360 | | | U.S. Currency |
| 3/8/2024 | | 3/29/2024 | | 5/1/2024 | | 0.370 | | U.S. Currency |
| 11/13/2023 | | 12/29/2023 | | 1/31/2024 | | 0.350 | | | U.S. Currency |
| 8/10/2023 | | 9/29/2023 | | 11/1/2023 | | 0.350 | | | U.S. Currency |
| 5/11/2023 | | 6/30/2023 | | 8/1/2023 | | 0.350 | | | U.S. Currency |
| 3/10/2023 | | 3/31/2023 | | 5/1/2023 | | 0.350 | | | U.S. Currency |
| 11/10/2022 | | 12/30/2022 | | 1/31/2023 | | 0.320 | | | U.S. Currency |
| 8/11/2022 | | 9/30/2022 | | 11/1/2022 | | 0.320 | | | U.S. Currency |
| 5/12/2022 | | 6/30/2022 | | 8/1/2022 | | 0.320 | | | U.S. Currency |
| 3/10/2022 | | 3/31/2022 | | 5/2/2022 | | 0.330 | | | U.S. Currency |
| 11/11/2021 | | 12/31/2021 | | 2/1/2022 | | 0.300 | | | U.S. Currency |
| 8/10/2021 | | 9/30/2021 | | 11/1/2021 | | 0.300 | | | U.S. Currency |
| 5/11/2021 | | 6/30/2021 | | 8/2/2021 | | 0.250 | | | U.S. Currency |
| 3/2/2021 | | 3/31/2021 | | 4/1/2021 | | 0.200 | | | U.S. Currency |
| 3/4/2020 | | 6/30/2020 | | 7/1/2020 | | 0.115 | | | U.S. Currency |
| 3/4/2020 | | 5/29/2020 | | 6/1/2020 | | 0.119 | | | U.S. Currency |
| 3/4/2020 | | 4/30/2020 | | 5/1/2020 | | 0.115 | | | U.S. Currency |
| 12/12/2019 | | 3/31/2020 | | 4/1/2020 | | 0.119 | | | U.S. Currency |
| 12/12/2019 | | 2/28/2020 | | 3/2/2020 | | 0.111 | | | U.S. Currency |
| 12/12/2019 | | 1/31/2020 | | 2/4/2020 | | 0.119 | | | U.S. Currency |
| 9/9/2019 | | 12/31/2019 | | 1/3/2020 | | 0.119 | | | U.S. Currency |
| 9/9/2019 | | 11/29/2019 | | 12/3/2019 | | 0.115 | | | U.S. Currency |
| 9/9/2019 | | 10/31/2019 | | 11/1/2019 | | 0.119 | | | U.S. Currency |
| 6/25/2019 | | 9/30/2019 | | 10/1/2019 | | 0.115 | | | U.S. Currency |
| 6/25/2019 | | 8/30/2019 | | 9/3/2019 | | 0.119 | | | U.S. Currency |
| 6/25/2019 | | 7/31/2019 | | 8/1/2019 | | 0.119 | | | U.S. Currency |
| 3/26/2019 | | 6/28/2019 | | 7/1/2019 | | 0.115 | | | U.S. Currency |
| 3/26/2019 | | 5/31/2019 | | 6/3/2019 | | 0.119 | | | U.S. Currency |
| 3/26/2019 | | 4/30/2019 | | 5/1/2019 | | 0.115 | | | U.S. Currency |
| 12/13/2018 | | 3/29/2019 | | 4/1/2019 | | 0.119 | | | U.S. Currency |
| 12/13/2018 | | 2/28/2019 | | 3/1/2019 | | 0.107 | | | U.S. Currency |
| 12/13/2018 | | 1/31/2019 | | 2/1/2019 | | 0.119 | | | U.S. Currency |
| 9/14/2018 | | 12/31/2018 | | 1/2/2019 | | 0.119 | | | U.S. Currency |
| 9/14/2018 | | 11/30/2018 | | 12/3/2018 | | 0.115 | | | U.S. Currency |
| 9/14/2018 | | 10/31/2018 | | 11/1/2018 | | 0.119 | | | U.S. Currency |
| 6/21/2018 | | 9/28/2018 | | 10/1/2018 | | 0.115 | | | U.S. Currency |
| | | | | | | | | | | | | | | | | | | | | | | | | | |
| 6/21/2018 | | 8/31/2018 | | 9/4/2018 | | 0.119 | | | U.S. Currency |
| 6/21/2018 | | 7/31/2018 | | 8/1/2018 | | 0.119 | | | U.S. Currency |
| 3/22/2018 | | 6/29/2018 | | 7/2/2018 | | 0.115 | | | U.S. Currency |
| 3/22/2018 | | 5/31/2018 | | 6/1/2018 | | 0.119 | | | U.S. Currency |
| 3/22/2018 | | 4/30/2018 | | 5/1/2018 | | 0.115 | | | U.S. Currency |
| 12/14/2017 | | 3/29/2018 | | 4/2/2018 | | 0.119 | | | U.S. Currency |
| 12/14/2017 | | 2/28/2018 | | 3/1/2018 | | 0.107 | | | U.S. Currency |
| 12/14/2017 | | 1/31/2018 | | 2/1/2018 | | 0.119 | | | U.S. Currency |
| 9/14/2017 | | 12/29/2017 | | 1/2/2018 | | 0.119 | | | U.S. Currency |
| 9/14/2017 | | 11/30/2017 | | 12/1/2017 | | 0.115 | | | U.S. Currency |
| 9/14/2017 | | 10/31/2017 | | 11/1/2017 | | 0.119 | | | U.S. Currency |
| 6/26/2017 | | 9/29/2017 | | 10/2/2017 | | 0.115 | | | U.S. Currency |
| 6/26/2017 | | 8/31/2017 | | 9/1/2017 | | 0.119 | | | U.S. Currency |
| 6/26/2017 | | 7/31/2017 | | 8/1/2017 | | 0.119 | | | U.S. Currency |
| 3/23/2017 | | 6/30/2017 | | 7/3/2017 | | 0.115 | | | U.S. Currency |
| 3/23/2017 | | 5/31/2017 | | 6/1/2017 | | 0.119 | | | U.S. Currency |
| 3/23/2017 | | 4/28/2017 | | 5/1/2017 | | 0.115 | | | U.S. Currency |
| 12/15/2016 | | 3/31/2017 | | 4/3/2017 | | 0.119 | | | U.S. Currency |
| 12/15/2016 | | 2/28/2017 | | 3/1/2017 | | 0.107 | | | U.S. Currency |
| 12/15/2016 | | 1/31/2017 | | 2/1/2017 | | 0.119 | | | U.S. Currency |
| 9/14/2016 | | 12/30/2016 | | 1/3/2017 | | 0.119 | | | U.S. Currency |
| 9/14/2016 | | 11/30/2016 | | 12/1/2016 | | 0.115 | | | U.S. Currency |
| 9/14/2016 | | 10/31/2016 | | 11/1/2016 | | 0.119 | | | U.S. Currency |
| 6/23/2016 | | 9/30/2016 | | 10/3/2016 | | 0.115 | | | U.S. Currency |
| 6/23/2016 | | 8/31/2016 | | 9/1/2016 | | 0.119 | | | U.S. Currency |
| 6/23/2016 | | 7/29/2016 | | 8/1/2016 | | 0.119 | | | U.S. Currency |
| 3/23/2016 | | 6/30/2016 | | 7/1/2016 | | 0.115 | | | U.S. Currency |
| 3/23/2016 | | 5/31/2016 | | 6/1/2016 | | 0.119 | | | U.S. Currency |
| 3/23/2016 | | 4/29/2016 | | 5/2/2016 | | 0.115 | | | U.S. Currency |
| 12/17/2015 | | 3/31/2016 | | 4/1/2016 | | 0.119 | | | U.S. Currency |
| 12/17/2015 | | 2/29/2016 | | 3/1/2016 | | 0.111 | | | U.S. Currency |
| 12/17/2015 | | 1/29/2016 | | 2/1/2016 | | 0.119 | | | U.S. Currency |
| 9/23/2015 | | 12/31/2015 | | 1/4/2016 | | 0.119 | | | U.S. Currency |
| 9/23/2015 | | 11/30/2015 | | 12/1/2015 | | 0.115 | | | U.S. Currency |
| 9/23/2015 | | 10/30/2015 | | 11/2/2015 | | 0.119 | | | U.S. Currency |
| 6/25/2015 | | 9/30/2015 | | 10/1/2015 | | 0.115 | | | U.S. Currency |
| 6/25/2015 | | 8/31/2015 | | 9/1/2015 | | 0.119 | | | U.S. Currency |
| 6/25/2015 | | 7/31/2015 | | 8/3/2015 | | 0.119 | | | U.S. Currency |
| 3/24/2015 | | 6/30/2015 | | 7/1/2015 | | 0.115 | | | U.S. Currency |
| 3/24/2015 | | 5/29/2015 | | 6/1/2015 | | 0.119 | | | U.S. Currency |
| 3/24/2015 | | 4/30/2015 | | 5/1/2015 | | 0.115 | | | U.S. Currency |
| 12/18/2014 | | 3/31/2015 | | 4/1/2015 | | 0.119 | | | U.S. Currency |
| 12/18/2014 | | 2/27/2015 | | 3/2/2015 | | 0.107 | | | U.S. Currency |
| 12/18/2014 | | 1/30/2015 | | 2/2/2015 | | 0.119 | | | U.S. Currency |
| 9/22/2014 | | 12/31/2014 | | 1/5/2015 | | 0.119 | | | U.S. Currency |
| 9/22/2014 | | 11/28/2014 | | 12/1/2014 | | 0.115 | | | U.S. Currency |
| 9/22/2014 | | 10/31/2014 | | 11/3/2014 | | 0.119 | | | U.S. Currency |
| 6/24/2014 | | 9/30/2014 | | 10/1/2014 | | 0.115 | | | U.S. Currency |
| 6/24/2014 | | 8/29/2014 | | 9/2/2014 | | 0.119 | | | U.S. Currency |
| 6/24/2014 | | 7/31/2014 | | 8/1/2014 | | 0.119 | | | U.S. Currency |
| 3/25/2014 | | 6/30/2014 | | 7/1/2014 | | 0.115 | | | U.S. Currency |
| 3/25/2014 | | 5/30/2014 | | 6/2/2014 | | 0.119 | | | U.S. Currency |
| | | | | | | | | | | | | | | | | | | | | | | | | | |
| 3/25/2014 | | 4/30/2014 | | 5/1/2014 | | 0.115 | | | U.S. Currency |
| 12/19/2013 | | 3/31/2014 | | 4/1/2014 | | 0.119 | | | U.S. Currency |
| 12/19/2013 | | 2/28/2014 | | 3/3/2014 | | 0.107 | | | U.S. Currency |
| 12/19/2013 | | 1/31/2014 | | 2/3/2014 | | 0.119 | | | U.S. Currency |
| 9/27/2013 | | 12/31/2013 | | 1/2/2014 | | 0.119 | | | U.S. Currency |
| 9/27/2013 | | 11/29/2013 | | 12/2/2013 | | 0.115 | | | U.S. Currency |
| 9/27/2013 | | 10/31/2013 | | 11/1/2013 | | 0.119 | | | U.S. Currency |
| 6/27/2013 | | 9/30/2013 | | 10/1/2013 | | 0.115 | | | U.S. Currency |
| 6/27/2013 | | 8/30/2013 | | 9/3/2013 | | 0.119 | | | U.S. Currency |
| 6/27/2013 | | 7/31/2013 | | 8/1/2013 | | 0.119 | | | U.S. Currency |
| 3/25/2013 | | 6/28/2013 | | 7/1/2013 | | 0.115 | | | U.S. Currency |
| 3/25/2013 | | 5/31/2013 | | 6/3/2013 | | 0.119 | | | U.S. Currency |
| 3/25/2013 | | 4/30/2013 | | 5/1/2013 | | 0.115 | | | U.S. Currency |
| 12/18/2012 | | 3/28/2013 | | 4/1/2013 | | 0.119 | | | U.S. Currency |
| 12/18/2012 | | 2/28/2013 | | 3/1/2013 | | 0.107 | | | U.S. Currency |
| 12/18/2012 | | 1/31/2013 | | 2/1/2013 | | 0.119 | | | U.S. Currency |
| 9/28/2012 | | 12/31/2012 | | 1/2/2013 | | 0.119 | | | U.S. Currency |
| 9/28/2012 | | 11/30/2012 | | 12/3/2012 | | 0.115 | | | U.S. Currency |
| 9/28/2012 | | 10/31/2012 | | 11/1/2012 | | 0.119 | | | U.S. Currency |
| 6/29/2012 | | 9/28/2012 | | 10/1/2012 | | 0.115 | | | U.S. Currency |
| 6/29/2012 | | 8/31/2012 | | 9/4/2012 | | 0.119 | | | U.S. Currency |
| 6/29/2012 | | 7/31/2012 | | 8/1/2012 | | 0.119 | | | U.S. Currency |
_____________________________
(1)Per share amounts through September 30, 2024 have been adjusted to reflect the Reverse Stock Split effected on December 16, 2024, on a retrospective basis.
The federal income tax characterization of distributions declared and paid for the fiscal year will be determined at fiscal year-end based upon our investment company taxable income for the full fiscal year and distributions paid during the full year.
CAPITALIZATION
The following table sets forth our cash and capitalization as of September 30, 2024:
•on an actual basis (reflecting the Reverse Stock Split on a retrospective basis); and
•on an as adjusted basis giving effect to (a) the sale of 5,500,000 shares of our common stock in this offering (assuming no exercise of the underwriters’ option to purchase additional shares) at the public offering price of $15.53 per share after deducting assumed underwriting discounts and commissions of $4.9 million and the estimated offering expenses of approximately $2.0 million payable by us; (b) the application of the proceeds of this offering as described under “Use of Proceeds”; and (c) the Reverse Stock Split. These figures assume the sale of all of the Main Street Indicative Commitment Shares and that no shares are sold pursuant to the directed share program described elsewhere in this prospectus.
This table should be read in conjunction with “Use of Proceeds” included in this prospectus and “Management’s Discussion and Analysis of Financial Condition and Results of Operations” and the consolidated financial statements and the related notes thereto in this prospectus.
| | | | | | | | | | | | | | | | | | | | | | | |
| As of September 30, 2024 |
| | Actual | | As adjusted for this Offering |
| (Unaudited)
(in thousands, except shares) |
| Cash and cash equivalents | $ | 48,926 | | $ | 48,926 | |
| Debt | | | | |
Credit Facilities(1) | $ | 406,688 | | $ | 328,128 | |
| Series A Notes due 2026 (par: $150,000) | | 149,379 | | | 149,379 | |
| Total debt | $ | 556,067 | | $ | 477,507 | |
Net Assets(2) | | | | |
Common stock, $0.001 par value per share (450,000,000 shares authorized; 40,217,446 and 45,740,358 shares issued and outstanding, respectively) | | 40 | | | 46 | |
Preferred stock, $0.001 par value per share (50,000,000 shares authorized; no shares issued and outstanding, respectively) | | — | | | — | |
| Additional paid‑in capital | | 689,989 | | | 768,543 | |
| Total undistributed earnings | | (71,544) | | | (71,544) | |
| Total net assets | $ | 618,485 | | $ | 697,045 | |
| Total capitalization | $ | 1,174,552 | | $ | 1,174,552 | |
_____________________________
(1)As of January 17, 2025, we had approximately $131.0 million outstanding under our Corporate Facility and $262.7 million outstanding under our SPV Facility. This table has not been adjusted to reflect the changes in our outstanding borrowings under the Credit Facilities subsequent to September 30, 2024.
(2)Common stock and additional paid-in capital have been adjusted to reflect the Reverse Stock Split effected on December 16, 2024, on a retrospective basis.
DILUTION
The dilution to investors in this offering is represented by the difference between the offering price per share of our common stock and the pro forma NAV per share of our common stock after this offering. NAV per share is determined by dividing our NAV, which is our total tangible assets less total liabilities, by the number of outstanding shares of common stock.
After (1) giving effect to the sale of the shares of common stock to be sold in this offering at $15.53 per share, (2) the deduction of assumed underwriting discounts and commissions and estimated offering expenses and (3) giving effect to the adjustments in the table below, our as-adjusted NAV as of September 30, 2024 would be approximately $703.5 million, or $15.38 per share, representing an immediate dilution of $0.15 per share, or 1.0%, to shares sold in this offering. The following illustrations assume no exercise of the underwriters’ option to purchase additional shares. If the underwriters’ option to purchase additional shares is exercised in full, there would be an immediate dilution to the net asset value of $0.16 per share, or 1.1%, to the shares sold in this offering.
The following table illustrates the dilution to the shares on a per share basis (without exercise of the underwriters’ option to purchase additional shares):
| | | | | | | | |
Public offering price per share | $ | 15.53 | |
September 30, 2024 NAV per share (1) | $ | 15.38 | |
| Increase due to share transactions subsequent to September 30, 2024 (2) | $ | 0.01 | |
Other changes in NAV subsequent to September 30, 2024 (3) | $ | 0.14 | |
Pro forma post September 30, 2024 NAV per share | $ | 15.53 | |
Decrease attributable to this offering | $ | (0.15) | |
As-adjusted NAV per share immediately after this offering | $ | 15.38 | |
| Dilution per share to stockholders participating in this offering | $ | 0.15 | |
_____________________________
(1)NAV per share has been adjusted to reflect the Reverse Stock Split effected on December 16, 2024, on a retrospective basis.
(2)Adjusted for common stock repurchased on November 1, 2024 under the terms set forth in the tender offer statement on Schedule TO and related Offer to Purchase filed with the SEC on September 26, 2024 for an aggregate purchase price of approximately $4.0 million and the distribution reinvestment payable on January 31, 2025 in the amount of approximately $4.4 million.
(3)Increase attributable to other changes in NAV since September 30, 2024. The increase was comprised of the net tax benefit recognized for the quarter and the net fair value increase on the investment portfolio resulting from the net unrealized appreciation partially offset by the net realized losses on the portfolio investments.
The following table sets forth information with respect to the shares prior to and following this offering: | | | | | | | | | | | | | | | | | | | | | | | | | | | | | | | | | | | | | | |
| Shares | | Total Consideration | | Average Price |
| Number | | % | | Amount | | % | | Per Share |
Shares of common stock outstanding (1) | 40,240,358 | | 88 | % | | $ | 624,932,760 | | | 88 | % | | $ | 15.53(2) |
Shares of common stock to be sold in this offering (assuming no exercise of the underwriters’ option to purchase additional shares) | 5,500,000 | | 12 | % | | $ | 85,415,000 | | | 12 | % | | $ | 15.53 |
Total | 45,740,358 | | 100% | | $ | 710,347,760 | | | 100% | | | |
_____________________________
(1)Number of shares outstanding and the average price per share have been adjusted to reflect the Reverse Stock Split effected on December 16, 2024, on a retrospective basis.
(2)Increase attributable to other changes in NAV since September 30, 2024. The increase was comprised of the net tax benefit recognized for the quarter and the net fair value increase on the investment portfolio resulting from the net unrealized appreciation partially offset by the net realized losses on the portfolio investments.
The as-adjusted NAV upon completion of this offering is calculated as follows (dollars in thousands):
| | | | | | | | |
| Numerator | | |
September 30, 2024 NAV, as adjusted (1) | $ | 624,903 |
| Assumed proceeds from this offering (after deduction of sales load and offering expenses payable by us) | $ | 78,560 |
NAV upon completion of this offering | $ | 703,463 | |
| Denominator | | |
Shares of common stock outstanding (as of January 17, 2025) | | 40,240,358 |
Shares of common stock included in this offering (2) | | 5,500,000 |
| Total shares outstanding upon completion of this offering | | 45,740,358 |
_____________________________
(1)Adjusted for (1) common stock repurchased on November 1, 2024 under the terms set forth in the tender offer statement on Schedule TO and related Offer to Purchase filed with the SEC on September 26, 2024 for an aggregate purchase price of approximately $4.0 million, (2) the distribution reinvestment payable on January 31, 2025 in the amount of approximately $4.4 million and (3) increases attributable to other changes in NAV since September 30, 2024, comprised of the net tax benefit recognized for the quarter and the net fair value increase on the investment portfolio resulting from the net unrealized appreciation partially offset by the net realized losses on the portfolio investments.
(2)Assuming no exercise of the underwriters’ option to purchase additional shares.
MANAGEMENT’S DISCUSSION AND ANALYSIS OF FINANCIAL CONDITION AND RESULTS OF OPERATIONS
You should read the following analysis of our financial condition and results of operations in conjunction with the financial statements and the related notes to the financial statements appearing elsewhere in this prospectus. The information in this section contains forward-looking statements that involve risks and uncertainties.
MSC Income Fund
We are a principal investment firm primarily focused on providing debt capital to private (“Private Loan”) companies owned by or in the process of being acquired by a private equity fund (our “Private Loan investment strategy”) and secondarily focused on providing customized long-term debt and equity capital solutions to lower middle market (“LMM”) companies (our “LMM investment strategy”). A portion of our Private Loan investments may include equity investments in our Private Loan companies. Our portfolio investments are typically made to support leveraged buyouts, recapitalizations, growth financings, refinancings and acquisitions of companies that operate in diverse industry sectors. We seek to partner with private equity fund sponsors in our Private Loan investment strategy and primarily invest in secured debt investments of Private Loan companies generally headquartered in the United States. We maintain relationships with a diverse group of private equity fund sponsors, with no aggregate Private Loan portfolio investments with a single sponsor exceeding 13% of our total Private Loan portfolio investments at fair value as of September 30, 2024. We also seek to partner with entrepreneurs, business owners and management teams and generally provide “one-stop” debt and equity financing solutions within our LMM investment strategy. Through our LMM investment strategy, we primarily invest in secured debt investments, equity investments, warrants and other securities of LMM companies typically based in the United States.
We also maintain a legacy portfolio of investments in larger middle market (“Middle Market”) companies (our “Middle Market investment portfolio”) and a limited portfolio of other portfolio investments (“Other Portfolio”). Our Middle Market investments are generally debt investments in companies owned by a private equity fund that were originally issued through a syndication financing process. We have generally stopped making new Middle Market investments and expect our Middle Market investment portfolio to continue to decline in future periods as our existing Middle Market investments are repaid or sold. Our Other Portfolio investments primarily consist of investments that are not consistent with the typical profiles for our Private Loan, LMM or Middle Market portfolio investments, including investments in non-affiliated investment companies and private funds managed by third parties. The “Investment Portfolio,” as used herein, refers to all of our investments in Private Loan portfolio companies, investments in LMM portfolio companies, investments in Middle Market portfolio companies and Other Portfolio investments.
We were formed on November 28, 2011 as a Maryland corporation to operate as an externally managed business development company (“BDC”) under the Investment Company Act of 1940, as amended (the “1940 Act”). MSIF has elected to be treated for U.S. federal income tax purposes as a regulated investment company (“RIC”) under Subchapter M of the Internal Revenue Code of 1986, as amended (the “Code”). As a result, MSIF generally does not pay corporate-level U.S. federal income taxes on any net ordinary taxable income or capital gains that it distributes to its stockholders.
MSIF has certain direct and indirect wholly-owned subsidiaries that have elected to be taxable entities (the “Taxable Subsidiaries”). The primary purpose of the Taxable Subsidiaries is to permit MSIF to hold equity investments in portfolio companies which are “pass-through” entities for tax purposes. MSIF also has certain direct and indirect wholly-owned subsidiaries formed for financing purposes (the “Structured Subsidiaries”).
Our Business
Our principal investment objective is to maximize our Investment Portfolio’s total return, primarily by generating current income from our debt investments and, to a lesser extent, by generating current income and capital appreciation from our equity and equity-related investments, including warrants, convertible securities and other rights to acquire equity securities in a portfolio company. We seek to achieve our investment objective through our Private Loan and LMM investment strategies. A portion of our Private Loan investments may include equity investments in our Private Loan companies. Our Private Loan investment strategy involves investments in companies that generally have annual revenues between $25 million and $500 million and annual EBITDA between $7.5 million and $50 million. Our LMM investment strategy involves investments in companies that generally have annual revenues between $10 million and $150 million and annual EBITDA between $3 million and $20 million. Our Private Loan and LMM investments generally range in size from $1 million to $20 million. Geographically, we maintain a diversified portfolio throughout the United States.
Private Loan investments primarily consist of debt securities that have primarily been originated directly by our Adviser or, to a lesser extent, through our Adviser’s strategic relationships with other investment funds on a collaborative basis through investments that are often referred to in the debt markets as “club deals” because of the small lender group size. Our Private Loan investments are typically made in a company owned by or in the process of being acquired by a private equity fund. Our Private Loan portfolio debt investments are generally secured by a first priority lien on the assets of the portfolio company and typically have a term of between three and seven years from the original investment date. We may also co-invest with Main Street and the private equity funds in the equity securities of our Private Loan portfolio companies.
We seek to avoid Private Loan investments in businesses with the following characteristics: distressed situations, highly cyclical or seasonal revenues, low operating margins, high capital intensity, high customer concentration, and inexperienced management teams. Our target loan profiles for our Private Loan investments typically include a total leverage level below 4.5x EBITDA, a debt-to-enterprise value below 60%, and companies with demonstrated historical cash flow generation. As of September 30, 2024 and based upon cost, our Private Loan investment portfolio generation consisted of 47.1% lead investments, which are investments where our Adviser was the lender leading the lenders’ activities on the Private Loan investment (which include, but are not limited to, sourcing the opportunity, due diligence procedures, negotiations, supervision of legal documentation and post-investment monitoring, with these activities together, the “Lender Activities”), 25.0% co-lead investments, which are investments where our Adviser was a co-lead with another lender for the Lender Activities, and 27.9% club investments, which are investments where our Adviser was not leading or co-leading the Lender Activities (excluding Private Loan investments closed by LMM investment teams, which in aggregate represent approximately 3.3% and 3.5% of our total Private Loan investment portfolio at cost and fair value, respectively, as of September 30, 2024). The portfolio company ownership within our Private Loan portfolio, based upon cost as of September 30, 2024, consisted of 97% owned by a private equity fund and 3% owned by a non-private equity fund party (excluding Private Loan investments closed by LMM investment teams). Since January 1, 2021 through September 30, 2024, our Adviser’s Private Credit investment team reviewed approximately 1,045 Private Loan investment opportunities and closed 74 investments; we participated in 73 of such investments.
We also seek to fill the financing gap for LMM businesses, which, historically, have had limited access to financing from commercial banks and other traditional sources. The underserved nature of the LMM creates the opportunity for us to meet the financing needs of LMM companies while also negotiating favorable transaction terms and equity participation. Our ability to invest across a company’s capital structure, from secured loans to equity securities, allows us to offer portfolio companies a comprehensive suite of financing options, or a “one-stop” financing solution. We believe that providing customized, “one-stop” financing solutions is important and valuable to LMM portfolio companies. We generally seek to partner directly with entrepreneurs, management teams and business owners in making our LMM investments. Our LMM portfolio debt investments are generally secured by a first lien on the assets of the portfolio company and typically have a term of between five and seven years from the original investment date. Our target purchase price multiple for LMM investments is between 4.5x – 6.5x enterprise value-to-EBITDA.
In contemplation of this public offering, our board of directors and the Adviser decided to shift our future investment strategy with respect to new platform investments to be solely focused on our Private Loan investment strategy. As a result, the size of our LMM investment strategy portfolio is expected to decrease over time as we make new investments consistent with our Private Loan investment strategy and our existing LMM investment strategy investments are repaid or sold in the ordinary course of business. We do, however, plan to continue executing follow on investments in our existing LMM portfolio companies going forward in accordance with our existing SEC order for co-investment exemptive relief.
We also maintain our legacy Middle Market investment portfolio. Our Middle Market investments are generally debt investments in companies owned by private equity funds that were originally issued through a syndication financing process. We have generally stopped making new Middle Market investments and expect our Middle Market investment portfolio to continue to decline in future periods as existing Middle Market investments are repaid or sold. Our Middle Market debt investments generally range in size from $1 million to $20 million, are generally secured by a first priority lien on the assets of the portfolio company and typically have an expected duration of between three and seven years from the original investment date.
Our other portfolio (“Other Portfolio”) investments primarily consist of investments that are not consistent with the typical profiles for our Private Loan, LMM or Middle Market portfolio investments, including investments in non-affiliated investment companies and private funds managed by third parties. In our Other Portfolio, we may incur indirect fees and expenses to third party managers. Similar to our Middle Market investments, we have generally stopped making new Other Portfolio investments and expect our Other Portfolio to continue to decline in future periods as existing Other Portfolio investments are repaid or sold.
Our portfolio investments are generally made through MSIF, the Taxable Subsidiaries and the Structured Subsidiaries. MSIF, the Taxable Subsidiaries and the Structured Subsidiaries share the same investment strategies and criteria. An investor’s return in MSIF will depend, in part, on the Taxable Subsidiaries’ and the Structured Subsidiaries’ investment returns as they are wholly-owned subsidiaries of MSIF.
The level of new portfolio investment activity will fluctuate from period to period based upon our view of the current economic fundamentals, our ability to identify new investment opportunities that meet our investment criteria, and our ability to consummate the identified opportunities and our available liquidity. The level of new investment activity, and associated interest and fee income, will directly impact future investment income. In addition, the level of dividends paid by portfolio companies and the portion of our portfolio debt investments on non-accrual status will directly impact future investment income. While we intend to grow our portfolio and our investment income over the long term, our growth and our operating results may be more limited during depressed economic periods. However, we intend to appropriately manage our cost structure and liquidity position based on applicable economic conditions and our investment outlook. The level of realized gains or losses and unrealized appreciation or depreciation on our investments will also fluctuate depending upon portfolio activity, economic conditions and the performance of our individual portfolio companies. The changes in realized gains and losses and unrealized appreciation or depreciation could have a material impact on our operating results.
We have received an exemptive order from the SEC permitting co-investments among us, Main Street and other funds and clients advised by our Adviser in certain negotiated transactions where co-investing would otherwise be prohibited under the 1940 Act. We have made co-investments with, and in the future intend to continue to make co-investments with Main Street and other funds and clients advised by our Adviser, in accordance with the conditions of the order. The order requires, among other things, that we and our Adviser consider whether each such investment opportunity is appropriate for us, Main Street and the other funds and clients advised by our Adviser, as applicable, and if it is appropriate, to propose an allocation of the investment opportunity between such parties. Because our Adviser is wholly-owned by Main Street and is not managing our investment activities as its sole activity, this may provide our Adviser an incentive to allocate opportunities to Main Street, other participating funds and other clients instead of us. However, both we and our Adviser have policies and procedures in place to manage this conflict, including oversight by the independent members of our board of directors. In addition to the co-investment program described above, we also co-invest in syndicated deals and other transactions where price is the only negotiated point by us and our affiliates.
Investment Portfolio Summary
The following tables provide a summary of our investments in the Private Loan, LMM and Middle Market portfolios as of September 30, 2024, December 31, 2023 and December 31, 2022 (this information excludes Other Portfolio investments, which are discussed further below).
| | | | | | | | | | | | | | | | | |
| As of September 30, 2024 |
| Private Loan | | LMM (a) | | Middle Market |
| (dollars in millions) |
| Number of portfolio companies | 84 | | 55 | | 11 |
| Fair value | $ | 679.9 | | | $ | 411.0 | | | $ | 46.1 | |
| Cost | $ | 700.0 | | | $ | 340.5 | | | $ | 73.0 | |
| Debt investments as a % of portfolio (at cost) | 95.6 | % | | 70.8 | % | | 88.9 | % |
| Equity investments as a % of portfolio (at cost) | 4.4 | % | | 29.2 | % | | 11.1 | % |
| % of debt investments at cost secured by first priority lien | 99.9 | % | | 99.9 | % | | 99.9 | % |
| Weighted-average annual effective yield (b) | 12.7 | % | | 13.2 | % | | 14.1 | % |
| Average EBITDA (c) | $ | 33.2 | | | $ | 10.0 | | | $ | 44.3 | |
_____________________________
(a)As of September 30, 2024, we had equity ownership in all of our LMM portfolio companies, and the average fully diluted equity ownership in those portfolio companies was 9%.
(b)The weighted-average annual effective yields were computed using the effective interest rates for all debt investments as of September 30, 2024, including amortization of deferred debt origination fees and accretion of original issue discount but excluding fees payable upon repayment of the debt instruments and any debt investments on non-accrual status, and are weighted based upon the principal amount of each applicable debt investment as of September 30, 2024. The weighted-average annual effective yield on our debt portfolio as of September 30, 2024 including debt investments on non-accrual status was 12.1% for our Private Loan portfolio, 11.8% for our LMM portfolio and 9.4% for our Middle Market portfolio. The weighted-average annual effective yield on our entire investment portfolio as of September 30, 2024, including debt investments on non-accrual status, was 11.9%. The weighted-average annual effective yield is not reflective of what an investor in shares of our common stock will realize on its investment because it does not reflect our utilization of debt capital in our capital structure, our expenses or any sales load paid by an investor. The total return based on change in the Company’s net asset value was 6.4% (not annualized) for the nine months ended September 30, 2024. See “Financial Highlights” above.
(c)The average EBITDA is calculated using a weighted-average for the Private Loan and Middle Market portfolios and a simple average for the LMM portfolio. These calculations exclude certain portfolio companies, including two Private Loan portfolio companies, two LMM portfolio companies and one Middle Market portfolio company, as EBITDA is not a meaningful valuation metric for our investments in these portfolio companies, and those portfolio companies whose primary purpose is to own real estate and those portfolio companies whose primary operations have ceased and only residual value remains.
| | | | | | | | | | | | | | | | | |
| As of December 31, 2023 |
| Private Loan | | LMM (a) | | Middle Market |
| (dollars in millions) |
| Number of portfolio companies | 78 | | 50 | | 16 |
| Fair value | $ | 595.3 | | | $ | 387.0 | | | $ | 86.0 | |
| Cost | $ | 586.4 | | | $ | 315.7 | | | $ | 114.7 | |
| Debt investments as a % of portfolio (at cost) | 94.1 | % | | 70.2 | % | | 93.1 | % |
| Equity investments as a % of portfolio (at cost) | 5.9 | % | | 29.8 | % | | 6.9 | % |
| % of debt investments at cost secured by first priority lien | 100.0 | % | | 99.9 | % | | 100.0 | % |
| Weighted-average annual effective yield (b) | 13.1 | % | | 13.0 | % | | 13.0 | % |
| Average EBITDA (c) | $ | 30.5 | | | $ | 8.8 | | | $ | 74.2 | |
_____________________________
(a)As of December 31, 2023, we had equity ownership in all of our LMM portfolio companies, and the average fully diluted equity ownership in those portfolio companies was 9%.
(b)The weighted-average annual effective yields were computed using the effective interest rates for all debt investments as of December 31, 2023, including amortization of deferred debt origination fees and accretion of original issue discount but excluding fees payable upon repayment of the debt instruments and any debt investments on non-accrual status, and are weighted based upon the principal amount of each applicable debt investment as of December 31, 2023. The weighted-average annual effective yield on our debt portfolio as of December 31, 2023 including debt investments on non-accrual status was 12.6% for our Private Loan portfolio, 13.0% for our LMM portfolio and 9.9% for our Middle Market portfolio. The weighted-average annual effective yield on our entire investment portfolio as of December 31, 2023, including debt investments on non-accrual status, was 12.4%. The weighted-average annual effective yield is not reflective of what an investor in shares of our common stock will realize on its investment because it does not reflect our utilization of debt capital in our capital structure, our expenses or any sales load paid by an investor. The total return based on change in the Company’s net asset value was 10.9% for the year ended December 31, 2023. See “Financial Highlights” above.
(c)The average EBITDA is calculated using a weighted-average for the Private Loan and Middle Market portfolios and a simple average for the LMM portfolio. These calculations exclude certain portfolio companies, including one Private Loan portfolio company, as EBITDA is not a meaningful valuation metric for our investment in this portfolio company, and those portfolio companies whose primary purpose is to own real estate.
| | | | | | | | | | | | | | | | | |
| As of December 31, 2022 |
| Private Loan | | LMM (a) | | Middle Market |
| (dollars in millions) |
| Number of portfolio companies | 70 | | | 48 | | | 21 | |
| Fair value | $ | 559.8 | | | $ | 352.7 | | | $ | 126.7 | |
| Cost | $ | 563.0 | | | $ | 312.5 | | | $ | 159.7 | |
| Debt investments as a % of portfolio (at cost) | 96.2 | % | | 73.2 | % | | 95.0 | % |
| Equity investments as a % of portfolio (at cost) | 3.8 | % | | 26.8 | % | | 5.0 | % |
| % of debt investments at cost secured by first priority lien | 99.4 | % | | 99.9 | % | | 98.5 | % |
| Weighted-average annual effective yield (b) | 11.8 | % | | 12.1 | % | | 11.3 | % |
| Average EBITDA (c) | $ | 36.8 | | | $ | 8.6 | | | $ | 79.2 | |
_____________________________
(a)At December 31, 2022, we had equity ownership in all of our LMM portfolio companies, and the average fully diluted equity ownership in those portfolio companies was 9%.
(b)The weighted-average annual effective yields were computed using the effective interest rates for all debt investments as of December 31, 2022, including amortization of deferred debt origination fees and accretion of original issue discount but excluding fees payable upon repayment of the debt instruments and any debt investments on non-accrual status, and are weighted based upon the principal amount of each applicable debt investment as of December 31, 2022. The weighted-average annual effective yield on our debt portfolio as of December 31, 2022 including debt investments on non-accrual status was 11.4% for our Private Loan portfolio, 11.7% for our LMM portfolio and 9.7% for our Middle Market portfolio. The weighted-average annual effective yield on our entire investment portfolio as December 31, 2022, including debt investments on non-accrual status, was 11.2%. The weighted-average annual effective yield is not reflective of what an investor in shares of our common stock will realize on its investment because it does not reflect our utilization of debt capital in our capital structure, our expenses or any sales load paid by an investor. The total return based on change in the Company’s net asset value was 7.4% for the year ended December 31, 2022. See “Financial Highlights” above.
(c)The average EBITDA is calculated using a weighted-average for the Private Loan and Middle Market portfolios and a simple average for the LMM portfolio. These calculations exclude certain portfolio companies, including one Private Loan portfolio company, as EBITDA is not a meaningful valuation metric for our investment in this portfolio company, and those portfolio companies whose primary purpose is to own real estate.
For the three months ended September 30, 2024 and 2023, we achieved an annualized total return on investments of 10.5% and 12.0%, respectively. For the nine months ended September 30, 2024 and 2023, we achieved an annualized total return on investments of 12.4% and 12.9%, respectively. For the years ended December 31, 2023 and 2022, we achieved a total return on investments of 13.6% and 9.1%, respectively. Total return on investments is calculated using the interest, dividend and fee income, as well as the realized and unrealized change in fair value of the Investment Portfolio for the specified period. Our total return on investments is not reflective of what an investor in shares of our common stock will realize on its investment because it does not reflect our utilization of debt capital in our capital structure, our expenses or any sales load paid by an investor.
As of September 30, 2024, we had Other Portfolio investments in six entities, spread across four investment managers, collectively totaling $25.7 million in fair value and $19.1 million in cost basis and which comprised 2.2% and 1.7% of our Investment Portfolio at fair value and cost, respectively. As of December 31, 2023, we had Other Portfolio investments in six entities, spread across four investment managers, collectively totaling $24.6 million in fair value and $21.5 million in cost basis and which comprised 2.3% and 2.1% of our Investment Portfolio at fair value and cost, respectively. As of December 31, 2022, we had Other Portfolio investments in six entities, spread across four investment managers, collectively totaling $29.0 million in fair value and $24.7 million in cost basis and which comprised 2.7% and 2.3% of our Investment Portfolio at fair value and cost, respectively.
Critical Accounting Policies
The preparation of financial statements and related disclosures in conformity with generally accepted accounting principles (“U.S. GAAP”) requires management to make estimates and assumptions that affect the reported amounts of assets and liabilities, and contingent assets and liabilities at the date of the financial statements, and revenues and expenses during the periods reported. Actual results could materially differ from those estimates. Critical accounting policies are those that require management to make subjective or complex judgments about the effect of matters that are inherently uncertain and may change in subsequent periods. Changes that may be required in the underlying assumptions or estimates in these areas could have a material impact on our current and future financial condition and results of operations.
Management has discussed the development and selection of each critical accounting policy and estimate with the Audit Committee of our board of directors. Our critical accounting policies and estimates include the Investment Portfolio Valuation and Revenue Recognition policies described below. Our significant accounting policies are described in greater detail in Note B — Summary of Significant Accounting Policies to the consolidated financial statements included in of this prospectus.
Investment Portfolio Valuation
The most significant determination inherent in the preparation of our consolidated financial statements is the valuation of our Investment Portfolio and the related amounts of unrealized appreciation and depreciation. We consider this determination to be a critical accounting estimate, given the significant judgments and subjective measurements required. As of September 30, 2024 and December 31, 2023, our Investment Portfolio valued at fair value represented 95% and 96%, respectively, of our total assets. We are required to report our investments at fair value. We follow the provisions of FASB ASC 820, Fair Value Measurements and Disclosures (“ASC 820”). ASC 820 defines fair value, establishes a framework for measuring fair value, establishes a fair value hierarchy based on the quality of inputs used to measure fair value and enhances disclosure requirements for fair value measurements. ASC 820 requires us to assume that the portfolio investment is to be sold in the principal market to independent market participants, which may be a hypothetical market. Market participants are defined as buyers and sellers in the principal market that are independent, knowledgeable and willing and able to transact. See Note B.1. — Summary of Significant Accounting Policies — Valuation of the Investment Portfolio included in this prospectus for a detailed discussion of our Investment Portfolio valuation process and procedures.
Due to the inherent uncertainty in the valuation process, our determination of fair value for our Investment Portfolio may differ materially from the values that would have been determined had a ready market for the securities existed. In addition, changes in the market environment, portfolio company performance and other events that may occur over the lives of the investments may cause the gains or losses ultimately realized on these investments to be materially different than the valuations currently assigned. We determine the fair value of each individual investment and record changes in fair value as unrealized appreciation or depreciation.
Rule 2a-5 under the 1940 Act permits a BDC’s board of directors to designate its executive officers or investment adviser as a valuation designee to determine the fair value for its investment portfolio, subject to the active oversight of the board. Our board of directors has approved policies and procedures pursuant to Rule 2a-5 (the “Valuation Procedures”) and has designated our Adviser, led by a group of Main Street’s and our Adviser’s executive officers, to serve as the board of directors’ valuation designee. We believe our Investment Portfolio as of September 30, 2024 and December 31, 2023 approximates fair value as of those dates based on the markets in which we operate and other conditions in existence on those reporting dates.
Revenue Recognition
Interest and Dividend Income
We record interest and dividend income on the accrual basis to the extent amounts are expected to be collected. Dividend income is recorded as dividends are declared by the portfolio company or at the point an obligation exists for the portfolio company to make a distribution. We evaluate accrued interest and dividend income periodically for collectability. When a loan or debt security becomes 90 days or more past due, and if we otherwise do not expect the debtor to be able to service its debt obligation, we will generally place the loan or debt security on non-accrual status and cease recognizing interest income on that loan or debt security until the borrower has demonstrated the ability and intent to pay contractual amounts due. If a loan or debt security’s status significantly improves regarding the debtor’s ability to service the debt obligation, or if a loan or debt security is sold or written off, we remove it from non-accrual status.
Fee Income
We may periodically provide services, including structuring and advisory services to our portfolio companies or other third parties. For services that are separately identifiable and evidence exists to substantiate fair value, fee income is recognized as earned, which is generally when the investment or other applicable transaction closes. Fees received in connection with debt financing transactions for services that do not meet these criteria are treated as debt origination fees and are generally deferred and accreted into income over the life of the financing.
Payment-in-Kind (“PIK”) Interest and Cumulative Dividends
We hold certain debt and preferred equity instruments in our Investment Portfolio that contain PIK interest and cumulative dividend provisions. The PIK interest, computed at the contractual rate specified in each debt agreement, is periodically added to the principal balance of the debt and is recorded as interest income. Thus, the actual collection of this interest may be deferred until the time of debt principal repayment. Cumulative dividends are recorded as dividend income, and any dividends in arrears are added to the balance of the preferred equity investment. The actual collection of these dividends in arrears may be deferred until such time as the preferred equity is redeemed or sold. To maintain RIC tax treatment, these non-cash sources of income may need to be paid out to stockholders in the form of distributions, even though we may not have collected the PIK interest and cumulative dividends in cash. We stop accruing PIK interest and cumulative dividends and write off any accrued and uncollected interest and dividends in arrears when we determine that such PIK interest and dividends in arrears are no longer collectible. For the nine months ended September 30, 2024 and 2023, (i) 5.4% and 3.9%, respectively, of our total investment income was attributable to PIK interest income not paid currently in cash and (ii) 0.1% of our total investment income in each period was attributable to cumulative dividend income not paid currently in cash.
Investment Portfolio Composition
The following tables summarize the composition of our total combined Private Loan, LMM and Middle Market portfolio investments at cost and fair value by type of investment as a percentage of the total combined Private Loan, LMM and Middle Market portfolio investments as of September 30, 2024, December 31, 2023 and December 2022 (this information excludes Other Portfolio investments).
| | | | | | | | | | | | | | | | | | | | |
| Cost: | | September 30, 2024 | | December 31, 2023 | | December 31, 2022 |
| First lien debt | | 87.6 | % | | 86.5 | % | | 88.5 | % |
| Equity | | 12.1 | | | 13.3 | | | 10.8 | |
| Second lien debt | | — | | | — | | | 0.3 | |
| Equity warrants | | 0.3 | | | 0.2 | | | 0.2 | |
| Other | | — | | | — | | | 0.2 | |
| | 100.0 | % | | 100.0 | % | | 100.0 | % |
| | | | | | | | | | | | | | | | | | | | |
| Fair Value: | | September 30, 2024 | | December 31, 2023 | | December 31, 2022 |
| First lien debt | | 80.7 | % | | 78.4 | % | | 81.4 | % |
| Equity | | 19.1 | | | 21.5 | | | 17.9 | |
| Second lien debt | | — | | | — | | | 0.3 | |
| Equity warrants | | 0.2 | | | 0.1 | | | 0.1 | |
| Other | | — | | | — | | | 0.3 | |
| | 100.0 | % | | 100.0 | % | | 100.0 | % |
Our Private Loan, LMM and Middle Market portfolio investments carry a number of risks including: (1) investing in companies which may have limited operating histories and financial resources; (2) holding investments that generally are not publicly traded and which may be subject to legal and other restrictions on resale; and (3) other risks common to investing in below investment-grade debt and equity investments in our Investment Portfolio. Please see Risks Related to our Investments contained in this prospectus for a more complete discussion of the risks involved with investing in our Investment Portfolio.
Portfolio Asset Quality
Our Adviser utilizes an internally developed investment rating system to rate the performance of each Private Loan, LMM and Middle Market portfolio company and to monitor our expected level of returns on each of our Private Loan, LMM and Middle Market investments in relation to our expectations for the portfolio company. The investment rating system takes into consideration various factors, including, but not limited to, each investment’s expected level of returns, the collectability of our debt investments and the ability to receive a return of the invested capital in our equity investments, comparisons to competitors and other industry participants, the portfolio company’s future outlook and other factors that are deemed to be significant to the portfolio company.
As of September 30, 2024, investments on non-accrual status comprised 2.6% of our total Investment Portfolio at fair value and 6.5% at cost. As of December 31, 2023, investments on non-accrual status comprised 1.1% of our total Investment Portfolio at fair value and 4.0% at cost. As of December 31, 2022, investments on non-accrual status comprised 0.8% of our total investment portfolio at fair value and 4.8% at cost.
The operating results of our portfolio companies are impacted by changes in the broader fundamentals of the United States economy. In periods during which the United States economy contracts, it is likely that the financial results of small to mid-sized companies, like those in which we invest, could experience deterioration or limited growth from current levels, which could ultimately lead to difficulty in meeting their debt service requirements, to an increase in defaults on our debt investments or in realized losses on our investments and to difficulty in maintaining historical dividend payment rates and unrealized appreciation on our equity investments. Consequently, we can provide no assurance that the performance of certain portfolio companies will not be negatively impacted by future economic cycles or other conditions, which could also have a negative impact on our future results.
Discussion and Analysis of Results of Operations
The financial data discussed below is derived from our audited financial statements for the fiscal year ended December 31, 2023, which are available via the EDGAR database on the SEC’s website, www.sec.gov.
Set forth below is a comparison of the results of operations for the nine months ended September 30, 2024 and 2023.
| | | | | | | | | | | | | | | | | | | | | | | |
| Nine Months Ended
September 30, | | Net Change |
| 2024 | | 2023 | | Amount | | % |
| (dollars in thousands) |
| Total investment income | $ | 101,373 | | | $ | 96,626 | | | $ | 4,747 | | | 5 | % |
| Total expenses, net of expense waivers | (58,280) | | | (53,997) | | | (4,283) | | | 8 | % |
| Net investment income | 43,093 | | | 42,629 | | | 464 | | | 1 | % |
| Net realized gain (loss) from investments | 23,802 | | | (24,986) | | | 48,788 | | | NM |
| Realized loss on extinguishment of debt | — | | | — | | | — | | | NM |
| Net unrealized appreciation (depreciation) from investments | (24,656) | | | 30,415 | | | (55,071) | | | NM |
| Income tax provision | (6,150) | | | (3,189) | | | (2,961) | | | 93 | % |
| Net increase in net assets resulting from operations | $ | 36,089 | | | $ | 44,869 | | | $ | (8,780) | | | (20) | % |
_____________________________
NM — Net change % not meaningful
Set forth below is a comparison of the results of operations and changes in financial condition for the years ended December 31, 2023 and 2022.
| | | | | | | | | | | | | | | | | | | | | | | |
| Year Ended
December 31, | | Net Change |
| 2023 | | 2022 | | Amount | | % |
| (dollars in thousands) |
| Total investment income | $ | 131,386 | | | $ | 103,765 | | | $ | 27,621 | | | 27 | % |
| Total expenses, net of expense waivers | (73,717) | | | (50,896) | | | (22,821) | | | 45 | % |
| Net investment income | 57,669 | | | 52,869 | | | 4,800 | | | 9 | % |
| Net realized loss from investments | (34,010) | | | (3,936) | | | (30,074) | | | NM |
| | | | | | | |
| Net unrealized appreciation (depreciation) from investments | 46,319 | | | (1,702) | | | 48,021 | | | NM |
| Income tax provision | (3,769) | | | (1,643) | | | (2,126) | | | NM |
| Net increase in net assets resulting from operations | $ | 66,209 | | | $ | 45,588 | | | $ | 20,621 | | | 45 | % |
_____________________________
NM — Net change % not meaningful
Investment Income
Total investment income for the nine months ended September 30, 2024 was $101.4 million, a 5% increase from the $96.6 million of total investment income for the corresponding period of 2023. The following table provides a summary of the changes in the comparable period activity.
| | | | | | | | | | | | | | | | | | | | | | | | | | |
| Nine Months Ended
September 30, | | Net Change | |
| 2024 | | 2023 | | Amount | | % | |
| (dollars in thousands) | |
| Interest income | $ | 88,154 | | | $ | 86,791 | | | $ | 1,363 | | | 2 | % | (a) |
| Dividend income | 8,964 | | | 7,862 | | | 1,102 | | | 14 | % | (b) |
| Fee income | 4,255 | | | 1,973 | | | 2,282 | | | 116 | % | (c) |
| Total investment income | $ | 101,373 | | | $ | 96,626 | | | $ | 4,747 | | | 5 | % | (d) |
_____________________________
(a)The increase in interest income was primarily due to (i) higher average levels of income producing Investment Portfolio debt investments and (ii) an increase in interest rates on floating rate Investment Portfolio debt investments primarily resulting from increases in benchmark index rates, partially offset by an increase in investments on non-accrual status.
(b)The increase in dividend income from Investment Portfolio equity investments was primarily a result of an increase of $1.8 million in dividend income from certain of our LMM portfolio companies, partially offset by a decrease of $0.4 million in dividend income from certain of our Private Loan portfolio companies.
(c)The increase in fee income was primarily related to (i) a $1.8 million increase in fees received from the refinancing and prepayment of debt investments and (ii) a $0.5 million increase in fees related to increased investment activity.
(d)The increase in total investment income includes a net increase of $0.9 million in certain income considered less consistent or non-recurring, including a $1.9 million increase in such fee income, partially offset by (i) a $0.6 million decrease in accelerated interest income from accelerated prepayment, repricing and other activity related to certain Investment Portfolio debt investments and (ii) a $0.4 million decrease in dividend income.
Total investment income for the year ended December 31, 2023 was $131.4 million, a 27% increase from the $103.8 million of total investment income for the prior year. The following table provides a summary of the changes in the comparable period activity.
| | | | | | | | | | | | | | | | | | | | | | | | | | |
| Year Ended
December 31, | | Net Change | |
| 2023 | | 2022 | | Amount | | % | |
| (dollars in thousands) | |
| Interest income | $ | 116,976 | | | $ | 90,811 | | | $ | 26,165 | | | 29 | % | (a) |
| Dividend income | 11,255 | | | 9,442 | | | 1,813 | | | 19 | % | (b) |
| Fee income | 3,155 | | | 3,512 | | | (357) | | | (10) | % | |
| Total investment income | $ | 131,386 | | | $ | 103,765 | | | $ | 27,621 | | | 27 | % | (c) |
_____________________________(a)The increase in interest income was primarily due to an increase in interest rates on floating rate Investment Portfolio debt investments primarily resulting from increases in benchmark index rates, partially offset by lower average levels of income producing Investment Portfolio debt investments.
(b)The increase in dividend income was primarily a result of growth in dividend income from certain LMM portfolio companies resulting from the continued strong operating results, financial condition and liquidity positions of those portfolio companies. The increase includes a $0.7 million increase in dividend income considered to be less consistent or non-recurring.
(c)The increase in total investment income includes a net increase of $1.9 million due to the impact of certain income considered less consistent or non-recurring, including (i) a $1.8 million increase in accelerated prepayments, repricing and other activity related to certain Investment Portfolio debt investments and (ii) a $0.7 million increase in dividend income, partially offset by a $0.6 million decrease in fee income.
Expenses
Total expenses, net of fee and expense waivers, for the nine months ended September 30, 2024 were $58.3 million, an 8% increase from $54.0 million in the corresponding period of 2023. The following table provides a summary of the changes in the comparable period activity.
| | | | | | | | | | | | | | | | | | | | | | | | | | |
| Nine Months Ended
September 30, | | Net Change | |
| 2024 | | 2023 | | Amount | | % | |
| (dollars in thousands) |
| Interest | $ | 29,470 | | | $ | 26,599 | | | $ | 2,871 | | | 11 | % | (a) |
| Base management fees | 15,545 | | | 14,761 | | | 784 | | | 5 | % | (b) |
| Incentive fees | 9,364 | | | 8,891 | | | 473 | | | 5 | % | |
| Internal administrative services fees | 7,155 | | | 6,752 | | | 403 | | | 6 | % | |
| General and administrative | 3,424 | | | 3,291 | | | 133 | | | 4 | % | |
| Total expenses before expense waivers | 64,958 | | | 60,294 | | | 4,664 | | | 8 | % | |
| Waiver of internal administrative services expenses | (6,678) | | | (6,297) | | | (381) | | | 6 | % | |
| Total expenses, net of expense waivers | $ | 58,280 | | | $ | 53,997 | | | $ | 4,283 | | | 8 | % | |
_____________________________(a)The increase in interest expense was primarily related to (i) increased weighted-average interest rates on our Credit Facilities based upon the increases in benchmark index rates for these floating rate obligations and (ii) higher weighted-average outstanding borrowings required to fund the growth in our Investment Portfolio.
(b)The increase in base management fees was due to an increase in average total assets subject to the base management fee.
Total expenses, net of expense waivers, for the year ended December 31, 2023 were $73.7 million, a 45% increase from $50.9 million in the prior year. The following table provides a summary of the changes in the comparable period activity.
| | | | | | | | | | | | | | | | | | | | | | | | | | |
| Year Ended
December 31, | | Net Change | |
| 2023 | | 2022 | | Amount | | % | |
| (dollars in thousands) | |
| Interest expense | $ | 36,458 | | | $ | 24,423 | | | $ | 12,035 | | | 49 | % | (a) |
| Base management fees | 19,828 | | | 19,831 | | | (3) | | | — | % | |
| Incentive fees | 12,569 | | | 2,130 | | | 10,439 | | | 490% | (b) |
| Internal administrative services fees | 8,916 | | | 5,147 | | | 3,769 | | | 73 | % | (c) |
| General and administrative | 4,254 | | | 3,905 | | | 349 | | | 9 | % | |
| Total expenses before expense waivers | 82,025 | | | 55,436 | | | 26,589 | | | 48 | % | |
| Waiver of internal administrative services expenses | (8,308) | | | (4,540) | | | (3,768) | | | 83 | % | |
| Total expenses | $ | 73,717 | | | $ | 50,896 | | | $ | 22,821 | | | 45 | % | |
_____________________________(a)The increase in interest expense was primarily related to increased average interest rates on our floating rate multi-year revolving credit facility (the “Corporate Facility”) and special purpose vehicle revolving credit facility (the “SPV Facility” and, together with the Corporate Facility, the “Credit Facilities”) due to increases in benchmark index rates for these floating rate obligations, partially offset by lower weighted-average outstanding borrowings.
(b)The increase in incentive fees was due to the increased Pre-Incentive Fee Net Investment Income resulting from MSC Income Fund’s more favorable operating results for the year ended December 31, 2023.
(c)The increase in internal administrative service fees related primarily to increased expenses incurred by the Adviser associated with its activities and services under the Investment Advisory Agreement. Consistent with prior practice, the vast majority of such internal administrative service fees, or all fees other than $0.6 million, were waived by the Adviser. The only fees not waived are the cost of services previously provided by a sub-administrator prior to January 1, 2022 and assumed by the Adviser thereafter.
Net Investment Income
Net investment income for the nine months ended September 30, 2024 increased 1% to $43.1 million, or $1.07 per share, compared to net investment income of $42.6 million, or $1.06 per share, for the corresponding period of 2023, each per share amount as adjusted to reflect the Reverse Stock Split effected on December 16, 2024, on a retrospective basis. The increase in net investment income was attributable to the increase in total investment income, partially offset by the increase in total expenses, both as discussed above. The increase in net investment income and net investment income per share includes a $0.9 million, or $0.02 per share (reflecting the Reverse Stock Split on a retrospective basis), increase in investment income considered to be less consistent or non-recurring, as discussed above.
Net investment income for the year ended December 31, 2023 increased 9% to $57.7 million, or $1.44 per share, compared to net investment income of $52.9 million, or $1.32 per share, in 2022 (each per share amount adjusted to reflect the Reverse Stock Split on a retrospective basis). The increase in net investment income was principally attributable to the increase in total investment income, partially offset by the increase in total expenses, both as discussed above. The increase in net investment income and net investment income on a per share basis includes a $1.9 million, or $0.04 per share (as adjusted for the Reverse Stock Split on a retrospective basis), increase in investment income considered less consistent or non-recurring, as discussed above.
Net Realized Gain (Loss) from Investments
The following table provides a summary of the primary components of the total net realized gain on investments of $23.8 million for the nine months ended September 30, 2024.
| | | | | | | | | | | | | | | | | | | | | | | | | | | | | | | | | | | | | | | | | | | | | | | |
| Nine Months Ended September 30, 2024 |
| Full Exits | | Partial Exits | | Restructures | | Other (a) | | Total |
| Net Gain/(Loss) | | # of Investments | | Net Gain/(Loss) | | # of Investments | | Net Gain/(Loss) | | # of Investments | | Net Gain/(Loss) | | Net Gain/(Loss) |
| (dollars in thousands) |
| Private Loan portfolio | $ | 24,832 | | | 2 | | $ | — | | | — | | $ | (595) | | | 1 | | $ | 27 | | | $ | 24,264 | |
| LMM portfolio | — | | | — | | 2,591 | | | 1 | | — | | | — | | 157 | | | 2,748 | |
| Middle Market portfolio | — | | | — | | (2,325) | | | 1 | | (773) | | | 1 | | (169) | | | (3,267) | |
| Other Portfolio | — | | | — | | — | | | — | | — | | | — | | 57 | | | 57 | |
| Total net realized gain (loss) | $ | 24,832 | | | 2 | | $ | 266 | | | 2 | | $ | (1,368) | | | 2 | | $ | 72 | | | $ | 23,802 | |
_____________________________(a)Other activity includes realized gains and losses from transactions involving ten portfolio companies which are not considered to be significant individually or in the aggregate.
The following table provides a summary of the primary components of the total net realized loss on investments of $34.0 million for the year ended December 31, 2023.
| | | | | | | | | | | | | | | | | | | | | | | | | | | | | | | | | | | | | | | | | | | | | | | |
| Year Ended December 31, 2023 |
| Full Exits | | Partial Exits | | Restructures | | Other (a) | | Total |
| Net Gain/(Loss) | | # of Investments | | Net Gain/(Loss) | | # of Investments | | Net Gain/(Loss) | | # of Investments | | Net Gain/(Loss) | | Net Gain/(Loss) |
| (dollars in thousands) |
| Private Loan portfolio | $ | 554 | | | 2 | | $ | — | | | — | | $ | (18,505) | | | 2 | | $ | (90) | | | $ | (18,041) | |
| LMM portfolio | (9,414) | | | 3 | | — | | | — | | (1,541) | | | 1 | | — | | | (10,955) | |
| Middle Market portfolio | 3,127 | | | 3 | | — | | | — | | (10,606) | | | 2 | | 242 | | | (7,237) | |
| Other Portfolio | — | | | — | | 2,223 | | | 1 | | — | | | — | | — | | | 2,223 | |
| Total net realized gain (loss) | $ | (5,733) | | | 8 | | $ | 2,223 | | | 1 | | $ | (30,652) | | | 5 | | $ | 152 | | | $ | (34,010) | |
_____________________________(a)Other activity includes realized gains and losses from transactions involving 15 portfolio companies which are not considered to be significant individually or in the aggregate.
The following table provides a summary of the primary components of the total net realized loss on investments of $3.9 million for the year ended December 31, 2022.
| | | | | | | | | | | | | | | | | | | | | | | | | | | | | | | | | | | | | | | | | | | | | | | |
| Year Ended December 31, 2022 |
| Full Exits | | Partial Exits | | Restructures | | Other (a) | | Total |
| Net Gain/(Loss) | | # of Investments | | Net Gain/(Loss) | | # of Investments | | Net Gain/(Loss) | | # of Investments | | Net Gain/(Loss) | | Net Gain/(Loss) |
| (dollars in thousands) |
| Private Loan portfolio | $ | 5,849 | | | 2 | | $ | — | | | — | | $ | (9,014) | | | 2 | | $ | (27) | | | $ | (3,192) | |
| LMM portfolio | — | | | — | | — | | | — | | (1,456) | | | 1 | | 198 | | | (1,258) | |
| Middle Market portfolio | (145) | | | 3 | | — | | | — | | — | | | — | | (42) | | | (187) | |
| Other Portfolio | — | | | — | | 779 | | | 1 | | — | | | — | | (78) | | | 701 | |
| Total net realized gain (loss) | $ | 5,704 | | | 5 | | $ | 779 | | | 1 | | $ | (10,470) | | | 3 | | $ | 51 | | | $ | (3,936) | |
_____________________________
(a)Other activity includes realized gains and losses from transactions involving 15 portfolio companies which are not considered to be significant individually or in the aggregate.
Net Unrealized Appreciation (Depreciation)
The following table provides a summary of the total net unrealized depreciation of $24.7 million for the nine months ended September 30, 2024.
| | | | | | | | | | | | | | | | | | | | | | | | | | | | | |
| Nine Months Ended September 30, 2024 |
| Private
Loan (a) | | LMM (b) | | Middle
Market | | Other | | Total |
| (dollars in thousands) |
| Accounting reversals of net unrealized (appreciation) depreciation recognized in prior periods due to net realized (gains / income) losses recognized during the current period | $ | (25,129) | | | $ | (3,116) | | | $ | 2,998 | | | $ | (56) | | | $ | (25,303) | |
| Net unrealized appreciation (depreciation) relating to portfolio investments | (3,998) | | | 2,349 | | | (1,248) | | | 3,544 | | | 647 | |
| Total net unrealized appreciation (depreciation) relating to portfolio investments | $ | (29,127) | | | $ | (767) | | | $ | 1,750 | | | $ | 3,488 | | | $ | (24,656) | |
_____________________________
(a)The $25.1 million reversal of net unrealized appreciation on the Private Loan investment portfolio is primarily due to a realized gain of $25.5 million on the full exit of one Private Loan portfolio investment.
(b)Includes unrealized appreciation on 28 LMM portfolio investments and unrealized depreciation on 17 LMM portfolio investments.
The following table provides a summary of the total net unrealized appreciation of $46.3 million for the year ended December 31, 2023.
| | | | | | | | | | | | | | | | | | | | | | | | | | | | | |
| Year Ended December 31, 2023 |
| Private
Loan | | LMM(a) | | Middle
Market | | Other | | Total |
| (dollars in thousands) |
| Accounting reversals of net unrealized (appreciation) depreciation recognized in prior periods due to net realized (gains / income) losses recognized during the current period | $ | 18,295 | | | $ | 10,428 | | | $ | 7,785 | | | $ | (2,225) | | | $ | 34,283 | |
| Net unrealized appreciation (depreciation) relating to portfolio investments | (6,144) | | | 20,729 | | | (3,574) | | | 1,025 | | | 12,036 | |
| Total net unrealized appreciation (depreciation) relating to portfolio investments | $ | 12,151 | | | $ | 31,157 | | | $ | 4,211 | | | $ | (1,200) | | | $ | 46,319 | |
_____________________________
(a)Includes unrealized appreciation on 25 LMM portfolio investments and unrealized depreciation on 19 LMM portfolio investments.
The following table provides a summary of the total net unrealized depreciation of $1.7 million for the year ended December 31, 2022.
| | | | | | | | | | | | | | | | | | | | | | | | | | | | | |
| Year Ended December 31, 2022 |
| Private
Loan | | LMM(a) | | Middle
Market | | Other | | Total |
| (dollars in thousands) |
| Accounting reversals of net unrealized (appreciation) depreciation recognized in prior periods due to net realized (gains / income) losses recognized during the current period | $ | 3,212 | | | $ | 1,462 | | | $ | (978) | | | $ | (392) | | | $ | 3,304 | |
| Net unrealized appreciation (depreciation) relating to portfolio investments | (5,997) | | | 4,289 | | | (6,769) | | | 3,471 | | | (5,006) | |
| Total net unrealized appreciation (depreciation) relating to portfolio investments | $ | (2,785) | | | $ | 5,751 | | | $ | (7,747) | | | $ | 3,079 | | | $ | (1,702) | |
_____________________________
(a)Includes unrealized appreciation on 24 LMM portfolio investments and unrealized depreciation on 18 LMM portfolio investments.
Income Tax Benefit (Provision)
The income tax provision for the nine months ended September 30, 2024 of $6.2 million principally consisted of (i) a deferred tax provision of $3.6 million, which is primarily the result of the net activity relating to our portfolio investments held in our Taxable Subsidiaries, including changes in loss carryforwards, changes in net unrealized appreciation/depreciation and other temporary book-tax differences and (ii) a current tax provision of $2.5 million related to a $2.0 million provision for current federal and state income taxes and a $0.5 million provision for excise tax on our estimated undistributed taxable income.
The income tax provision for the nine months ended September 30, 2023 of $3.2 million consisted of (i) a deferred tax provision of $2.2 million, which is primarily the result of the net activity relating to our portfolio investments held in our Taxable Subsidiaries, including changes in loss carryforwards, changes in net unrealized appreciation/depreciation and other temporary book-tax differences and (ii) a current tax provision of $1.0 million related to a $0.6 million provision for current federal and state income taxes and a $0.4 million provision for excise tax on our estimated undistributed taxable income.
The income tax provision for the year ended December 31, 2023 of $3.8 million principally consisted of (i) a deferred tax provision of $2.9 million, which is primarily the result of the net activity relating to our portfolio investments held in our Taxable Subsidiaries, including changes in loss carryforwards, changes in net unrealized appreciation/depreciation and other temporary book-tax differences and (ii) a current tax provision of $0.9 million related to a $0.5 million provision for excise tax on our estimated undistributed taxable income and $0.4 million provision for current U.S. federal and state income taxes.
The income tax provision for the year ended December 31, 2022 of $1.6 million principally consisted of (i) a current tax provision of $1.3 million related to a $0.8 million provision for excise tax on our estimated undistributed taxable income and $0.5 million provision for current U.S. federal and state income taxes and (ii) a deferred tax provision of $0.4 million, which is primarily the result of the net activity relating to our portfolio investments held in our Taxable Subsidiaries, including changes in loss carryforwards, changes in net unrealized appreciation/depreciation, changes in valuation allowance and other temporary book-tax differences.
Net Increase in Net Assets Resulting from Operations
The net increase in net assets resulting from operations for the nine months ended September 30, 2024 was $36.1 million, or $0.90 per share, compared with $44.9 million, or $1.12 per share, during the nine months ended September 30, 2023 (per share amounts adjusted for the Reverse Stock Split on a retrospective basis). The tables above provide a summary of the reasons for the change in net increase in net assets resulting from operations for the nine months ended September 30, 2024 as compared to the nine months ended September 30, 2023.
The net increase in net assets resulting from operations for the year ended December 31, 2023 was $66.2 million, or $1.65 per share, compared with $45.6 million, or $1.14 per share, during the year ended December 31, 2022 (per share amounts adjusted for the Reverse Stock Split on a retrospective basis). The tables above provide a summary of the reasons for the change in net increase in net assets resulting from operations for the year ended December 31, 2023 as compared to the year ended December 31, 2022.
Liquidity and Capital Resources
We anticipate cash to be generated from this offering and other future offerings of securities, and cash flows from operations, including interest earned from the temporary investment of cash in cash equivalents, U.S. government securities and other high-quality debt investments that mature in one year or less. As a BDC, we are permitted, under specified conditions, to issue multiple classes of indebtedness and one class of stock senior to our common stock if our asset coverage, as defined in the 1940 Act, is at least equal to 200% immediately after each such issuance. If we are unable to obtain leverage or raise equity capital on terms that are acceptable to us, our ability to grow our portfolio could be substantially impacted. Furthermore, while any indebtedness and senior securities remain outstanding, we may be required to prohibit any distribution to our stockholders or the repurchase of shares unless we meet the applicable asset coverage ratios at the time of the distribution or repurchase. In connection with borrowings, our lenders, including under our Credit Facilities, may require us to pledge assets, investor commitments to fund capital calls and/or the proceeds of those capital calls. In addition, such lenders may ask us to comply with positive or negative covenants that could have an effect on our operations.
Cash Flows
For the nine months ended September 30, 2024, we realized a net increase in cash and cash equivalents of $18.1 million as the result of $13.4 million of cash used in our operating activities, partially offset by $31.5 million of cash provided by our financing activities.
The $13.4 million of cash used in our operating activities resulted primarily from (i) the funding of new portfolio investments of $253.9 million and (ii) $0.9 million in cash flows related to changes in other assets and liabilities, partially offset by (i) cash proceeds totaling $209.5 million from the sales and repayments of debt investments and sales of and return of capital from equity investments and (ii) cash flows that we generated from the operating profits earned totaling $34.5 million, which is our net investment income, excluding the non-cash effects of the accretion of unearned income, payment-in-kind interest income, cumulative dividends and the amortization expense for deferred financing costs.
The $31.5 million of cash provided by our financing activities principally consisted of (i) $71.0 million net cash borrowings related to our Credit Facilities and (ii) $7.0 million cash proceeds related to common stock issuance, partially offset by (i) $29.7 million in cash dividends paid to stockholders and (ii) $16.8 million for the repurchases of our common stock.
For the year ended December 31, 2023, we realized a net increase in cash and cash equivalents of $9.4 million, which is the net result of $50.2 million of cash provided by our operating activities and $40.8 million of cash used in our financing activities.
The $50.2 million of cash provided by our operating activities resulted primarily from (i) cash proceeds totaling $238.7 million from the sales and repayments of debt investments and sales of and return of capital from equity investments, (ii) cash flows that we generated from the operating profits earned totaling $46.7 million, which is our net investment income, excluding the non-cash effects of the accretion of unearned income, payment-in-kind interest income, cumulative dividends and the amortization expense for deferred financing costs and (iii) cash proceeds of $1.9 million related to changes in other assets and liabilities, partially offset by the funding of new and follow-on portfolio investments of $236.4 million.
The $40.8 million of cash used in our financing activities principally consisted of (i) $36.4 million in cash dividends paid to stockholders, (ii) $24.4 million for the repurchase of common stock and (iii) $2.3 million for deferred financing costs, partially offset by (i) $14.0 million in net borrowings from our Credit Facilities and (ii) $8.5 million net cash proceeds related to our common stock issuances.
For the year ended December 31, 2022, we realized a net decrease in cash and cash equivalents of $4.5 million, which is the net result of $76.7 million of cash provided by our operating activities and $81.2 million of cash used in our financing activities.
The $76.7 million of cash provided by our operating activities resulted primarily from (i) cash proceeds totaling $247.5 million from the sales and repayments of debt investments and sales of and return of capital from equity investments, (ii) cash flows that we generated from the operating profits earned totaling $43.5 million, which is our net investment income, excluding the non-cash effects of the accretion of unearned income, payment-in-kind interest income, cumulative dividends and the amortization expense for deferred financing costs and (iii) cash proceeds of $2.9 million related to changes in other assets and liabilities, partially offset by the funding of new and follow-on portfolio investments of $217.2 million.
The $81.2 million of cash used in our financing activities principally consisted of (i) $105.0 million in net repayments on our Credit Facilities, (ii) $33.0 million in cash dividends paid to stockholders, (iii) $16.0 million for the repurchase of common stock and (iv) $0.1 million for deferred financing costs, partially offset by (i) $72.5 million of cash proceeds from our Series A Notes (defined below) issued in January 2022 and (ii) $0.8 million net cash proceeds related to our common stock issuance.
Share Repurchases
We maintained a quarterly share repurchase program whereby we made quarterly offers to purchase shares at the estimated net asset value (“NAV”) per share, as determined within 48 hours prior to the repurchase date. The amount of shares of our common stock to be repurchased during any calendar quarter was equal to the lesser of (i) the number of shares of common stock we could repurchase with the proceeds we received from the issuance of common stock under our dividend reinvestment plan (the “DRIP”) or (ii) 2.5% of the weighted-average number of shares of common stock outstanding in the prior four calendar quarters. Repurchase offers were limited to the number of shares of our common stock we can repurchase with 90% of the cash retained as a result of issuances of common stock under the DRIP.
On February 5, 2024, we commenced a $2.5 million modified “Dutch Auction” tender offer (the “February 2024 Dutch Auction Tender Offer”) pursuant to the Offer to Purchase, dated February 5, 2024, which expired on March 4, 2024.
On May 17, 2024, we commenced a $2.0 million modified “Dutch Auction” tender offer (the “May 2024 Dutch Auction Tender Offer”) pursuant to the Offer to Purchase, dated May 17, 2024, which expired on June 20, 2024.
In addition to our share repurchase program, during the fiscal year ended December 31, 2023, we used proceeds from the sale of our shares during 2023 to complete three modified “Dutch auction” tender offers, pursuant to which we offered to purchase up to a specified amount of shares of our common stock at the lowest clearing purchase price elected by participating stockholders within a specified range that allowed us to purchase the maximum amount offered. All shares purchased in a “Dutch auction” tender offer were purchased at the clearing purchase price. SEC rules permitted us to increase the number of shares accepted for purchase in any offer by up to 2% of our outstanding shares without amending the offer. For the year ended December 31, 2023, we purchased 633,834 shares of our common stock (amount adjusted for the Reverse Stock Split on a retrospective basis) for $7.8 million through our modified Dutch auction tender offers.
Capital Resources
As of September 30, 2024, we had $48.9 million in cash and cash equivalents and $58.3 million of unused capacity under the Credit Facilities, which we maintain to support our investment and operating activities. As of September 30, 2024, our NAV totaled $618.5 million, or $15.38 per share (as adjusted to reflect the Reverse Stock Split on a retrospective basis).
As of September 30, 2024, we had $147.0 million outstanding and $18.0 million of undrawn commitments under our floating rate multi-year revolving credit facility (the “Corporate Facility”) and $259.7 million outstanding and $40.3 million of undrawn commitments under our special purpose vehicle revolving credit facility (the “SPV Facility” and, together with the Corporate Facility, the “Credit Facilities”), both of which we estimated approximated fair value. Availability under our Credit Facilities is subject to certain leverage and borrowing base limitations, various covenants, reporting requirements and other customary requirements for similar credit facilities. For further information on our Credit Facilities, including key terms and financial covenants, refer to Note D — Debt included in consolidated financial statements include in this prospectus.
As of December 31, 2023, we had $30.8 million in cash and cash equivalents and $129.3 million of unused capacity under the Credit Facilities, which we maintain to support our investment and operating activities. As of December 31, 2023, our NAV totaled $622.3 million, or $15.54 per share (as adjusted to reflect the Reverse Stock Split on a retrospective basis).
As of December 31, 2023, we had $132.0 million outstanding and $33.0 million of undrawn commitments under our Corporate Facility and $203.7 million outstanding and $96.3 million of undrawn commitments under our SPV Facility, both of which we estimated approximated fair value. Availability under our Credit Facilities is subject to certain leverage and borrowing base limitations, various covenants, reporting requirements and other customary requirements for similar credit facilities. In August 2023, the SPV facility was amended to extend the revolving period expiration date from February 3, 2024 to February 3, 2027 and the maturity date from February 3, 2025 to February 3, 2028. Additionally, total commitments were reduced from $325.0 million to $300.0 million. For further information on our Credit Facilities, including key terms and financial covenants, refer to Note D — Debt included in consolidated financial statements and Supplementary Data included in this prospectus.
In October 2021, we issued $77.5 million in aggregate principal amount of our 4.04% Series A Senior Notes due 2026 (the “Series A Notes”), and we issued an additional $72.5 million of Series A Notes in January 2022, all of which were issued pursuant to a master note purchase agreement, dated October 22, 2021 (the “Note Purchase Agreement”) and remained outstanding as of September 30, 2024. The 4.04% Series A Senior Notes bear a fixed interest rate of 4.04% per year and will mature on October 30, 2026, unless redeemed, purchased or prepaid prior to such date by us in accordance with their terms.
Interest on the 4.04% Series A Senior Notes is due semiannually on April 30 and October 30 each year, beginning on April 30, 2022. The 4.04% Series A Senior Notes may be redeemed in whole or in part at any time or from time to time at our option at par plus accrued interest to the prepayment date and, if applicable, a make-whole premium. In addition, we are obligated to offer to prepay the 4.04% Series A Senior Notes at par plus accrued and unpaid interest up to, but excluding, the date of prepayment, if certain change in control events occur. The 4.04% Series A Senior Notes are general unsecured obligations of the Company that rank pari passu with all outstanding and future unsecured unsubordinated indebtedness issued by us.
The Note Purchase Agreement contains customary terms and conditions for senior unsecured notes issued in a private placement, including covenants that we will maintain a minimum asset coverage ratio of 2.00 to 1.00, subject to reduction to 1.50 to 1.00 upon certain notice requirements, a minimum interest coverage ratio of 2.00 to 1.00, which may be reduced to 1.25 to 1.00 under certain conditions, and a minimum unsecured debt coverage ratio of 1.25 to 1.00. In addition, in the event that a Below Investment Grade Event (as defined in the Note Purchase Agreement) occurs, the Series A Notes will bear interest at a fixed rate of 5.04% per year from the date of the occurrence of the Below Investment Grade Event to and until the date on which the Below Investment Grade Event is no longer continuing.
For more information on our Series A Notes, including key terms and financial covenants, refer to Note D — Debt included in consolidated financial statements and Supplementary Data included this prospectus.
During the years ended December 31, 2023 and 2022, on certain dividend payment dates we sold shares of our common stock to Main Street at the price at which we issued new shares in connection with reinvestments of dividends pursuant to the DRIP. In each of these transactions, the issuance and sale of shares were exempt from registration under Section 4(a)(2) of the Securities Act of 1933, as amended (the “Securities Act”), and were unanimously approved by our board of directors, including each director who is not an “interested person,” as such term is defined in Section 2(a)(19) of the 1940 Act, of the Company or our Adviser. During the year ended December 31, 2023, we sold 1,080,185 shares to Main Street at a weighted-average price of $7.87 for total proceeds, prior to payment of expenses, of $8.5 million. During the year ended December 31, 2022, we sold 94,697 shares to Main Street Capital Corporation (“Main Street”) at a price of $7.92 for total proceeds, prior to payment of expenses, of $0.8 million.
We closed our continuous follow-on public offering of shares to new investors effective September 2017. As such, our ability to raise additional equity is limited.
As a BDC, we generally are required to maintain a coverage ratio, or BDC asset coverage ratio, of total assets to total senior securities, which include borrowings and any preferred stock we may issue in the future, of at least 200% (or 150% if certain requirements are met in the future). This requirement limits the amount that we may borrow. As of September 30, 2024, our BDC asset coverage ratio was 211%. As of December 31, 2023, our BDC asset coverage ratio was 228%. The combination of these factors limits our access to capital to fund future investment activities or operating requirements, including our ability to grow the Investment Portfolio. We anticipate that we will continue to fund our investment activities and operating requirements through existing cash and cash equivalents, cash flows generated through our ongoing operating activities, including cash proceeds from the repayments and from the sales of investments in our portfolio companies, and utilization of available borrowings under our Credit Facilities. Our primary uses of funds will be investments in portfolio companies, operating expenses, cash distributions to holders of our common stock and share repurchases under our share repurchase programs.
We periodically invest excess cash balances into marketable securities and idle funds investments. The primary investment objective of marketable securities and idle funds investments is to generate incremental cash returns on excess cash balances prior to utilizing those funds for investment in our Private Loan and LMM portfolio investments. Marketable securities and idle funds investments generally consist of money market funds and certificates of deposit with financial institutions.
In order to satisfy the Code requirements applicable to a RIC, we intend to distribute to our stockholders, after consideration and application of our ability under the Code to carry forward certain excess undistributed taxable income from one tax year into the next tax year, substantially all of our taxable income.
Although we have been able to secure access to additional liquidity, including through the Credit Facilities and the Note Purchase Agreement, there is no assurance that debt or equity capital will be available to us in the future on favorable terms, or at all.
Recently Issued or Adopted Accounting Standards
From time to time, new accounting pronouncements are issued by the Financial Accounting Standards Board or other standards setting bodies that are adopted by us as of the specified effective date. We believe that the impact of recently issued standards and any that are not yet effective will not have a material impact on our consolidated financial statements upon adoption. For a description of recently issued or adopted accounting standards, see Note B.11 – Summary of Significant Accounting Policies – Recently Issued or Adopted Accounting Standards included in the consolidated financial statements included in this prospectus.
Inflation
Inflation has not historically had a significant effect on our results of operations in any of the reporting periods presented herein. However, our portfolio companies have experienced, specifically including over the last few years, as a result of recent geopolitical events, supply chain and labor issues, and may continue to experience, the increasing impacts of inflation on their operating results, including periodic escalations in their costs for labor, raw materials and third-party services and required energy consumption. These issues and challenges related to inflation are receiving significant attention from our investment teams and the management teams of our portfolio companies as we work to manage these growing challenges. Prolonged or more severe impacts of inflation to our portfolio companies could continue to affect their operating profits and, thereby, increase their borrowing costs, and as a result negatively impact their ability to service their debt obligations and/or reduce their available cash for distributions. In addition, these factors could have a negative effect on the fair value of our investments in these portfolio companies. The combined impacts therefrom in turn could negatively affect our results of operations.
Off-Balance Sheet Arrangements
We may be a party to financial instruments with off-balance sheet risk in the normal course of business to meet the financial needs of our portfolio companies. These instruments include commitments to extend credit and fund equity capital and involve, to varying degrees, elements of liquidity and credit risk in excess of the amount recognized in the Consolidated Balance Sheets. As of September 30, 2024, we had a total of $73.5 million in outstanding commitments comprised of (i) 69 commitments to fund revolving loans that had not been fully drawn or term loans with additional commitments not yet funded and (ii) two equity capital commitments that had not been fully called. At December 31, 2023, we had a total of $70.8 million in outstanding commitments comprised of (i) 66 investments with commitments to fund revolving loans that had not been fully drawn or term loans with additional commitments not yet funded and (ii) three investments with equity capital commitments that had not been fully called. At December 31, 2022, we had a total of $67.5 million in outstanding commitments comprised of (i) 69 investments with commitments to fund revolving loans that had not been fully drawn or term loans with additional commitments not yet funded and (ii) three investments with equity capital commitments that had not been fully called.
Contractual Obligations
As of September 30, 2024, we had $556.7 million in total borrowings outstanding under our Credit Facilities and Series A Notes. The Corporate Facility was scheduled to mature on March 1, 2026. See Note K — Subsequent Events included in the interim consolidated financial statements in this prospectus and Management’s Discussion and Analysis of Financial Conditions and Results of Operations – Recent Developments. The SPV Facility will mature on February 3, 2028. The Series A Notes will mature on October 30, 2026. See further discussion of the terms of our Credit Facilities, Series A Notes and other debt in Note D – Debt included in the consolidated financial statements in this prospectus.
A summary of our significant contractual payment obligations for the repayment of outstanding borrowings at September 30, 2024 is as follows:
| | | | | | | | | | | | | | | | | | | | | | | | | | | | | | | | | | | | | | | | | |
| 2024 | | 2025 | | 2026 | | 2027 | | 2028 | | Thereafter | | Total |
| (dollars in thousands) |
SPV Facility(1) | $ | — | | | $ | — | | | $ | — | | | $ | — | | | $ | 259,688 | | | $ | — | | | $ | 259,688 | |
| Series A Notes | — | | | — | | | 150,000 | | | — | | | — | | | — | | | 150,000 | |
| Interest due on Series A Notes | 3,030 | | | 6,060 | | | 6,060 | | | — | | | — | | | — | | | 15,150 | |
Corporate Facility(2) | — | | | — | | | 147,000 | | | — | | | — | | | — | | | 147,000 | |
| Total | $ | 3,030 | | | $ | 6,060 | | | $ | 303,060 | | | $ | — | | | $ | 259,688 | | | $ | — | | | $ | 571,838 | |
_____________________________(1)As of September 30, 2024, $40.3 million remained available to borrow under the SPV Facility; however, our borrowing ability is limited to leverage and borrowing base restrictions imposed by the SPV Facility and the 1940 Act, as discussed above.
(2)As of September 30, 2024, $18.0 million remained available to borrow under the Corporate Facility; however, our borrowing ability is limited to leverage and borrowing base restrictions imposed by the Corporate Facility and the 1940 Act, as discussed above.
Related Party Transactions and Agreements
We have entered into agreements with our Adviser and/or certain of its affiliates and other parties whereby we pay certain fees and reimbursements to these entities. These included payments for fees and for reimbursement of offering costs and for the actual cost of the personnel of the Adviser or its affiliates performing the functions of chief financial officer and chief compliance officer and other personnel of the Adviser or its affiliates engaged to provide day-to-day administrative and non-advisory management services or professional services for us in-house (including legal services, tax services, internal audit services, technology-related services and services in connection with compliance with federal and state laws) including, without limitation, direct compensation costs, including the allocable portion of salaries, bonuses, benefits and other direct costs associated therewith) and related overhead costs, including rent, allocated by the Adviser to us in a reasonable manner, without markup. In addition, we make payments for certain services that include the identification, execution and management of our investments and also the management of our day-to-day operations provided to us by our Adviser, pursuant to various agreements that we have entered into.
Recent Developments
On November 1, 2024, we repurchased 512,730 shares of our common stock validly tendered and not withdrawn on the terms set forth in the tender offer statement on Schedule TO and Offer to Purchase filed with the SEC on September 26, 2024. We repurchased the shares at a price of $7.74 per share, which was our NAV per share as of November 1, 2024 (without giving effect to the Reverse Stock Split), for an aggregate purchase price of $4.0 million (an amount equal to 90% of the proceeds we received from the issuance of shares under our DRIP from the November 1, 2024 dividend payment).
On November 8, 2024, we entered into an amendment to the Corporate Facility to, among other things: (i) extend the revolving period from September 2025 to November 2028, (ii) extend the final maturity date from March 2026 to May 2029 and (iii) reduce the interest rate, subject to our election to (a) SOFR plus 2.05% or (b) the base rate plus 1.05%.
On November 13, 2024, our Board of Directors declared a quarterly dividend of $0.36 per share (as adjusted to reflect the Reverse Stock Split effected on December 16, 2024) payable on January 31, 2025 to stockholders of record as of December 31, 2024.
At a special meeting of stockholders held on December 11, 2024, our stockholders approved a series of proposals that we believe will position us to potentially effect a listing of our shares of common stock on a national securities exchange (such as the New York Stock Exchange) (a “Listing”) if and when market conditions make it desirable to do so and it is otherwise in our best interest. On November 13, 2024, our Board of directors, including the independent directors, unanimously approved suspending our quarterly share repurchase program in anticipation of a Listing and the opportunity for enhanced liquidity a Listing is expected to provide our stockholders. We expect that the quarterly share repurchase program will ultimately terminate upon a Listing; however, our board of directors has authorized us to repurchase shares of our common stock through an open-market share repurchase program for up to $65.0 million in the aggregate of shares of our common stock for a 12-month period starting on a date determined by the Company following the consummation of this offering. Pursuant to such authorization, in connection with or shortly after the closing of this offering, we intend to enter into the Company Rule 10b5-1 Stock Repurchase Plan to facilitate the repurchase of up to $65.0 million in shares of our common stock authorized under the share repurchase program, in accordance with the guidelines specified in Rule 10b-18 and Rule 10b5-1 of the Exchange Act.
On December 16, 2024, we effectuated the Reverse Stock Split. As a result of the Reverse Stock Split, every two shares of our issued and outstanding common stock were converted into one share of issued and outstanding common stock, without any change in the par value per share or the number of authorized shares of our common stock.
Quantitative and Qualitative Disclosures about Market Risk
We are subject to financial market risks, including changes in interest rates, and changes in interest rates may affect both our interest expense on the debt outstanding under our Credit Facilities and our interest income from portfolio investments. Our risk management systems and procedures are designed to identify and analyze our risk, to set appropriate policies and limits and to continually monitor these risks. Our investment income will be affected by changes in various interest rate indices, including Secured Overnight Financing Rate (“SOFR”) and Prime rates, to the extent that any debt investments include floating interest rates. See Risk Factors — Risks Related to our Business and Structure — We are subject to risks associated with the interest rate environment and changes in interest rates will affect our cost of capital, net investment income and the value of our investments. and Risk Factors — Risks Related to Leverage — Because we borrow money, the potential for gain or loss on amounts invested in us is magnified and may increase the risk of investing in us included in this prospectus for more information regarding risks associated with our debt investments and borrowings that utilize SOFR or Prime as a reference rate.
The majority of our debt investments are made with either fixed interest rates or floating rates that are subject to contractual minimum interest rates for the term of the investment. As of September 30, 2024, 77% of our debt Investment Portfolio (at cost) bore interest at floating rates, 96% of which were subject to contractual minimum interest rates. As of September 30, 2024, 27% of our debt obligations bore interest at fixed rates. Our interest expense will be affected by changes in the published SOFR rate in connection with our Credit Facilities; however, the interest rates on our outstanding Series A Notes are fixed for the life of such debt. As of September 30, 2024, we had not entered into any interest rate hedging arrangements. Due to our limited use of derivatives, we have claimed an exclusion from the definition of the term “commodity pool operator” under the Commodity Exchange Act and, therefore, are not subject to registration or regulation as a pool operator under such Act. The Company expects to operate as a “limited derivatives user” under Rule 18f-4 under the 1940 Act.
The following table shows the approximate annualized increase or decrease in the components of net investment income due to hypothetical base rate changes in interest rates, assuming no changes in our investments and borrowings as of September 30, 2024. The pro forma changes in incentive fee expense are calculated based upon the actual incentive fee expense for the third quarter of 2024 on an annualized basis, as adjusted for the pro forma changes in Pre-Incentive Fee Net Investment Income.
| | | | | | | | | | | | | | | | | | | | | | | | | | | | | | | | | | | | | | |
| Basis Point Change | | Increase
(Decrease)
in Interest
Income | | (Increase)
Decrease
in Interest
Expense | | Increase
(Decrease) in Pre Incentive Fee Net
Investment
Income | | (Increase) Decrease in Incentive Fee Expense | | Increase (Decrease) in Net Investment Income | | Increase
(Decrease) in Net
Investment
Income per Share* |
| | (dollars in thousands, except per share amounts) |
| (200) | | $ | (14,441) | | | $ | 8,134 | | | $ | (6,307) | | | $ | 6,307 | | | $ | — | | | $ | — | |
| (175) | | (12,616) | | | 7,117 | | | (5,499) | | | 5,499 | | | — | | | — | |
| (150) | | (10,810) | | | 6,100 | | | (4,710) | | | 4,710 | | | — | | | — | |
| (125) | | (9,004) | | | 5,084 | | | (3,920) | | | 3,920 | | | — | | | — | |
| (100) | | (7,197) | | | 4,067 | | | (3,130) | | | 3,130 | | | — | | | — | |
| (75) | | (5,394) | | | 3,050 | | | (2,344) | | | 2,344 | | | — | | | — | |
| (50) | | (3,596) | | | 2,033 | | | (1,563) | | | 1,563 | | | — | | | — | |
| (25) | | (1,798) | | | 1,017 | | | (781) | | | 781 | | | — | | | — | |
| 25 | | 1,798 | | | (1,017) | | | 781 | | | (781) | | | — | | | — | |
| 50 | | 3,598 | | | (2,033) | | | 1,565 | | | (1,565) | | | — | | | — | |
| 75 | | 5,399 | | | (3,050) | | | 2,349 | | | (2,349) | | | — | | | — | |
| 100 | | 7,201 | | | (4,067) | | | 3,134 | | | (3,134) | | | — | | | — | |
| 125 | | 9,002 | | | (5,084) | | | 3,918 | | | (3,918) | | | — | | | — | |
| 150 | | 10,804 | | | (6,100) | | | 4,704 | | | (4,704) | | | — | | | — | |
| 175 | | 12,605 | | | (7,117) | | | 5,488 | | | (5,488) | | | — | | | — | |
| 200 | | 14,407 | | | (8,134) | | | 6,273 | | | (5,765) | | | 508 | | | 0.02 | |
* Adjusted to reflect the Reverse Stock Split.
Although we believe that this analysis is indicative of the impact of interest rate changes to our Net Investment Income as of September 30, 2024, the analysis does not take into consideration future changes in the credit market, credit quality, any changes to our Current Investment Advisory Agreement or other business or economic developments that could affect our Net Investment Income. Accordingly, we can offer no assurances that actual results would not differ materially from the analysis above. The hypothetical results assume that all SOFR and Prime rate changes would be effective on the first day of the period. However, the contractual SOFR and Prime rate reset dates would vary throughout the period. The majority of our investments are based on contracts which reset quarterly while our Corporate Facility and our SPV Facility reset on a monthly and quarterly basis, respectively. The hypothetical results would also be impacted by the changes in the amount of debt outstanding under our Credit Facilities (with an increase (decrease) in the debt outstanding under the Credit Facilities resulting in an (increase) decrease in the hypothetical interest expense).
PORTFOLIO COMPANIES
The following table sets forth certain unaudited information as of September 30, 2024 (dollars in thousands), for the portfolio companies in which we had a debt or equity investment. Other than these investments, our only formal relationships with our portfolio companies are the managerial assistance ancillary to our investments and the board observer or participation rights we may receive. As of September 30, 2024, none of our portfolio company investments constituted five percent or more of our total assets. The following table excludes our investments in marketable securities and idle funds investments.
| | | | | | | | | | | | | | | | | | | | | | | | | | | | | | | | | | | | | | | | | | | | | | | | | | |
| Portfolio Company (1) (20) | | Business Description | Type of Investment (2) (3) (15) | | Investment Date (22) | Shares/Units | Total Rate | Reference Rate and Spread (25) | PIK Rate (19) | Maturity Date | Percentage of Class Held (35) | Principal (4) | Cost (4) | Fair Value (18) | Percentage of Net Assets |
| Control Investments (5) | | | | | | | | | | | | | | | | |
Copper Trail Fund Investments 1999 Broadway, Suite 850 Denver, CO 80202 | (12) (13) | Investment Partnership | | | | | | | | | | | | | | |
| | | LP Interests (CTMH, LP) | (24) | 7/17/2017 | 39.0% | | | | | | 38.8 | % | | $ | 655 | | $ | 530 | | 0.1 | % |
| | | | | | | | | | | | | | | | |
GRT Rubber Technologies LLC 201 Dana Drive Paragould, AR 72450 | | Manufacturer of Engineered Rubber Products | | | | | | | | | | | | | | |
| | | Secured Debt | | 12/21/2018 | | 11.35% | SF+ | 6.00% | | 10/29/2026 | | 1,550 | | 1,536 | | 1,550 | | 0.3 | % |
| | | Secured Debt | | 12/19/2014 | | 13.35% | SF+ | 8.00% | | 10/29/2026 | | 19,944 | | 19,841 | | 19,944 | | 3.2 | % |
| | | Member Units | (8) | 12/19/2014 | 2,896 | | | | | | 28.8 | % | | 6,435 | | 21,890 | | 3.5 | % |
| | | | | | | | | | | | | | 27,812 | | 43,384 | | 7.0 | % |
Harris Preston Fund Investments 1221 S. Mopac Expy, Suite 260 Austin, TX 78746 | (12) (13) | Investment Partnership | | | | | | | | | | | | | | |
| | | LP Interests (2717 MH, L.P.) | (8) (24) | 10/1/2017 | 49.0% | | | | | | 49.3 | % | | 3,345 | | 8,819 | | 1.4 | % |
| | | | | | | | | | | | | | | | |
Volusion, LLC 2028E Ben White Blvd Ste 240 #1835 Austin TX 78741 | | Provider of Online Software-as-a-Service eCommerce Solutions | | | | | | | | | | | | | | |
| | | Secured Debt | | 3/31/2023 | | 10.00% | | | | 3/31/2025 | | 900 | | 900 | | 900 | | 0.1 | % |
| | | Preferred Member Units | | 3/31/2023 | 2,184,683 | | | | | | 30.0 | % | | 1,901 | | 3,200 | | 0.5 | % |
| | | Preferred Member Units | | 3/31/2023 | 61,077 | | | | | | 30.0 | % | | — | | — | | 0.0 | % |
| | | Preferred Member Units | | 1/26/2015 | 2,090,001 | | | | | | 30.0 | % | | 6,000 | | — | | 0.0 | % |
| | | Common Stock | | 3/31/2023 | 772,620 | | | | | | 4.5 | % | | 1,104 | | — | | 0.0 | % |
| | | | | | | | | | | | | | 9,905 | | 4,100 | | 0.7 | % |
Subtotal Control Investments (9.2% of net assets at fair value) | | | | | | | | | | | | | | $ | 41,717 | | $ | 56,833 | | 9.2 | % |
| Affiliate Investments (6) | | | | | | | | | | | | | | | | |
Analytical Systems Keco Holdings, LLC 9515 Windfern Road Houston, TX 77064 | | Manufacturer of Liquid and Gas Analyzers | | | | | | | | | | | | | | |
| | | Secured Debt | (30) | 8/16/2019 | | | | | | 8/16/2029 | | $ | — | | $ | — | | $ | — | | 0.0 | % |
| | | Secured Debt | | 8/16/2019 | | 13.75% | | | | 8/16/2029 | | 1,036 | | 1,024 | | 1,024 | | 0.2 | % |
| | | Preferred Member Units | | 5/20/2021 | 607 | | | | | | 16.2 | % | | 607 | | 1,430 | | 0.2 | % |
| | | Preferred Member Units | | 8/16/2019 | 800 | | | | | | 15.4 | % | | 800 | | — | | 0.0 | % |
| | | Warrants | (27) | 8/16/2019 | 105 | | | | | 8/16/2029 | 0.9 | % | | 79 | | — | | 0.0 | % |
| | | | | | | | | | | | | | 2,510 | | 2,454 | | 0.4 | % |
| | | | | | | | | | | | | | | | | | | | | | | | | | | | | | | | | | | | | | | | | | | | | | | | | | |
| Portfolio Company (1) (20) | | Business Description | Type of Investment (2) (3) (15) | | Investment Date (22) | Shares/Units | Total Rate | Reference Rate and Spread (25) | PIK Rate (19) | Maturity Date | Percentage of Class Held (35) | Principal (4) | Cost (4) | Fair Value (18) | Percentage of Net Assets |
Barfly Ventures, LLC 1575 Arboretum Drive SE Suite 404 Grand Rapids, MI 49546 | (10) | Casual Restaurant Group | | | | | | | | | | | | | | |
| | | Member Units | | 10/26/2020 | 12 | | | | | | 12.3 | % | | 528 | | 1,787 | | 0.3 | % |
| | | | | | | | | | | | | | | | |
Batjer TopCo, LLC 2825 Pine Street Abilene, TX 79601 | | HVAC Mechanical Contractor | | | | | | | | | | | | | | |
| | | Secured Debt | | 3/7/2022 | | 10.00% | | | | 3/7/2027 | | 50 | | 49 | | 49 | | 0.0 | % |
| | | Secured Debt | | 3/7/2022 | | 10.00% | | | | 3/7/2027 | | 30 | | 30 | | 30 | | 0.0 | % |
| | | Secured Debt | | 3/7/2022 | | 10.00% | | | | 3/7/2027 | | 1,175 | | 1,164 | | 1,164 | | 0.2 | % |
| | | Preferred Stock | (8) | 3/7/2022 | 453 | | | | | | 10.0 | % | | 455 | | 570 | | 0.1 | % |
| | | | | | | | | | | | | | 1,698 | | 1,813 | | 0.3 | % |
Brewer Crane Holdings, LLC 12570 Highway 67 Lakeside, CA 92040 | | Provider of Crane Rental and Operating Services | | | | | | | | | | | | | | |
| | | Secured Debt | (9) | 1/9/2018 | | 15.35% | SF+ | 10.00% | | 1/9/2025 | | 1,285 | | 1,285 | | 1,285 | | 0.2 | % |
| | | Preferred Member Units | (8) | 1/9/2018 | 737 | | | | | | 15.6 | % | | 1,070 | | 1,360 | | 0.2 | % |
| | | | | | | | | | | | | | 2,355 | | 2,645 | | 0.4 | % |
Centre Technologies Holdings, LLC 16801 Greenspoint Park Drive, Suite 200 Houston, TX 77060 | | Provider of IT Hardware Services and Software Solutions | | | | | | | | | | | | | | |
| | | Secured Debt | (9) (30) | 1/4/2019 | | | SF+ | 10.00% | | 1/4/2028 | | — | | — | | — | | 0.0 | % |
| | | Secured Debt | (9) | 1/4/2019 | | 15.35% | SF+ | 10.00% | | 1/4/2028 | | 5,116 | | 5,062 | | 5,116 | | 0.8 | % |
| | | Preferred Member Units | | 1/4/2019 | 3,327 | | | | | | 16.5 | % | | 1,531 | | 2,990 | | 0.5 | % |
| | | | | | | | | | | | | | 6,593 | | 8,106 | | 1.3 | % |
Chamberlin Holding LLC 4545 Langfield Rd Houston, TX 77040 | | Roofing and Waterproofing Specialty Contractor | | | | | | | | | | | | | | |
| | | Secured Debt | (9) (30) | 2/26/2018 | | | SF+ | 6.00% | | 2/26/2026 | | — | | (32) | | — | | 0.0 | % |
| | | Secured Debt | (9) | 2/26/2018 | | 13.36% | SF+ | 8.00% | | 2/26/2026 | | 3,905 | | 3,904 | | 3,905 | | 0.6 | % |
| | | Member Units | (8) | 2/26/2018 | 1,087 | | | | | | 10.9 | % | | 2,860 | | 7,630 | | 1.2 | % |
| | | Member Units | (8) (23) | 11/2/2018 | 261,786 | | | | | | 11.4 | % | | 443 | | 805 | | 0.1 | % |
| | | | | | | | | | | | | | 7,175 | | 12,340 | | 2.0 | % |
Charps, LLC 453 Tower Street NW Clearbrook, MN 56634 | | Pipeline Maintenance and Construction | | | | | | | | | | | | | | |
| | | Preferred Member Units | (8) | 2/3/2017 | 457 | | | | | | 20.0 | % | | 491 | | 3,900 | | 0.6 | % |
| | | | | | | | | | | | | | | | |
Clad-Rex Steel, LLC 11500 W King Street Franklin Park, IL 60131 | | Specialty Manufacturer of Vinyl-Clad Metal | | | | | | | | | | | | | | |
| | | Secured Debt | (30) | 10/28/2022 | | | | | | 1/15/2027 | | — | | — | | — | | 0.0 | % |
| | | Secured Debt | | 12/20/2016 | | 10.00% | | | | 1/15/2027 | | 1,790 | | 1,783 | | 1,783 | | 0.3 | % |
| | | Secured Debt | | 12/20/2016 | | 10.00% | | | | 12/20/2036 | | 246 | | 244 | | 244 | | 0.0 | % |
| | | Member Units | (8) | 12/20/2016 | 179 | | | | | | 14.6 | % | | 1,820 | | 2,210 | | 0.4 | % |
| | | Member Units | (23) | 12/20/2016 | 200 | | | | | | 20.0 | % | | 127 | | 237 | | 0.0 | % |
| | | | | | | | | | | | | | 3,974 | | 4,474 | | 0.7 | % |
Cody Pools, Inc. 101 E. Old Settlers Blvd, #200 Round Rock, TX 78664 | | Designer of Residential and Commercial Pools | | | | | | | | | | | | | | |
| | | Secured Debt | (30) | 3/6/2020 | | | | | | 12/17/2026 | | — | | (3) | | — | | 0.0 | % |
| | | | | | | | | | | | | | | | | | | | | | | | | | | | | | | | | | | | | | | | | | | | | | | | | | |
| Portfolio Company (1) (20) | | Business Description | Type of Investment (2) (3) (15) | | Investment Date (22) | Shares/Units | Total Rate | Reference Rate and Spread (25) | PIK Rate (19) | Maturity Date | Percentage of Class Held (35) | Principal (4) | Cost (4) | Fair Value (18) | Percentage of Net Assets |
| | | Secured Debt | | 3/6/2020 | | 12.50% | | | | 12/17/2026 | | 6,712 | | 6,698 | | 6,712 | | 1.1 | % |
| | | Preferred Member Units | (8) (23) | 3/6/2020 | 147 | | | | | | 20.0 | % | | 2,079 | | 17,490 | | 2.8 | % |
| | | | | | | | | | | | | | 8,774 | | 24,202 | | 3.9 | % |
Colonial Electric Company LLC 4444 Solomons Island Road Harwood, MD 20776 | | Provider of Electrical Contracting Services | | | | | | | | | | | | | | |
| | | Secured Debt | (30) | 3/31/2021 | | | | | | 3/31/2026 | | — | | — | | — | | 0.0 | % |
| | | Secured Debt | | 3/31/2021 | | 12.00% | | | | 3/31/2026 | | 4,056 | | 4,025 | | 4,056 | | 0.7 | % |
| | | Preferred Member Units | (8) | 3/31/2021 | 4,320 | | | | | | 17.0 | % | | 1,920 | | 3,280 | | 0.5 | % |
| | | | | | | | | | | | | | 5,945 | | 7,336 | | 1.2 | % |
Compass Systems & Sales, LLC 5185 New Haven Circle NW Barberton, OH 44203 | | Designer of End-to-End Material Handling Solutions | | | | | | | | | | | | | | |
| | | Secured Debt | (30) | 11/22/2023 | | | | | | 11/22/2028 | | — | | (17) | | (17) | | 0.0 | % |
| | | Secured Debt | | 11/22/2023 | | 13.50% | | | | 11/22/2028 | | 4,300 | | 4,194 | | 4,194 | | 0.7 | % |
| | | Preferred Equity | | 11/22/2023 | 1,863 | | | | | | 20.0 | % | | 1,863 | | 1,980 | | 0.3 | % |
| | | | | | | | | | | | | | 6,040 | | 6,157 | | 1.0 | % |
Datacom, LLC 100 Enterprise Boulevard Lafeyette, LA 70506 | | Technology and Telecommunications Provider | | | | | | | | | | | | | | |
| | | Secured Debt | | 3/1/2022 | | 7.50% | | | | 12/31/2025 | | 40 | | 39 | | 39 | | 0.0 | % |
| | | Secured Debt | | 3/31/2021 | | 10.00% | | | | 12/31/2025 | | 906 | | 881 | | 845 | | 0.1 | % |
| | | Preferred Member Units | | 3/31/2021 | 1,000 | | | | | | 8.0 | % | | 290 | | 40 | | 0.0 | % |
| | | | | | | | | | | | | | 1,210 | | 924 | | 0.1 | % |
Digital Products Holdings LLC 900 N 23rd Street St. Louis, MO 63106 | | Designer and Distributor of Consumer Electronics | | | | | | | | | | | | | | |
| | | Secured Debt | (9) | 4/1/2018 | | 15.25% | SF+ | 10.00% | | 4/27/2026 | | 3,237 | | 3,220 | | 3,203 | | 0.5 | % |
| | | Preferred Member Units | (8) | 4/1/2018 | 964 | | | | | | 20.0 | % | | 2,375 | | 2,459 | | 0.4 | % |
| | | | | | | | | | | | | | 5,595 | | 5,662 | | 0.9 | % |
Direct Marketing Solutions, Inc. 8534 NE Alderwood Road Portland, OR 97220 | | Provider of Omni-Channel Direct Marketing Services | | | | | | | | | | | | | | |
| | | Secured Debt | (30) | 2/13/2018 | | | | | | 2/13/2026 | | — | | (2) | | — | | 0.0 | % |
| | | Secured Debt | | 12/27/2022 | | 14.00% | | | | 2/13/2026 | | 4,751 | | 4,735 | | 4,751 | | 0.8 | % |
| | | Preferred Stock | | 2/13/2018 | 2,100 | | | | | | 20.0 | % | | 2,100 | | 4,820 | | 0.8 | % |
| | | | | | | | | | | | | | 6,833 | | 9,571 | | 1.5 | % |
Flame King Holdings, LLC 2250 S Tubeway Avenue Commerce, CA 90040 | | Propane Tank and Accessories Distributor | | | | | | | | | | | | | | |
| | | Preferred Equity | (8) | 10/29/2021 | 2,340 | | | | | | 20.0 | % | | 2,600 | | 8,940 | | 1.4 | % |
| | | | | | | | | | | | | | | | |
Freeport Financial Funds 200 S Wacker Drive, Suite 750 Chicago, IL 60606 | (12) (13) | Investment Partnership | | | | | | | | | | | | | | |
| | | LP Interests (Freeport First Lien Loan Fund III LP) | (8) (24) | 7/31/2015 | 6.0% | | | | | | 6.0 | % | | 2,155 | | 1,893 | | 0.3 | % |
| | | | | | | | | | | | | | | | |
| | | | | | | | | | | | | | | | | | | | | | | | | | | | | | | | | | | | | | | | | | | | | | | | | | |
| Portfolio Company (1) (20) | | Business Description | Type of Investment (2) (3) (15) | | Investment Date (22) | Shares/Units | Total Rate | Reference Rate and Spread (25) | PIK Rate (19) | Maturity Date | Percentage of Class Held (35) | Principal (4) | Cost (4) | Fair Value (18) | Percentage of Net Assets |
Gamber-Johnson Holdings, LLC 5001 Joerns Drive Stevens Point, WI 54481 | | Manufacturer of Ruggedized Computer Mounting Systems | | | | | | | | | | | | | | |
| | | Secured Debt | (9) (29) (30) | 6/24/2016 | | | SF+ | 7.00% | | 1/1/2028 | | — | | — | | — | | 0.0 | % |
| | | Secured Debt | (9) (29) | 12/15/2022 | | 10.00% | SF+ | 7.00% | | 1/1/2028 | | 12,120 | | 11,986 | | 12,120 | | 2.0 | % |
| | | Member Units | (8) | 6/24/2016 | 2,261 | | | | | | 17.7 | % | | 4,423 | | 26,840 | | 4.3 | % |
| | | | | | | | | | | | | | 16,409 | | 38,960 | | 6.3 | % |
GFG Group, LLC 1138 146th Avenue Wayland, MI 49348 | | Grower and Distributor of a Variety of Plants and Products to Other Wholesalers, Retailers and Garden Centers | | | | | | | | | | | | | | |
| | | Secured Debt | | 3/31/2021 | | 8.00% | | | | 3/31/2026 | | 2,046 | | 2,027 | | 2,046 | | 0.3 | % |
| | | Preferred Member Units | (8) | 3/31/2021 | 56 | | | | | | 20.0 | % | | 1,225 | | 2,640 | | 0.4 | % |
| | | | | | | | | | | | | | 3,252 | | 4,686 | | 0.8 | % |
Gulf Publishing Holdings, LLC 8 Greenway Plaza, Suite 1440 Houston, TX 77046 | | Energy Industry Focused Media and Publishing | | | | | | | | | | | | | | |
| | | Secured Debt | (9) (14) (30) | 9/29/2017 | | | SF+ | 9.50% | | 7/1/2027 | | — | | — | | — | | 0.0 | % |
| | | Secured Debt | (14) | 7/1/2022 | | 12.50% | | | 12.50% | 7/1/2027 | | 600 | | 600 | | 351 | | 0.1 | % |
| | | Preferred Equity | | 7/1/2022 | 15,930 | | | | | | 20.0 | % | | 1,400 | | — | | 0.0 | % |
| | | Member Units | | 4/29/2016 | 920 | | | | | | 0.9 | % | | 920 | | — | | 0.0 | % |
| | | | | | | | | | | | | | 2,920 | | 351 | | 0.1 | % |
Harris Preston Fund Investments 1221 S. Mopac Expy, Suite 260 Austin, TX 78746 | (12) (13) | Investment Partnership | | | | | | | | | | | | | | |
| | | LP Interests (HPEP 3, L.P.) | (8) (24) | 8/9/2017 | 8.0% | | | | | | 8.2 | % | | 2,296 | | 4,472 | | 0.7 | % |
| | | | | | | | | | | | | | | | |
IG Investor, LLC 177 Georgia Avenue Providence, RI 02905 | | Military and Other Tactical Gear | | | | | | | | | | | | | | |
| | | Secured Debt | | 6/21/2023 | | 13.00% | | | | 6/21/2028 | | 400 | | 378 | | 378 | | 0.1 | % |
| | | Secured Debt | | 6/21/2023 | | 13.00% | | | | 6/21/2028 | | 8,986 | | 8,787 | | 8,787 | | 1.4 | % |
| | | Common Equity | | 6/21/2023 | 3,600 | | | | | | 14.4 | % | | 3,600 | | 3,720 | | 0.6 | % |
| | | | | | | | | | | | | | 12,765 | | 12,885 | | 2.1 | % |
Independent Pet Partners Intermediate Holdings, LLC 8450 City Centre Drive Woodbury, MN 55125 | (10) | Omnichannel Retailer of Specialty Pet Products | | | | | | | | | | | | | | |
| | | Common Equity | | 4/7/2023 | 6,436,566 | | | | | | 8.7 | % | | 6,540 | | 7,290 | | 1.2 | % |
| | | | | | | | | | | | | | | | |
Integral Energy Services 101 North Third Street, Suite 401 Wilmington, NC 77041 | (10) | Nuclear Power Staffing Services | | | | | | | | | | | | | | |
| | | Secured Debt | (9) | 8/20/2021 | | 13.09% | SF+ | 7.50% | | 8/20/2026 | | 15,090 | | 14,971 | | 14,739 | | 2.4 | % |
| | | Preferred Equity | (8) | 12/7/2023 | 3,725 | 10.00% | | | 10.00% | | 8.7 | % | | 290 | | 527 | | 0.1 | % |
| | | Common Stock | | 8/20/2021 | 11,647 | | | | | | 8.7 | % | | 1,584 | | 640 | | 0.1 | % |
| | | | | | | | | | | | | | 16,845 | | 15,906 | | 2.6 | % |
| | | | | | | | | | | | | | | | | | | | | | | | | | | | | | | | | | | | | | | | | | | | | | | | | | |
| Portfolio Company (1) (20) | | Business Description | Type of Investment (2) (3) (15) | | Investment Date (22) | Shares/Units | Total Rate | Reference Rate and Spread (25) | PIK Rate (19) | Maturity Date | Percentage of Class Held (35) | Principal (4) | Cost (4) | Fair Value (18) | Percentage of Net Assets |
Kickhaefer Manufacturing Company, LLC 1221 S Park Street Port Washington, WI 53074 | | Precision Metal Parts Manufacturing | | | | | | | | | | | | | | |
| | | Secured Debt | | 10/31/2018 | | 12.00% | | | | 10/31/2026 | | 4,150 | | 4,139 | | 4,139 | | 0.7 | % |
| | | Secured Debt | | 10/31/2018 | | 9.00% | | | | 10/31/2048 | | 993 | | 984 | | 984 | | 0.2 | % |
| | | Preferred Equity | | 10/31/2018 | 145 | | | | | | 16.5 | % | | 3,060 | | 3,060 | | 0.5 | % |
| | | Member Units | (8) (23) | 10/31/2018 | 200 | | | | | | 20.0 | % | | 248 | | 623 | | 0.1 | % |
| | | | | | | | | | | | | | 8,431 | | 8,806 | | 1.4 | % |
MH Corbin Holding LLC 4353 Tuller Road, Dublin OH 43017 | | Manufacturer and Distributor of Traffic Safety Products | | | | | | | | | | | | | | |
| | | Secured Debt | | 8/31/2015 | | 14.00% | | | | 12/31/2025 | | 1,310 | | 1,310 | | 345 | | 0.1 | % |
| | | Preferred Member Units | | 3/15/2019 | 16,500 | | | | | | 18.4 | % | | 1,100 | | — | | 0.0 | % |
| | | Preferred Member Units | | 9/1/2015 | 1,000 | | | | | | 20.0 | % | | 1,500 | | — | | 0.0 | % |
| | | | | | | | | | | | | | 3,910 | | 345 | | 0.1 | % |
Mystic Logistics Holdings, LLC 2187 New London Turnpike South Glastonbury, CT 06073 | | Logistics and Distribution Services Provider for Large Volume Mailers | | | | | | | | | | | | | | |
| | | Secured Debt | (30) | 8/18/2014 | | | | | | 1/31/2027 | | — | | — | | — | | 0.0 | % |
| | | Secured Debt | | 8/18/2014 | | 10.00% | | | | 1/31/2027 | | 1,436 | | 1,432 | | 1,436 | | 0.2 | % |
| | | Common Stock | (8) | 8/18/2014 | 1,468 | | | | | | 15.9 | % | | 680 | | 6,530 | | 1.1 | % |
| | | | | | | | | | | | | | 2,112 | | 7,966 | | 1.3 | % |
Nello Industries Investco, LLC 1201 S Sheridan Street South Bend, IN 46619 | | Manufacturer of Steel Poles and Towers For Critical Infrastructure | | | | | | | | | | | | | | |
| | | Secured Debt | (9) | 6/4/2024 | | 11.75% | SF+ | 6.50% | | 6/4/2025 | | | 3,588 | | 3,588 | | 0.6 | % |
| | | Secured Debt | | 6/4/2024 | | 13.50% | | | | 6/4/2029 | | | 6,609 | | 6,609 | | 1.1 | % |
| | | Common Equity | (8) | 6/4/2024 | 91 | | | | | | 9.1 | % | | 3,030 | | 3,030 | | 0.5 | % |
| | | | | | | | | | | | | | 13,227 | | 13,227 | | 2.1 | % |
NexRev LLC 601 Development Drive Plano, TX 75074 | | Provider of Energy Efficiency Products & Services | | | | | | | | | | | | | | |
| | | Secured Debt | | 2/28/2018 | | 10.00% | | | | 2/28/2025 | | 490 | | 490 | | 490 | | 0.1 | % |
| | | Secured Debt | | 2/28/2018 | | 10.00% | | | | 2/28/2025 | | 2,453 | | 2,446 | | 2,453 | | 0.4 | % |
| | | Preferred Member Units | (8) | 2/28/2018 | 25,786,046 | | | | | | 16.7 | % | | 2,053 | | 2,460 | | 0.4 | % |
| | | | | | | | | | | | | | 4,989 | | 5,403 | | 0.9 | % |
NuStep, LLC 47700 Halyard Drive Plymouth, MI 48170 | | Designer, Manufacturer and Distributor of Fitness Equipment | | | | | | | | | | | | | | |
| | | Secured Debt | (9) | 1/31/2017 | | 11.85% | SF+ | 6.50% | | 1/31/2025 | | 900 | | 900 | | 900 | | 0.1 | % |
| | | Secured Debt | | 1/31/2017 | | 12.00% | | | | 1/31/2025 | | 4,610 | | 4,609 | | 4,609 | | 0.7 | % |
| | | Preferred Member Units | | 11/2/2022 | 576 | | | | | | 19.2 | % | | 645 | | 1,440 | | 0.2 | % |
| | | Preferred Member Units | | 1/31/2017 | 114 | | | | | | 18.7 | % | | 2,808 | | 2,660 | | 0.4 | % |
| | | | | | | | | | | | | | 8,962 | | 9,609 | | 1.6 | % |
Oneliance, LLC 13266 Reese Blvd East Suite 500 Huntersville, NC 28078 | | Construction Cleaning Company | | | | | | | | | | | | | | |
| | | Preferred Stock | | 8/6/2021 | 282 | | | | | | 20.0 | % | | 282 | | 550 | | 0.1 | % |
| | | | | | | | | | | | | | | | | | | | | | | | | | | | | | | | | | | | | | | | | | | | | | | | | | |
| Portfolio Company (1) (20) | | Business Description | Type of Investment (2) (3) (15) | | Investment Date (22) | Shares/Units | Total Rate | Reference Rate and Spread (25) | PIK Rate (19) | Maturity Date | Percentage of Class Held (35) | Principal (4) | Cost (4) | Fair Value (18) | Percentage of Net Assets |
| | | | | | | | | | | | | | | | |
Orttech Holdings, LLC 32425 Aurora Road Solon, OH 44139 | | Distributor of Industrial Clutches, Brakes and Other Components | | | | | | | | | | | | | | |
| | | Secured Debt | (9) (30) | 7/30/2021 | | | SF+ | 11.00% | | 7/31/2026 | | — | | (1) | | — | | 0.0 | % |
| | | Secured Debt | (9) | 7/30/2021 | | 16.35% | SF+ | 11.00% | | 7/31/2026 | | 5,490 | | 5,449 | | 5,490 | | 0.9 | % |
| | | Preferred Stock | (8) (23) | 7/30/2021 | 2,500 | | | | | | 16.1 | % | | 2,500 | | 3,670 | | 0.6 | % |
| | | | | | | | | | | | | | 7,948 | | 9,160 | | 1.5 | % |
Pinnacle TopCo, LLC 10215 Landsbury Drive Houston, TX 77099 | | Manufacturer and Distributor of Garbage Can Liners, Poly Bags, Produce Bags, and Other Similar Products | | | | | | | | | | | | | | |
| | | Secured Debt | (30) | 12/21/2023 | | | | | | 12/31/2028 | | — | | (8) | | — | | 0.0 | % |
| | | Secured Debt | | 12/21/2023 | | 13.00% | | | | 12/31/2028 | | 7,260 | | 7,108 | | 7,260 | | 1.2 | % |
| | | Preferred Equity | (8) | 12/21/2023 | 110 | | | | | | 20.0 | % | | 3,135 | | 4,340 | | 0.7 | % |
| | | | | | | | | | | | | | 10,235 | | 11,600 | | 1.9 | % |
RA Outdoors LLC 717 N Harwood Street, Suite 2400 Dallas, TX 75201 | (10) | Software Solutions Provider for Outdoor Activity Management | | | | | | | | | | | | | | |
| | | Secured Debt | (9) | 4/8/2021 | | 11.59% | SF+ | 6.75% | 11.59% | 4/8/2026 | | 1,313 | | 1,308 | | 1,190 | | 0.2 | % |
| | | Secured Debt | (9) | 4/8/2021 | | 11.59% | SF+ | 6.75% | 11.59% | 4/8/2026 | | 13,731 | | 13,672 | | 12,441 | | 2.0 | % |
| | | Common Equity | | 8/12/2024 | 15,036 | | | | | 4/8/2026 | 10.7 | % | | — | | — | | 0.0 | % |
| | | | | | | | | | | | | | 14,980 | | 13,631 | | 2.2 | % |
Robbins Bros. Jewelry, Inc. 1300 W Optical Drive, Suite 200 Azusa, CA 91702 | | Bridal Jewelry Retailer | | | | | | | | | | | | | | |
| | | Secured Debt | (14) (30) | 12/15/2021 | | | | | 10.00% | 12/15/2026 | | — | | (5) | | (5) | | 0.0 | % |
| | | Secured Debt | (14) | 12/15/2021 | | 12.50% | | | 10.00% | 12/15/2026 | | 3,740 | | 3,699 | | 1,713 | | 0.3 | % |
| | | Preferred Equity | | 12/15/2021 | 1,230 | | | | | | 9.0 | % | | 1,230 | | — | | 0.0 | % |
| | | | | | | | | | | | | | 4,924 | | 1,708 | | 0.3 | % |
SI East, LLC 4500 South Boulevard Charlotte, NC 28209 | | Rigid Industrial Packaging Manufacturing | | | | | | | | | | | | | | |
| | | Secured Debt | | 8/31/2018 | | 11.75% | | | | 6/16/2028 | | 750 | | 744 | | 750 | | 0.1 | % |
| | | Secured Debt | (33) | 6/16/2023 | | 12.63% | | | | 6/16/2028 | | 22,554 | | 22,531 | | 22,554 | | 3.6 | % |
| | | Preferred Member Units | (8) | 8/31/2018 | 55 | | | | | | 25.0 | % | | 508 | | 5,390 | | 0.9 | % |
| | | | | | | | | | | | | | 23,783 | | 28,694 | | 4.6 | % |
Student Resource Center, LLC 10 High Street Jamestown, RI 02835 | (10) | Higher Education Services | | | | | | | | | | | | | | |
| | | Secured Debt | | 9/11/2024 | | 8.50% | | | 8.50% | 12/31/2027 | | 223 | | 223 | | 223 | | 0.0 | % |
| | | Secured Debt | (14) | 12/31/2022 | | 8.50% | | | 8.50% | 12/31/2027 | | 5,918 | | 5,425 | | 1,826 | | 0.3 | % |
| | | Preferred Equity | | 12/31/2022 | 6,564,055 | | | | | | 9.9 | % | | — | | — | | 0.0 | % |
| | | | | | | | | | | | | | 5,648 | | 2,049 | | 0.3 | % |
Tedder Industries, LLC 4411 W Riverbend Avenue Post Falls, ID 83854 | | Manufacturer of Firearm Holsters and Accessories | | | | | | | | | | | | | | |
| | | Secured Debt | (14) (17) | 8/31/2018 | | 12.00% | | | 12.00% | 8/31/2023 | | 460 | | 460 | | 432 | | 0.1 | % |
| | | Secured Debt | (14) (17) | 8/31/2018 | | 12.00% | | | 12.00% | 8/31/2023 | | 3,800 | | 3,800 | | 1,164 | | 0.2 | % |
| | | | | | | | | | | | | | | | | | | | | | | | | | | | | | | | | | | | | | | | | | | | | | | | | | |
| Portfolio Company (1) (20) | | Business Description | Type of Investment (2) (3) (15) | | Investment Date (22) | Shares/Units | Total Rate | Reference Rate and Spread (25) | PIK Rate (19) | Maturity Date | Percentage of Class Held (35) | Principal (4) | Cost (4) | Fair Value (18) | Percentage of Net Assets |
| | | Preferred Member Units | | 8/28/2023 | 1,651 | | | | | | 20.0 | % | | 165 | | — | | 0.0 | % |
| | | Preferred Member Units | | 2/1/2023 | 1,411 | | | | | | 11.1 | % | | 141 | | — | | 0.0 | % |
| | | Preferred Member Units | | 8/31/2018 | 136 | | | | | | 17.3 | % | | 2,311 | | — | | 0.0 | % |
| | | | | | | | | | | | | | 6,877 | | 1,596 | | 0.3 | % |
Trantech Radiator Topco, LLC 1 Tranter Drive Edgefield, SC 29824 | | Transformer Cooling Products and Services | | | | | | | | | | | | | | |
| | | Secured Debt | (30) | 5/31/2019 | | | | | | 5/31/2027 | | — | | (1) | | — | | 0.0 | % |
| | | Secured Debt | | 5/31/2019 | | 13.50% | | | | 5/31/2027 | | 1,980 | | 1,960 | | 1,980 | | 0.3 | % |
| | | Common Stock | (8) | 5/31/2019 | 154 | | | | | | 16.7 | % | | 1,164 | | 2,380 | | 0.4 | % |
| | | | | | | | | | | | | | 3,123 | | 4,360 | | 0.7 | % |
VVS Holdco LLC 1118 Pony Express Highway Marysville, KS 66508 | | Omnichannel Retailer of Animal Health Products | | | | | | | | | | | | | | |
| | | Secured Debt | (9) (30) | 12/1/2021 | | | SF+ | 6.00% | | 12/1/2024 | | — | | — | | — | | 0.0 | % |
| | | Secured Debt | | 12/1/2021 | | 11.50% | | | | 12/1/2026 | | 6,760 | | 6,672 | | 6,672 | | 1.1 | % |
| | | Preferred Equity | (8) (23) | 12/1/2021 | 3,060 | | | | | | 10.6 | % | | 3,060 | | 3,060 | | 0.5 | % |
| | | | | | | | | | | | | | 9,732 | | 9,732 | | 1.6 | % |
Subtotal Affiliate Investments (51.0% of net assets at fair value) | | | | | | | | | | | | | | $ | 254,666 | | $ | 315,190 | | 51.0 | % |
| Non-Control/Non-Affiliate Investments (7) | | | | | | | | | | | | | | | | |
AAC Holdings, Inc. 200 Powell Place Brentwood, TN 37027 | (11) | Substance Abuse Treatment Service Provider | | | | | | | | | | | | | | |
| | | Secured Debt | | 1/31/2023 | | 18.00% | | | 18.00% | 6/25/2025 | | $ | 173 | | $ | 172 | | $ | 171 | | 0.0 | % |
| | | Secured Debt | | 12/11/2020 | | 18.00% | | | 18.00% | 6/25/2025 | | 5,745 | | 5,681 | | 5,687 | | 0.9 | % |
| | | Common Stock | | 12/11/2020 | 593,927 | | | | | | 3.0 | % | | 3,148 | | — | | 0.0 | % |
| | | Warrants | (27) | 12/11/2020 | 197,717 | | | | | 12/11/2025 | 1.0 | % | | — | | — | | 0.0 | % |
| | | | | | | | | | | | | | 9,001 | | 5,858 | | 0.9 | % |
Acumera, Inc. 3307 Northland Dr, Suite 500 Austin, TX 78731 | (10) | Managed Security Service Provider | | | | | | | | | | | | | | |
| | | Common Equity | (8) | 7/2/2024 | 3,311 | | | | | | | | — | | 30 | | 0.0 | % |
| | | | | | | | | | | | | | | | |
Adams Publishing Group, LLC 4095 Coon Rapids Blvd Minneapolis, MN 55433 | (10) | Local Newspaper Operator | | | | | | | | | | | | | | |
| | | Secured Debt | (9) (29) | 3/11/2022 | | 11.00% | SF+ | 7.00% | 1.00% | 3/11/2027 | | 943 | | 943 | | 924 | | 0.1 | % |
| | | Secured Debt | (9) (29) | 3/11/2022 | | 11.00% | SF+ | 7.00% | 1.00% | 3/11/2027 | | 2,322 | | 2,318 | | 2,274 | | 0.4 | % |
| | | | | | | | | | | | | | 3,261 | | 3,198 | | 0.5 | % |
AMEREQUIP LLC 1015 Calumet Avenue Kiel, WI 53042 | (10) | Full Services Provider Including Design, Engineering and Manufacturing of Commercial and Agricultural Equipment | | | | | | | | | | | | | | |
| | | Common Stock | (8) | 8/31/2022 | 11 | | | | | | 0.1 | % | | 83 | | 40 | | 0.0 | % |
| | | | | | | | | | | | | | | | |
American Health Staffing Group, Inc. 3009 Astoria Court Edmond, OK 73034 | (10) | Healthcare Temporary Staffing | | | | | | | | | | | | | | |
| | | | | | | | | | | | | | | | | | | | | | | | | | | | | | | | | | | | | | | | | | | | | | | | | | |
| Portfolio Company (1) (20) | | Business Description | Type of Investment (2) (3) (15) | | Investment Date (22) | Shares/Units | Total Rate | Reference Rate and Spread (25) | PIK Rate (19) | Maturity Date | Percentage of Class Held (35) | Principal (4) | Cost (4) | Fair Value (18) | Percentage of Net Assets |
| | | Secured Debt | (9) (30) | 11/19/2021 | | | P+ | 5.00% | | 11/19/2026 | | — | | (7) | | (7) | | 0.0 | % |
| | | Secured Debt | (9) | 11/19/2021 | | 13.00% | P+ | 5.00% | | 11/19/2026 | | 7,703 | | 7,669 | | 7,703 | | 1.2 | % |
| | | | | | | | | | | | | | 7,662 | | 7,696 | | 1.2 | % |
American Nuts, LLC 12950 San Fernando Road Sylmar, CA 91342 | (10) | Roaster, Mixer and Packager of Bulk Nuts and Seeds | | | | | | | | | | | | | | |
| | | Secured Debt | (9) | 3/11/2022 | | 15.23% | SF+ | 9.75% | 15.23% | 4/10/2026 | | 5,425 | | 5,411 | | 4,556 | | 0.7 | % |
| | | Secured Debt | (9) (14) | 3/11/2022 | | 17.20% | SF+ | 11.75% | 17.20% | 4/10/2026 | | 4,270 | | 4,244 | | 2,851 | | 0.5 | % |
| | | | | | | | | | | | | | 9,655 | | 7,407 | | 1.2 | % |
American Teleconferencing Services, Ltd. 2300 Lakeview Parkway, Suite 400 Alpharetta, GA 30009 | (11) | Provider of Audio Conferencing and Video Collaboration Solutions | | | | | | | | | | | | | | |
| | | Secured Debt | (14) (17) | 9/17/2021 | | | | | | 4/7/2023 | | 2,425 | | 2,375 | | 59 | | 0.0 | % |
| | | Secured Debt | (14) (17) | 5/19/2016 | | | | | | 6/8/2023 | | 11,693 | | 11,451 | | 282 | | 0.0 | % |
| | | | | | | | | | | | | | 13,826 | | 341 | | 0.1 | % |
Ansira Partners II, LLC 2300 Locust Street St. Louis, MO, 63103 | (10) | Provider of Data-Driven Marketing Services | | | | | | | | | | | | | | |
| | | Secured Debt | (9) | 7/1/2024 | | 11.88% | SF+ | 6.75% | | 7/1/2029 | | 195 | | 148 | | 148 | | 0.0 | % |
| | | Secured Debt | (9) | 7/1/2024 | | 12.08% | SF+ | 6.75% | | 7/1/2029 | | 18,049 | | 17,597 | | 17,597 | | 2.8 | % |
| | | | | | | | | | | | | | 17,745 | | 17,745 | | 2.9 | % |
ArborWorks, LLC 40266 Junction Drive Oakhurst CA 93644 | (10) | Vegetation Management Services | | | | | | | | | | | | | | |
| | | Secured Debt | | 11/6/2023 | | 15.00% | | | 15.00% | 11/6/2028 | | 2,106 | | 2,106 | | 2,106 | | 0.3 | % |
| | | Secured Debt | (9) | 11/6/2023 | | 11.76% | SF+ | 6.50% | 11.76% | 11/6/2028 | | 4,157 | | 4,157 | | 4,157 | | 0.7 | % |
| | | Preferred Equity | | 11/6/2023 | 17,265 | | | | | | 9.9 | % | | 7,468 | | 6,667 | | 1.1 | % |
| | | Preferred Equity | | 11/6/2023 | 17,265 | | | | | | 6.2 | % | | — | | — | | 0.0 | % |
| | | Common Equity | | 11/9/2021 | 2,070 | | | | | | 1.9 | % | | 124 | | — | | 0.0 | % |
| | | | | | | | | | | | | | 13,855 | | 12,930 | | 2.1 | % |
Archer Systems, LLC 1775 Saint James Place, Suite 200 Houston, TX 77056 | (10) | Mass Tort Settlement Administration Solutions Provider | | | | | | | | | | | | | | |
| | | Common Stock | | 8/11/2022 | 62,403 | | | | | | 0.0 | % | | 62 | | 100 | | 0.0 | % |
| | | | | | | | | | | | | | | | |
ATS Operating, LLC 1900 Crestwood Boulevard, Suite 302 Irondale, AL 35210 | (10) | For-Profit Thrift Retailer | | | | | | | | | | | | | | |
| | | Secured Debt | (9) | 1/18/2022 | | 11.59% | SF+ | 6.00% | | 1/18/2027 | | 105 | | 105 | | 105 | | 0.0 | % |
| | | Secured Debt | (9) | 1/18/2022 | | 10.59% | SF+ | 5.00% | | 1/18/2027 | | 925 | | 915 | | 925 | | 0.1 | % |
| | | Secured Debt | (9) | 1/18/2022 | | 12.59% | SF+ | 7.00% | | 1/18/2027 | | 925 | | 915 | | 925 | | 0.1 | % |
| | | Common Stock | | 1/18/2022 | 100,000 | | | | | | 0.1 | % | | 100 | | 100 | | 0.0 | % |
| | | | | | | | | | | | | | 2,035 | | 2,055 | | 0.3 | % |
AVEX Aviation Holdings, LLC 205 Durley Avenue, Suite A Camarillo, CA 93010 | (10) | Specialty Aircraft Dealer & MRO Provider | | | | | | | | | | | | | | |
| | | Secured Debt | (9) (30) | 12/23/2022 | | | SF+ | 7.25% | | 12/23/2027 | | — | | (14) | | (14) | | 0.0 | % |
| | | Secured Debt | (9) | 12/23/2022 | | 12.06% | SF+ | 7.25% | | 12/23/2027 | | 3,365 | | 3,287 | | 3,365 | | 0.5 | % |
| | | Common Equity | (8) | 12/15/2021 | 137 | | | | | | 0.3 | % | | 134 | | 111 | | 0.0 | % |
| | | | | | | | | | | | | | | | | | | | | | | | | | | | | | | | | | | | | | | | | | | | | | | | | | |
| Portfolio Company (1) (20) | | Business Description | Type of Investment (2) (3) (15) | | Investment Date (22) | Shares/Units | Total Rate | Reference Rate and Spread (25) | PIK Rate (19) | Maturity Date | Percentage of Class Held (35) | Principal (4) | Cost (4) | Fair Value (18) | Percentage of Net Assets |
| | | | | | | | | | | | | | 3,407 | | 3,462 | | 0.6 | % |
Berry Aviation, Inc. 1807 Airport Drive San Marcos, TX 78666 | (10) | Charter Airline Services | | | | | | | | | | | | | | |
| | | Preferred Member Units | | 3/8/2024 | 286,109 | | | | | | 2.5 | % | | 286 | | — | | 0.0 | % |
| | | Preferred Member Units | (23) | 11/12/2019 | 122,416 | | | | | | 2.4 | % | | — | | — | | 0.0 | % |
| | | Preferred Member Units | (23) | 7/6/2018 | 1,548,387 | | | | | | 2.4 | % | | — | | — | | 0.0 | % |
| | | | | | | | | | | | | | 286 | | — | | 0.0 | % |
Bettercloud, Inc. 330 7th Avenue New York, NY 10001 | (10) | SaaS Provider of Workflow Management and Business Application Solutions | | | | | | | | | | | | | | |
| | | Secured Debt | (9) (30) | 6/30/2022 | | | SF+ | 10.25% | | 6/30/2028 | | — | | (15) | | (15) | | 0.0 | % |
| | | Secured Debt | (9) | 6/30/2022 | | 15.31% | SF+ | 10.25% | 9.25% | 6/30/2028 | | 9,035 | | 8,939 | | 7,544 | | 1.2 | % |
| | | | | | | | | | | | | | 8,924 | | 7,529 | | 1.2 | % |
Binswanger Enterprises, LLC 965 Ridge Lake Boulevard Memphis, TN 38120 | (10) | Glass Repair and Installation Service Provider | | | | | | | | | | | | | | |
| | | Member Units | | 3/10/2017 | 1,050,000 | | | | | | 2.5 | % | | 1,050 | | 580 | | 0.1 | % |
| | | | | | | | | | | | | | | | |
Bluestem Brands, Inc. 13300 Pioneer Trail Eden Prairie, MN 55347 | (11) | Multi-Channel Retailer of General Merchandise | | | | | | | | | | | | | | |
| | | Secured Debt | (9) | 1/9/2024 | | 13.82% | SF+ | 8.50% | 12.82% | 8/28/2025 | | 204 | | 99 | | 187 | | 0.0 | % |
| | | Secured Debt | (9) | 10/19/2022 | | 15.50% | P+ | 7.50% | 15.00% | 8/28/2025 | | 3,703 | | 3,703 | | 3,388 | | 0.5 | % |
| | | Secured Debt | (9) | 8/28/2020 | | 13.82% | SF+ | 8.50% | 12.82% | 8/28/2025 | | 4,348 | | 3,998 | | 3,978 | | 0.6 | % |
| | | Common Stock | | 10/1/2020 | 700,446 | | | | | | 2.2 | % | | — | | — | | 0.0 | % |
| | | Warrants | (27) | 10/19/2022 | 175,110 | | | | | 10/19/2032 | 0.5 | % | | 1,111 | | — | | 0.0 | % |
| | | | | | | | | | | | | | 8,911 | | 7,553 | | 1.2 | % |
Boccella Precast Products LLC 324 New Brooklyn Road Berlin, NJ 08009 | | Manufacturer of Precast Hollow Core Concrete | | | | | | | | | | | | | | |
| | | Secured Debt | | 9/23/2021 | | 10.00% | | | | 2/28/2027 | | 80 | | 80 | | 66 | | 0.0 | % |
| | | Member Units | (8) | 6/30/2017 | 540,000 | | | | | | 4.8 | % | | 564 | | 80 | | 0.0 | % |
| | | | | | | | | | | | | | 644 | | 146 | | 0.0 | % |
Bond Brand Loyalty ULC 25 King Street W Toronto, ON M5L 2AI Canada | (10) (13) (21) | Provider of Loyalty Marketing Services | | | | | | | | | | | | | | |
| | | Secured Debt | (9) (30) | 5/1/2023 | | | SF+ | 7.00% | | 5/1/2028 | | — | | (13) | | (13) | | 0.0 | % |
| | | Secured Debt | (9) | 5/1/2023 | | 11.48% | SF+ | 6.00% | | 5/1/2028 | | 4,010 | | 3,952 | | 4,010 | | 0.6 | % |
| | | Secured Debt | (9) | 5/1/2023 | | 13.48% | SF+ | 8.00% | | 5/1/2028 | | 4,010 | | 3,952 | | 4,010 | | 0.6 | % |
| | | Preferred Equity | | 5/1/2023 | 360 | | | | | | 0.3 | % | | 360 | | 310 | | 0.1 | % |
| | | Common Equity | | 5/1/2023 | 360 | | | | | | 0.3 | % | | — | | — | | 0.0 | % |
| | | | | | | | | | | | | | 8,251 | | 8,317 | | 1.3 | % |
BP Loenbro Holdings Inc. 7401 Church Ranch Boulevard, Suite 210 Westminster, CO 80021 | (10) | Specialty Industrial Maintenance Services | | | | | | | | | | | | | | |
| | | Secured Debt | (9) (28) | 2/1/2024 | | 11.22% | SF+ | 6.00% | | 2/1/2029 | | 771 | | 748 | | 771 | | 0.1 | % |
| | | Secured Debt | (9) (30) | 2/1/2024 | | | SF+ | 6.00% | | 2/1/2029 | | — | | (11) | | (11) | | 0.0 | % |
| | | Secured Debt | (9) | 2/1/2024 | | 11.35% | SF+ | 6.00% | | 2/1/2029 | | 11,288 | | 11,091 | | 11,288 | | 1.8 | % |
| | | | | | | | | | | | | | | | | | | | | | | | | | | | | | | | | | | | | | | | | | | | | | | | | | |
| Portfolio Company (1) (20) | | Business Description | Type of Investment (2) (3) (15) | | Investment Date (22) | Shares/Units | Total Rate | Reference Rate and Spread (25) | PIK Rate (19) | Maturity Date | Percentage of Class Held (35) | Principal (4) | Cost (4) | Fair Value (18) | Percentage of Net Assets |
| | | Common Equity | | 2/1/2024 | 1,000,000 | | | | | | 0.6 | % | | 1,000 | | 1,550 | | 0.3 | % |
| | | | | | | | | | | | | | 12,828 | | 13,598 | | 2.2 | % |
Brightwood Capital Fund Investments 1540 Broadway, 23rd Floor New York, NY 04039 | (12) (13) | Investment Partnership | | | | | | | | | | | | | | |
| | | LP Interests (Brightwood Capital Fund III, LP) | (24) | 7/21/2014 | 1.0% | | | | | | 0.5 | % | | 1,974 | | 1,156 | | 0.2 | % |
| | | LP Interests (Brightwood Capital Fund IV, LP) | (8) (24) | 10/26/2016 | 1.0% | | | | | | 1.2 | % | | 8,637 | | 8,802 | | 1.4 | % |
| | | | | | | | | | | | | | 10,611 | | 9,958 | | 1.6 | % |
Buca C, LLC 4700 Millenia Boulevard, Suite 400 Orlando, FL 32839 | | Casual Restaurant Group | | | | | | | | | | | | | | |
| | | Secured Debt | (14) | 8/7/2024 | | 15.00% | | | 10.00% | 11/4/2024 | | 13,330 | | 13,048 | | 10,817 | | 1.7 | % |
| | | Secured Debt | (14) (30) | 6/28/2024 | | 15.00% | | | 15.00% | 4/1/2025 | | 10 | | — | | — | | 0.0 | % |
| | | Secured Debt | (14) (17) | 6/30/2015 | | 15.00% | | | 15.00% | 8/31/2023 | | 6,131 | | 4,078 | | — | | 0.0 | % |
| | | Preferred Member Units | | 6/30/2015 | 4 | 6.00% | | | 6.00% | | 40.0 | % | | 3,040 | | — | | 0.0 | % |
| | | | | | | | | | | | | | 20,166 | | 10,817 | | 1.7 | % |
Burning Glass Intermediate Holding Company, Inc. 66 Long Wharf, 2nd Floor Boston, MA 02110 | (10) | Provider of Skills-Based Labor Market Analytics | | | | | | | | | | | | | | |
| | | Secured Debt | (9) (30) | 6/14/2021 | | | SF+ | 5.00% | | 6/10/2026 | | — | | (9) | | — | | 0.0 | % |
| | | Secured Debt | (9) | 6/14/2021 | | 9.95% | SF+ | 5.00% | | 6/10/2028 | | 12,125 | | 12,006 | | 12,125 | | 2.0 | % |
| | | | | | | | | | | | | | 11,997 | | 12,125 | | 2.0 | % |
CAI Software LLC 24 Albion Rd, Suite 230 Lincoln, RI 02865 | | Provider of Specialized Enterprise Resource Planning Software | | | | | | | | | | | | | | |
| | | Preferred Equity | | 12/13/2021 | 454,344 | | | | | | 0.5 | % | | 454 | | 472 | | 0.1 | % |
| | | Preferred Equity | | 12/13/2021 | 126,446 | | | | | | 2.5 | % | | — | | — | | 0.0 | % |
| | | | | | | | | | | | | | 454 | | 472 | | 0.1 | % |
Career Team Holdings, LLC 250 State Street North Haven, CT 06473 | | Provider of Workforce Training and Career Development Services | | | | | | | | | | | | | | |
| | | Secured Debt | (9) | 12/17/2021 | | 11.25% | SF+ | 6.00% | | 12/17/2026 | | 75 | | 71 | | 71 | | 0.0 | % |
| | | Secured Debt | | 12/17/2021 | | 13.00% | | | | 12/17/2026 | | 2,205 | | 2,176 | | 2,176 | | 0.4 | % |
| | | Common Stock | | 12/17/2021 | 50,000 | | | | | | 2.3 | % | | 500 | | 500 | | 0.1 | % |
| | | | | | | | | | | | | | 2,747 | | 2,747 | | 0.4 | % |
CaseWorthy, Inc. 3995 700 E, Suite 420 Murray, UT 84107 | (10) | SaaS Provider of Case Management Solutions | | | | | | | | | | | | | | |
| | | Common Equity | | 12/30/2022 | 80,000 | | | | | | 0.1 | % | | 80 | | 160 | | 0.0 | % |
| | | | | | | | | | | | | | | | |
CenterPeak Holdings, LLC 811 Main Street, Suite 2100 Houston, TX 77002 | | Executive Search Services | | | | | | | | | | | | | | |
| | | Secured Debt | (30) | 12/10/2021 | | | | | | 12/10/2026 | | — | | (3) | | — | | 0.0 | % |
| | | Secured Debt | | 12/10/2021 | | 15.00% | | | | 12/10/2026 | | 2,390 | | 2,361 | | 2,390 | | 0.4 | % |
| | | | | | | | | | | | | | | | | | | | | | | | | | | | | | | | | | | | | | | | | | | | | | | | | | |
| Portfolio Company (1) (20) | | Business Description | Type of Investment (2) (3) (15) | | Investment Date (22) | Shares/Units | Total Rate | Reference Rate and Spread (25) | PIK Rate (19) | Maturity Date | Percentage of Class Held (35) | Principal (4) | Cost (4) | Fair Value (18) | Percentage of Net Assets |
| | | Preferred Equity | (8) | 12/10/2021 | 368 | | | | | | | | 404 | | 1,590 | | 0.3 | % |
| | | | | | | | | | | | | | 2,762 | | 3,980 | | 0.6 | % |
Central Moloney, LLC 2400 W 6th Avenue Pine Bluff, AK 71601 | (10) | Manufacturer of Electricity Transformers and Related Equipment | | | | | | | | | | | | | | |
| | | Secured Debt | (9) | 2/9/2024 | | 11.35% | SF+ | 6.75% | | 10/20/2028 | | 12,861 | | 12,639 | | 12,773 | | 2.1 | % |
| | | | | | | | | | | | | | | | |
Channel Partners Intermediateco, LLC 4450 East Adamo Drive, Suite 501 Tampa, FL 33605 | (10) | Outsourced Consumer Services Provider | | | | | | | | | | | | | | |
| | | Secured Debt | (9) (28) | 2/7/2022 | | 12.02% | SF+ | 7.00% | | 2/7/2027 | | 467 | | 455 | | 437 | | 0.1 | % |
| | | Secured Debt | (9) | 2/7/2022 | | 12.55% | SF+ | 7.00% | | 2/7/2027 | | 3,334 | | 3,303 | | 3,125 | | 0.5 | % |
| | | Secured Debt | (9) | 6/24/2022 | | 12.55% | SF+ | 7.00% | | 2/7/2027 | | 185 | | 183 | | 173 | | 0.0 | % |
| | | Secured Debt | (9) | 3/27/2023 | | 12.55% | SF+ | 7.00% | | 2/7/2027 | | 446 | | 439 | | 418 | | 0.1 | % |
| | | | | | | | | | | | | | 4,380 | | 4,153 | | 0.7 | % |
Clarius BIGS, LLC 311 N Robertson Boulevard Beverly Hills, CA 90211 | (10) | Prints & Advertising Film Financing | | | | | | | | | | | | | | |
| | | Secured Debt | (14) (17) | 9/23/2014 | | | | | | 1/5/2015 | | 2,685 | | 2,340 | | 17 | | 0.0 | % |
| | | | | | | | | | | | | | | | |
Classic H&G Holdings, LLC 20 Waterview Drive Shelton, CT 06484 | | Provider of Engineered Packaging Solutions | | | | | | | | | | | | | | |
| | | Preferred Member Units | (8) | 3/12/2020 | 39 | | | | | | 18.7 | % | | — | | 660 | | 0.1 | % |
| | | | | | | | | | | | | | | | |
Computer Data Source, LLC 275 Industrial Way W Eatontown, NJ 07724 | (10) | Third Party Maintenance Provider to the Data Center Ecosystem | | | | | | | | | | | | | | |
| | | Secured Debt | (9) (28) | 8/6/2021 | | 13.29% | SF+ | 8.00% | | 8/6/2026 | | 6,250 | | 6,170 | | 6,117 | | 1.0 | % |
| | | Secured Debt | (9) (30) | 3/29/2024 | | | SF+ | 8.00% | | 8/6/2026 | | — | | (49) | | (49) | | 0.0 | % |
| | | Secured Debt | (9) | 8/6/2021 | | 13.28% | SF+ | 8.00% | | 8/6/2026 | | 15,146 | | 14,970 | | 14,823 | | 2.4 | % |
| | | | | | | | | | | | | | 21,091 | | 20,891 | | 3.4 | % |
Coregistics Buyer LLC 240 Northpoint Parkway Acworth, GA 30102 | (10) (13) (21) | Contract Packaging Service Provider | | | | | | | | | | | | | | |
| | | Secured Debt | (9) | 6/29/2024 | | | SF+ | 6.50% | | 6/28/2029 | | | 426 | | 429 | | 0.1 | % |
| | | Secured Debt | (9) | 6/29/2024 | | 11.45% | SF+ | 6.50% | | 6/28/2029 | | | 2,813 | | 2,752 | | 0.4 | % |
| | | Secured Debt | (9) | 8/15/2024 | | 11.62% | SF+ | 6.50% | | 6/28/2029 | | | 1,881 | | 1,835 | | 0.3 | % |
| | | Secured Debt | (9) | 6/29/2024 | | 11.70% | SF+ | 6.75% | | 6/28/2029 | | | 8,449 | | 8,448 | | 1.4 | % |
| | | | | | | | | | | | | | 13,569 | | 13,464 | | 2.2 | % |
CQ Fluency, LLC 2 University Plaza, Suite 406 Hackensack, NJ 07601 | (10) | Global Language Services Provider | | | | | | | | | | | | | | |
| | | Secured Debt | (9) (30) | 12/27/2023 | | | SF+ | 6.75% | | 6/27/2027 | | — | | (35) | | (35) | | 0.0 | % |
| | | Secured Debt | (9) (30) | 12/27/2023 | | | SF+ | 6.75% | | 6/27/2027 | | — | | (35) | | (35) | | 0.0 | % |
| | | Secured Debt | (9) | 12/27/2023 | | 11.49% | SF+ | 6.75% | | 6/27/2027 | | 7,313 | | 7,142 | | 7,170 | | 1.2 | % |
| | | | | | | | | | | | | | 7,072 | | 7,100 | | 1.1 | % |
Creative Foam Corporation 300 North Alloy Drive Fenton, MI 48403 | (10) | Manufacturer of Custom Engineered Die Cut, Formed Foam, Nonwoven, and Multi-material Component Solutions for the Automotive and Healthcare Markets | | | | | | | | | | | | | | |
| | | | | | | | | | | | | | | | | | | | | | | | | | | | | | | | | | | | | | | | | | | | | | | | | | |
| Portfolio Company (1) (20) | | Business Description | Type of Investment (2) (3) (15) | | Investment Date (22) | Shares/Units | Total Rate | Reference Rate and Spread (25) | PIK Rate (19) | Maturity Date | Percentage of Class Held (35) | Principal (4) | Cost (4) | Fair Value (18) | Percentage of Net Assets |
| | | Secured Debt | (9) (30) | 6/27/2024 | | | SF+ | 5.75% | | 6/27/2029 | | — | | (29) | | (29) | | 0.0 | % |
| | | Secured Debt | (9) | 6/27/2024 | | 10.35% | SF+ | 5.75% | | 6/27/2029 | | 10,869 | | 10,666 | | 10,733 | | 1.7 | % |
| | | | | | | | | | | | | | 10,637 | | 10,704 | | 1.7 | % |
Dalton US Inc. 15830 Foltz Parkway Strongville, OH 44149 | (10) | Provider of Supplemental Labor Services | | | | | | | | | | | | | | |
| | | Common Stock | | 8/16/2022 | 37 | | | | | | 0.1 | % | | 52 | | 60 | | 0.0 | % |
| | | | | | | | | | | | | | | | |
DMA Industries, LLC 233 N US HWY 701 Bypass Tabor City, NC 28463 | | Distributor of Aftermarket Ride Control Products | | | | | | | | | | | | | | |
| | | Secured Debt | | 6/18/2024 | | 12.00% | | | | 6/19/2029 | | 140 | | 137 | | 137 | | 0.0 | % |
| | | Secured Debt | | 11/19/2021 | | 12.00% | | | | 6/19/2029 | | 4,200 | | 4,159 | | 4,159 | | 0.7 | % |
| | | Preferred Equity | | 11/19/2021 | 1,486 | | | | | | 20.0 | % | | 1,486 | | 1,486 | | 0.2 | % |
| | | Preferred Equity | (8) | 6/18/2024 | 767 | 15.00% | | | 15.00% | | 20.0 | % | | 781 | | 781 | | 0.1 | % |
| | | | | | | | | | | | | | 6,563 | | 6,563 | | 1.1 | % |
DTE Enterprises, LLC 95 Chancellor Drive Roselle, IL 60172 | (10) | Industrial Powertrain Repair and Services | | | | | | | | | | | | | | |
| | | Class AA Preferred Member Units (non-voting) | (8) | 4/13/2018 | | 10.00% | | | 10.00% | | 2.6 | % | | 1,316 | | 681 | | 0.1 | % |
| | | Class A Preferred Member Units | | 4/13/2018 | 776,316 | 8.00% | | | 8.00% | | 1.4 | % | | 776 | | — | | 0.0 | % |
| | | | | | | | | | | | | | 2,092 | | 681 | | 0.1 | % |
Dynamic Communities, LLC 2780 E Fowler Ave #2065 Tampa, FL 33612 | (10) | Developer of Business Events and Online Community Groups | | | | | | | | | | | | | | |
| | | Secured Debt | (9) | 12/20/2022 | | 11.45% | SF+ | 6.50% | 11.45% | 12/31/2026 | | 2,253 | | 2,094 | | 2,155 | | 0.3 | % |
| | | Secured Debt | (9) | 12/20/2022 | | 13.45% | SF+ | 8.50% | 13.45% | 12/31/2026 | | 2,333 | | 2,100 | | 2,139 | | 0.3 | % |
| | | Preferred Equity | | 12/20/2022 | 125,000 | | | | | | 3.6 | % | | 128 | | 60 | | 0.0 | % |
| | | Preferred Equity | | 12/20/2022 | 2,376,241 | | | | | | 12.9 | % | | — | | — | | 0.0 | % |
| | | Common Equity | | 12/20/2022 | 1,250,000 | | | | | | 3.6 | % | | — | | — | | 0.0 | % |
| | | | | | | | | | | | | | 4,322 | | 4,354 | | 0.7 | % |
Elgin AcquireCo, LLC 1100 Jansen Farm Drive Elgin, IL 60123 | | Manufacturer and Distributor of Engine and Chassis Components | | | | | | | | | | | | | | |
| | | Secured Debt | (9) (30) | 10/3/2022 | | | SF+ | 6.00% | | 10/3/2027 | | — | | — | | — | | 0.0 | % |
| | | Secured Debt | | 10/3/2022 | | 12.00% | | | | 10/3/2027 | | 1,181 | | 1,160 | | 1,160 | | 0.2 | % |
| | | Secured Debt | | 10/3/2022 | | 9.00% | | | | 10/3/2052 | | 410 | | 406 | | 406 | | 0.1 | % |
| | | Common Stock | | 10/3/2022 | 19 | | | | | | 2.2 | % | | 374 | | 370 | | 0.1 | % |
| | | Common Stock | (23) | 10/3/2022 | 61 | | | | | | 6.1 | % | | 102 | | 196 | | 0.0 | % |
| | | | | | | | | | | | | | 2,042 | | 2,132 | | 0.3 | % |
Emerald Technologies Acquisition Co, Inc. 1 Stiles Road Salem, NH 03079 | (11) | Design & Manufacturing | | | | | | | | | | | | | | |
| | | Secured Debt | (9) | 2/10/2022 | | 11.20% | SF+ | 6.25% | | 12/29/2027 | | 2,359 | | 2,332 | | 1,935 | | 0.3 | % |
| | | | | | | | | | | | | | | | |
| | | | | | | | | | | | | | | | | | | | | | | | | | | | | | | | | | | | | | | | | | | | | | | | | | |
| Portfolio Company (1) (20) | | Business Description | Type of Investment (2) (3) (15) | | Investment Date (22) | Shares/Units | Total Rate | Reference Rate and Spread (25) | PIK Rate (19) | Maturity Date | Percentage of Class Held (35) | Principal (4) | Cost (4) | Fair Value (18) | Percentage of Net Assets |
Escalent, Inc. 17430 College Parkway Livonia, MI 48152 | (10) | Market Research and Consulting Firm | | | | | | | | | | | | | | |
| | | Secured Debt | (9) (30) | 4/7/2023 | | | SF+ | 8.00% | | 4/7/2029 | | — | | (8) | | (8) | | 0.0 | % |
| | | Secured Debt | (9) | 4/7/2023 | | 12.70% | SF+ | 8.00% | | 4/7/2029 | | 6,872 | | 6,716 | | 6,872 | | 1.1 | % |
| | | Common Equity | | 4/7/2023 | 170,998 | | | | | | 0.1 | % | | 174 | | 240 | | 0.0 | % |
| | | | | | | | | | | | | | 6,882 | | 7,104 | | 1.1 | % |
Event Holdco, LLC 19 Newport Drive, Suite 101 Forest Hill, MD 21050
| (10) | Event and Learning Management Software for Healthcare Organizations and Systems | | | | | | | | | | | | | | |
| | | Secured Debt | (9) | 12/22/2021 | | 12.87% | SF+ | 8.00% | | 12/22/2026 | | 308 | | 306 | | 308 | | 0.0 | % |
| | | Secured Debt | (9) | 12/22/2021 | | 12.87% | SF+ | 8.00% | 8.00% | 12/22/2026 | | 3,909 | | 3,893 | | 3,909 | | 0.6 | % |
| | | | | | | | | | | | | | 4,199 | | 4,217 | | 0.7 | % |
FCC Intermediate Holdco, LLC (SupplyCore) 303 North Main Street, Suite 800 Rockford, IL 61101 | | Supply Chain Management Services | | | | | | | | | | | | | | |
| | | Secured Debt | | 5/28/2024 | | 13.00% | | | | 5/29/2029 | | 8,200 | | 7,074 | | 7,074 | | 1.1 | % |
| | | Warrants | (27) | 5/28/2024 | 3 | | | | | | 3.0 | % | 980 | | 980 | | 980 | | 0.2 | % |
| | | | | | | | | | | | | | 8,054 | | 8,054 | | 1.3 | % |
Garyline, LLC 14799 Shady Hills Road Spring Hill, Florida 34610 | (10) | Manufacturer of Consumer Plastic Products | | | | | | | | | | | | | | |
| | | Secured Debt | (9) (28) | 11/10/2023 | | 11.95% | SF+ | 6.75% | | 11/10/2028 | | 1,786 | | 1,721 | | 1,755 | | 0.3 | % |
| | | Secured Debt | (9) | 11/10/2023 | | 11.95% | SF+ | 6.75% | | 11/10/2028 | | 9,616 | | 9,379 | | 9,448 | | 1.5 | % |
| | | Common Equity | | 11/10/2023 | 210,084 | | | | | | 0.5 | % | | 210 | | 170 | | 0.0 | % |
| | | | | | | | | | | | | | 11,310 | | 11,373 | | 1.8 | % |
Hawk Ridge Systems, LLC 575 Clyde Avenue Mountain View, CA 94043 | | Value-Added Reseller of Engineering Design and Manufacturing Solutions | | | | | | | | | | | | | | |
| | | Secured Debt | (9) | 12/2/2016 | | 11.35% | SF+ | 6.00% | | 1/15/2026 | | 640 | | 639 | | 640 | | 0.1 | % |
| | | Secured Debt | | 12/2/2016 | | 12.50% | | | | 1/15/2026 | | 9,744 | | 9,715 | | 9,744 | | 1.6 | % |
| | | Preferred Member Units | (8) | 12/2/2016 | 56 | | | | | | 20.0 | % | | 713 | | 4,750 | | 0.8 | % |
| | | Preferred Member Units | (23) | 12/2/2016 | 56 | | | | | | 20.0 | % | | 38 | | 250 | | 0.0 | % |
| | | | | | | | | | | | | | 11,105 | | 15,384 | | 2.5 | % |
HDC/HW Intermediate Holdings 211 West Wacker Drive Suite 900E Chicago, IL 60606 | (10) | Managed Services and Hosting Provider | | | | | | | | | | | | | | |
| | | Secured Debt | (9) | 3/7/2024 | | 8.75% | SF+ | 3.50% | 2.50% | 6/21/2026 | | 1,353 | | 1,289 | | 1,289 | | 0.2 | % |
| | | Secured Debt | (14) | 3/7/2024 | | 2.50% | | | 2.50% | 6/21/2026 | | 914 | | 401 | | 359 | | 0.1 | % |
| | | Common Equity | | 3/7/2024 | 35,971 | | | | | | 0.4 | % | | — | | — | | 0.0 | % |
| | | | | | | | | | | | | | 1,690 | | 1,648 | | 0.3 | % |
HEADLANDS OP-CO LLC 2 Belvedere Place, Suite 310 Mill Valley, CA 94941 | (10) | Clinical Trial Sites Operator | | | | | | | | | | | | | | |
| | | Secured Debt | (9) (30) | 8/1/2022 | | | SF+ | 6.50% | | 8/1/2027 | | — | | (11) | | (11) | | 0.0 | % |
| | | Secured Debt | (9) | 8/1/2022 | | 11.35% | SF+ | 6.50% | | 8/1/2027 | | 1,980 | | 1,954 | | 1,980 | | 0.3 | % |
| | | Secured Debt | (9) (30) | 6/3/2024 | | | SF+ | 6.50% | | 8/1/2027 | | — | | (18) | | (18) | | 0.0 | % |
| | | Secured Debt | (9) | 8/1/2022 | | 11.35% | SF+ | 6.50% | | 8/1/2027 | | 4,888 | | 4,832 | | 4,887 | | 0.8 | % |
| | | Secured Debt | (9) | 6/3/2024 | | 11.35% | SF+ | 6.50% | | 8/1/2027 | | 2,388 | | 2,367 | | 2,388 | | 0.4 | % |
| | | | | | | | | | | | | | 9,124 | | 9,226 | | 1.5 | % |
| | | | | | | | | | | | | | | | | | | | | | | | | | | | | | | | | | | | | | | | | | | | | | | | | | |
| Portfolio Company (1) (20) | | Business Description | Type of Investment (2) (3) (15) | | Investment Date (22) | Shares/Units | Total Rate | Reference Rate and Spread (25) | PIK Rate (19) | Maturity Date | Percentage of Class Held (35) | Principal (4) | Cost (4) | Fair Value (18) | Percentage of Net Assets |
Hornblower Sub, LLC Pier 3, The Embarcadero San Francisco, CA 94111 | (10) | Marine Tourism and Transportation | | | | | | | | | | | | | | |
| | | Secured Debt | (9) (30) | 7/3/2024 | | | SF+ | 5.50% | | 7/3/2029 | | — | | (24) | | (24) | | 0.0 | % |
| | | Secured Debt | (9) | 7/3/2024 | | 10.82% | SF+ | 5.50% | | 7/3/2029 | | 15,529 | | 15,368 | | 15,368 | | 2.5 | % |
| | | | | | | | | | | | | | 15,344 | | 15,344 | | 2.5 | % |
Hybrid Promotions, LLC 10711 Walker Street Cypress, CA 90630 | (10) | Wholesaler of Licensed, Branded and Private Label Apparel | | | | | | | | | | | | | | |
| | | Secured Debt | (9) | 6/30/2021 | | 13.84% | SF+ | 8.25% | | 12/31/2027 | | 8,000 | | 7,847 | | 8,000 | | 1.3 | % |
| | | | | | | | | | | | | | | | |
IG Parent Corporation 485 Albertto Way #100 Los Gatos, CA 95032 | (11) | Software Engineering | | | | | | | | | | | | | | |
| | | Secured Debt | (9) | 7/30/2021 | | 10.95% | SF+ | 5.75% | | 7/30/2026 | | 306 | | 297 | | 306 | | 0.0 | % |
| | | Secured Debt | (9) | 7/30/2021 | | 10.70% | SF+ | 5.75% | | 7/30/2028 | | 6,154 | | 6,101 | | 6,154 | | 1.0 | % |
| | | Secured Debt | (9) | 7/30/2021 | | 10.70% | SF+ | 5.75% | | 7/30/2028 | | 1,927 | | 1,910 | | 1,927 | | 0.3 | % |
| | | | | | | | | | | | | | 8,308 | | 8,387 | | 1.4 | % |
Imaging Business Machines, L.L.C. 2750 Crestwood Boulevard Irondale, AL 35210 | (10) | Technology Hardware & Equipment | | | | | | | | | | | | | | |
| | | Secured Debt | (9) (28) | 6/8/2023 | | 12.08% | SF+ | 7.00% | | 6/30/2028 | | 593 | | 593 | | 593 | | 0.1 | % |
| | | Secured Debt | (9) | 6/8/2023 | | 11.62% | SF+ | 7.00% | | 6/30/2028 | | 10,306 | | 10,042 | | 10,306 | | 1.7 | % |
| | | Common Equity | | 6/8/2023 | 422 | | | | | | 0.8 | % | | 580 | | 540 | | 0.1 | % |
| | | | | | | | | | | | | | 11,215 | | 11,439 | | 1.8 | % |
Implus Footcare, LLC 2001 TW Alexander Drive Box 13925 Durham, NC 27709 | (10) | Provider of Footwear and Related Accessories | | | | | | | | | | | | | | |
| | | Secured Debt | (9) | 6/1/2017 | | 14.01% | SF+ | 9.25% | 1.50% | 7/31/2025 | | 17,043 | | 17,043 | | 15,988 | | 2.6 | % |
| | | | | | | | | | | | | | | | |
Infinity X1 Holdings, LLC 3525 Del Mar Heights Road San Diego, CA 92130 | | Manufacturer and Supplier of Personal Lighting Products | | | | | | | | | | | | | | |
| | | Secured Debt | | 3/31/2023 | | 12.00% | | | | 3/31/2028 | | 3,819 | | 3,766 | | 3,766 | | 0.6 | % |
| | | Preferred Equity | (8) | 3/31/2023 | 21,840 | | | | | | 20.0 | % | | 1,092 | | 1,730 | | 0.3 | % |
| | | | | | | | | | | | | | 4,858 | | 5,496 | | 0.9 | % |
Insight Borrower Corporation 40 McCullough Drive New Castle, DE 19720 | (10) | Test, Inspection, and Certification Instrument Provider | | | | | | | | | | | | | | |
| | | Secured Debt | (9) (30) | 7/19/2023 | | | SF+ | 6.25% | | 7/19/2028 | | — | | (34) | | (34) | | 0.0 | % |
| | | Secured Debt | (9) (30) | 7/19/2023 | | | SF+ | 6.25% | | 7/19/2029 | | — | | (29) | | (29) | | 0.0 | % |
| | | Secured Debt | (9) | 7/19/2023 | | 11.53% | SF+ | 6.25% | | 7/19/2029 | | 8,310 | | 8,111 | | 7,880 | | 1.3 | % |
| | | Common Equity | | 7/19/2023 | 47,847 | | | | | | 0.1 | % | | 239 | | 130 | | 0.0 | % |
| | | | | | | | | | | | | | 8,287 | | 7,947 | | 1.3 | % |
Inspire Aesthetics Management, LLC 1010 S Federal Hwy, Suite 1010 Delray Beach, FL 33483 | (10) | Surgical and Non-Surgical Plastic Surgery and Aesthetics Provider | | | | | | | | | | | | | | |
| | | Secured Debt | (9) (28) | 4/3/2023 | | 13.03% | SF+ | 8.00% | | 4/3/2028 | | 676 | | 662 | | 609 | | 0.1 | % |
| | | Secured Debt | (9) | 4/3/2023 | | 13.27% | SF+ | 8.00% | | 4/3/2028 | | 6,209 | | 6,093 | | 5,591 | | 0.9 | % |
| | | Secured Debt | (9) | 6/14/2023 | | 13.27% | SF+ | 8.00% | | 4/3/2028 | | 1,250 | | 1,227 | | 1,126 | | 0.2 | % |
| | | Common Equity | | 4/3/2023 | 101,719 | | | | | | 0.2 | % | | 322 | | 10 | | 0.0 | % |
| | | | | | | | | | | | | | 8,304 | | 7,336 | | 1.2 | % |
| | | | | | | | | | | | | | | | | | | | | | | | | | | | | | | | | | | | | | | | | | | | | | | | | | |
| Portfolio Company (1) (20) | | Business Description | Type of Investment (2) (3) (15) | | Investment Date (22) | Shares/Units | Total Rate | Reference Rate and Spread (25) | PIK Rate (19) | Maturity Date | Percentage of Class Held (35) | Principal (4) | Cost (4) | Fair Value (18) | Percentage of Net Assets |
Interface Security Systems, L.L.C 3773 Corporate Center Drive Earth City, MO 63045 | (10) | Commercial Security & Alarm Services | | | | | | | | | | | | | | |
| | | Secured Debt | (17) (28) | 12/9/2021 | | 15.06% | SF+ | 10.00% | 15.22% | 8/7/2023 | | 1,998 | | 1,998 | | 1,842 | | 0.3 | % |
| | | Secured Debt | (9) (14) (17) | 8/7/2019 | | 12.35% | SF+ | 7.00% | 12.35% | 8/7/2023 | | 7,334 | | 7,254 | | 11 | | 0.0 | % |
| | | Common Stock | | 12/7/2021 | 2,143 | | | | | | 2.1 | % | | — | | — | | 0.0 | % |
| | | | | | | | | | | | | | 9,252 | | 1,853 | | 0.3 | % |
Invincible Boat Company, LLC. 4700 NW 132nd Street Opa-Locka, FL 33054 | (10) | Manufacturer of Sport Fishing Boats | | | | | | | | | | | | | | |
| | | Secured Debt | (9) (28) | 8/28/2019 | | 11.29% | SF+ | 6.50% | | 8/28/2025 | | 1,037 | | 1,036 | | 991 | | 0.2 | % |
| | | Secured Debt | (9) | 8/28/2019 | | 11.25% | SF+ | 6.50% | | 8/28/2025 | | 16,812 | | 16,779 | | 16,070 | | 2.6 | % |
| | | | | | | | | | | | | | 17,815 | | 17,061 | | 2.8 | % |
INW Manufacturing, LLC 310 Park Lane Farmington, UT 84025 | (11) | Manufacturer of Nutrition and Wellness Products | | | | | | | | | | | | | | |
| | | Secured Debt | (9) | 5/19/2021 | | 10.62% | SF+ | 5.75% | | 3/25/2027 | | 6,375 | | 6,283 | | 5,355 | | 0.9 | % |
| | | | | | | | | | | | | | | | |
Iron-Main Investments, LLC 20890 Kenbridge Court Lakeville, MN 55044 | | Consumer Reporting Agency Providing Employment Background Checks and Drug Testing | | | | | | | | | | | | | | |
| | | Secured Debt | | 8/2/2021 | | 13.00% | | | | 1/31/2028 | | 1,128 | | 1,112 | | 1,112 | | 0.2 | % |
| | | Secured Debt | | 9/1/2021 | | 13.00% | | | | 1/31/2028 | | 735 | | 724 | | 724 | | 0.1 | % |
| | | Secured Debt | | 11/15/2021 | | 13.00% | | | | 1/31/2028 | | 2,236 | | 2,236 | | 2,236 | | 0.4 | % |
| | | Secured Debt | | 11/15/2021 | | 13.00% | | | | 1/31/2028 | | 4,406 | | 4,339 | | 4,339 | | 0.7 | % |
| | | Secured Debt | | 1/31/2023 | | 13.00% | | | | 1/31/2028 | | 2,521 | | 2,431 | | 2,431 | | 0.4 | % |
| | | Preferred Equity | | 6/26/2024 | 177,800 | 25.00% | | | 25.00% | | 3.0 | % | | 178 | | 190 | | 0.0 | % |
| | | Common Stock | | 8/3/2021 | 50,753 | | | | | | 1.6 | % | | 689 | | 710 | | 0.1 | % |
| | | | | | | | | | | | | | 11,709 | | 11,742 | | 1.9 | % |
Isagenix International, LLC 155 E Rivulon Boulevard Gilbert, AZ 85279 | (11) | Direct Marketer of Health & Wellness Products | | | | | | | | | | | | | | |
| | | Secured Debt | (9) | 4/13/2023 | | 11.89% | SF+ | 6.60% | 9.43% | 4/14/2028 | | 2,897 | | 2,700 | | 797 | | 0.1 | % |
| | | Common Equity | | 4/13/2023 | 186,322 | | | | | | 1.7 | % | | — | | — | | 0.0 | % |
| | | | | | | | | | | | | | 2,700 | | 797 | | 0.1 | % |
Island Pump and Tank, LLC 40 Doyle Court East Northport, NY 11731 | (10) | Provider of Facility and Maintenance Services to Fuel Retailers in Northeast U.S. | | | | | | | | | | | | | | |
| | | Secured Debt | (9) (30) | 5/20/2024 | | | SF+ | 6.50% | | 5/17/2029 | | — | | (6) | | (6) | | 0.0 | % |
| | | Secured Debt | (9) | 5/20/2024 | | 11.09% | SF+ | 5.50% | | 5/17/2029 | | 1,735 | | 1,706 | | 1,686 | | 0.3 | % |
| | | Secured Debt | (9) | 5/20/2024 | | 12.09% | SF+ | 6.50% | | 5/17/2029 | | 1,735 | | 1,706 | | 1,686 | | 0.3 | % |
| | | Secured Debt | (9) | 5/20/2024 | | 13.09% | SF+ | 7.50% | | 5/17/2029 | | 1,735 | | 1,706 | | 1,686 | | 0.3 | % |
| | | | | | | | | | | | | | 5,112 | | 5,052 | | 0.8 | % |
ITA Holdings Group, LLC 5601 W Interstate 40, Suite 300 Amarillo, TX 79106 | | Air Ambulance Services | | | | | | | | | | | | | | |
| | | Secured Debt | (9) | 6/21/2023 | | 15.53% | SF+ | 9.00% | 1.00% | 6/21/2027 | | 299 | | 294 | | 294 | | 0.0 | % |
| | | Secured Debt | (9) | 6/21/2023 | | 15.53% | SF+ | 9.00% | 1.00% | 6/21/2027 | | 252 | | 248 | | 248 | | 0.0 | % |
| | | Secured Debt | (9) | 6/21/2023 | | 14.53% | SF+ | 8.00% | 1.00% | 6/21/2027 | | 1,105 | | 915 | | 915 | | 0.1 | % |
| | | Secured Debt | (9) | 6/21/2023 | | 16.53% | SF+ | 10.00% | 1.00% | 6/21/2027 | | 1,105 | | 915 | | 915 | | 0.1 | % |
| | | | | | | | | | | | | | | | | | | | | | | | | | | | | | | | | | | | | | | | | | | | | | | | | | |
| Portfolio Company (1) (20) | | Business Description | Type of Investment (2) (3) (15) | | Investment Date (22) | Shares/Units | Total Rate | Reference Rate and Spread (25) | PIK Rate (19) | Maturity Date | Percentage of Class Held (35) | Principal (4) | Cost (4) | Fair Value (18) | Percentage of Net Assets |
| | | Warrants | (27) | 6/21/2023 | 48,327 | | | | | 6/21/2033 | 3.2 | % | | 523 | | 820 | | 0.1 | % |
| | | | | | | | | | | | | | 2,895 | | 3,192 | | 0.5 | % |
Jackmont Hospitality, Inc. 1760 Peachtree Street, Suite 200 Atlanta, GA 30309 | (10) | Franchisee of Casual Dining Restaurants | | | | | | | | | | | | | | |
| | | Secured Debt | (9) (26) | 10/26/2022 | | 12.86% | SF+ | 7.50% | | 11/4/2024 | | 1,607 | | 1,604 | | 1,607 | | 0.3 | % |
| | | Secured Debt | (9) | 2/27/2024 | | 15.28% | SF+ | 10.00% | | 11/4/2024 | | 1,251 | | 1,244 | | 1,251 | | 0.2 | % |
| | | Secured Debt | (9) | 11/8/2021 | | 12.90% | SF+ | 7.50% | | 11/4/2024 | | 3,738 | | 3,738 | | 3,738 | | 0.6 | % |
| | | Preferred Equity | | 11/8/2021 | 5,653,333 | | | | | | 13.3 | % | | 216 | | 1,740 | | 0.3 | % |
| | | | | | | | | | | | | | 6,802 | | 8,336 | | 1.3 | % |
JDC Power Services, LLC 84 Business Park Drive, Suite 106 Armonk, NY 10504 | (10) | Provider of Electrical Equipment and Maintenance Services for Datacenters | | | | | | | | | | | | | | |
| | | Secured Debt | (9) (30) | 6/28/2024 | | | SF+ | 6.75% | | 6/28/2029 | | — | | (49) | | (49) | | 0.0 | % |
| | | Secured Debt | (9) | 6/28/2024 | | 11.35% | SF+ | 6.75% | | 6/28/2029 | | 17,783 | | 17,367 | | 17,076 | | 2.8 | % |
| | | | | | | | | | | | | | 17,318 | | 17,027 | | 2.8 | % |
Joerns Healthcare, LLC 2430 Whitehall Park Drive, Suite 100 Charlotte, NC 28273 | (11) | Manufacturer and Distributor of Health Care Equipment & Supplies | | | | | | | | | | | | | | |
| | | Secured Debt | (9) (14) (17) | 8/21/2019 | | 21.59% | SF+ | 16.00% | 21.59% | 8/21/2024 | | 942 | | 942 | | — | | 0.0 | % |
| | | Secured Debt | (9) (14) (17) | 8/21/2019 | | 21.59% | SF+ | 16.00% | 21.59% | 8/21/2024 | | 906 | | 906 | | — | | 0.0 | % |
| | | Secured Debt | (9) | 3/30/2024 | | 13.45% | SF+ | 8.75% | 6.00% | 3/29/2029 | | 1,666 | | 1,666 | | 1,666 | | 0.3 | % |
| | | Secured Debt | (9) | 3/30/2024 | | 13.45% | SF+ | 8.75% | 13.45% | 3/29/2029 | | 1,055 | | 1,055 | | 1,055 | | 0.2 | % |
| | | Common Stock | | 8/21/2019 | 392,514 | | | | | | 3.8 | % | | 3,678 | | — | | 0.0 | % |
| | | Common Stock | | 3/29/2024 | 4,535,784 | | | | | | 4.1 | % | | 166 | | 166 | | 0.0 | % |
| | | | | | | | | | | | | | 8,413 | | 2,887 | | 0.5 | % |
JorVet Holdings, LLC 1450 Van Buren Avenue Loveland, CO 80538 | | Supplier and Distributor of Veterinary Equipment and Supplies | | | | | | | | | | | | | | |
| | | Secured Debt | | 3/28/2022 | | 12.00% | | | | 3/28/2027 | | 2,750 | | 2,723 | | 2,723 | | 0.4 | % |
| | | Preferred Equity | (8) | 3/28/2022 | 12,214 | | | | | | 9.7 | % | | 1,221 | | 1,250 | | 0.2 | % |
| | | | | | | | | | | | | | 3,944 | | 3,973 | | 0.6 | % |
JTI Electrical & Mechanical, LLC 3901 Fanucchi Way Unit 201 Shafter, CA 93263 | (10) | Electrical, Mechanical and Automation Services | | | | | | | | | | | | | | |
| | | Secured Debt | (9) (28) | 12/22/2021 | | 13.37% | SF+ | 8.00% | | 12/22/2026 | | 702 | | 695 | | 664 | | 0.1 | % |
| | | Secured Debt | (9) | 12/22/2021 | | 12.85% | SF+ | 8.00% | | 12/22/2026 | | 2,980 | | 2,953 | | 2,820 | | 0.5 | % |
| | | Secured Debt | (9) | 2/1/2024 | | 12.85% | SF+ | 8.00% | | 12/22/2026 | | 279 | | 272 | | 264 | | 0.0 | % |
| | | Common Equity | | 12/22/2021 | 140,351 | | | | | | 0.3 | % | | 140 | | 20 | | 0.0 | % |
| | | | | | | | | | | | | | 4,060 | | 3,768 | | 0.6 | % |
KMS, LLC 3901 Fanucchi Way, Unit 201 Shafter, CA 93263 | (10) | Wholesaler of Closeout and Value-priced Products | | | | | | | | | | | | | | |
| | | Secured Debt | (9) (14) | 10/4/2021 | | 14.50% | SF+ | 9.75% | | 10/4/2026 | | 1,286 | | 1,238 | | 967 | | 0.2 | % |
| | | Secured Debt | (9) (14) | 10/4/2021 | | 14.50% | SF+ | 9.75% | | 10/4/2026 | | 9,262 | | 9,175 | | 6,966 | | 1.1 | % |
| | | | | | | | | | | | | | 10,413 | | 7,933 | | 1.3 | % |
Lightbox Holdings, L.P. 1450 Broadway 41st Floor New York City, NY 10018 | (11) | Provider of Commercial Real Estate Software | | | | | | | | | | | | | | |
| | | Secured Debt | | 5/9/2019 | | 10.11% | SF+ | 5.00% | | 5/9/2026 | | 5,720 | | 5,701 | | 5,548 | | 0.9 | % |
| | | | | | | | | | | | | | | | | | | | | | | | | | | | | | | | | | | | | | | | | | | | | | | | | | |
| Portfolio Company (1) (20) | | Business Description | Type of Investment (2) (3) (15) | | Investment Date (22) | Shares/Units | Total Rate | Reference Rate and Spread (25) | PIK Rate (19) | Maturity Date | Percentage of Class Held (35) | Principal (4) | Cost (4) | Fair Value (18) | Percentage of Net Assets |
| | | | | | | | | | | | | | | | |
LL Management, Inc. 30 Railroad Avenue West Haven, CT 06516 | (10) | Medical Transportation Service Provider | | | | | | | | | | | | | | |
| | | Secured Debt | (9) | 9/17/2024 | | 12.43% | SF+ | 7.25% | | 12/31/2025 | | 601 | | 601 | | 601 | | 0.1 | % |
| | | Secured Debt | (9) | 5/2/2019 | | 12.60% | SF+ | 7.25% | | 12/31/2025 | | 7,872 | | 7,798 | | 7,872 | | 1.3 | % |
| | | Secured Debt | (9) | 5/2/2019 | | 12.60% | SF+ | 7.25% | | 12/31/2025 | | 5,194 | | 5,144 | | 5,194 | | 0.8 | % |
| | | Secured Debt | (9) | 2/26/2021 | | 12.60% | SF+ | 7.25% | | 12/31/2025 | | 863 | | 854 | | 863 | | 0.1 | % |
| | | Secured Debt | (9) | 5/12/2022 | | 12.60% | SF+ | 7.25% | | 12/31/2025 | | 8,737 | | 8,651 | | 8,737 | | 1.4 | % |
| | | | | | | | | | | | | | 23,048 | | 23,267 | | 3.8 | % |
LLFlex, LLC 1225 West Burnett Avenue Louisville, KY 40210 | (10) | Provider of Metal-Based Laminates | | | | | | | | | | | | | | |
| | | Secured Debt | (9) | 8/16/2021 | | 13.48% | SF+ | 8.00% | 3.00% | 8/16/2026 | | 4,510 | | 4,472 | | 3,724 | | 0.6 | % |
| | | | | | | | | | | | | | | | |
Logix Acquisition Company, LLC 2950 N Loop W 10th Floor Houston, TX 77092 | (10) | Competitive Local Exchange Carrier | | | | | | | | | | | | | | |
| | | Secured Debt | (9) | 1/8/2018 | | 13.25% | P+ | 4.75% | | 12/22/2024 | | 11,552 | | 11,486 | | 8,578 | | 1.4 | % |
| | | | | | | | | | | | | | | | |
Mako Steel, LP 5650 El Camino Real, Suite 100 Carlsbad, CA 92008 | (10) | Self-Storage Design & Construction | | | | | | | | | | | | | | |
| | | Secured Debt | (9) (30) | 3/15/2021 | | | SF+ | 7.50% | | 3/15/2026 | | — | | (24) | | — | | 0.0 | % |
| | | Secured Debt | (9) | 3/28/2024 | | 12.59% | SF+ | 7.50% | | 3/15/2026 | | 21,222 | | 21,014 | | 21,222 | | 3.4 | % |
| | | | | | | | | | | | | | 20,990 | | 21,222 | | 3.4 | % |
Metalforming Holdings, LLC 100 International Drive Peachtree City, GA 30269 | | Distributor of Sheet Metal Folding and Metal Forming Equipment | | | | | | | | | | | | | | |
| | | Secured Debt | (30) | 10/19/2022 | | | | | | 10/19/2025 | | — | | — | | — | | 0.0 | % |
| | | Secured Debt | | 10/19/2022 | | 10.75% | | | | 10/19/2027 | | 1,663 | | 1,633 | | 1,633 | | 0.3 | % |
| | | Preferred Equity | (8) | 10/19/2022 | 434,331 | 8.00% | | | 8.00% | | 3.1 | % | | 434 | | 460 | | 0.1 | % |
| | | Common Stock | | 10/19/2022 | 112,865 | | | | | | 2.8 | % | | 113 | | 290 | | 0.0 | % |
| | | | | | | | | | | | | | 2,180 | | 2,383 | | 0.4 | % |
Microbe Formulas, LLC 3750 E Pewter Falls Street, Suite 100 Meridian, ID 83642 | (10) | Nutritional Supplements Provider | | | | | | | | | | | | | | |
| | | Secured Debt | (9) (30) | 4/4/2022 | | | SF+ | 6.00% | | 4/3/2028 | | — | | (5) | | (5) | | 0.0 | % |
| | | Secured Debt | (9) | 4/4/2022 | | 10.95% | SF+ | 6.00% | | 4/3/2028 | | 2,497 | | 2,466 | | 2,497 | | 0.4 | % |
| | | | | | | | | | | | | | 2,461 | | 2,492 | | 0.4 | % |
Mills Fleet Farm Group, LLC 2401 S Memorial Drive Appleton, WI 54915 | (10) | Omnichannel Retailer of Work, Farm and Lifestyle Merchandise | | | | | | | | | | | | | | |
| | | Secured Debt | (9) | 10/24/2018 | | 12.56% | SF+ | 7.00% | | 12/31/2026 | | 18,152 | | 17,935 | | 16,242 | | 2.6 | % |
| | | | | | | | | | | | | | | | |
Mini Melts of America, LLC 245 Asylum Street Norwich, CT 06360
| (10) | Manufacturer and Distributor of Branded Premium Beaded Ice Cream | | | | | | | | | | | | | | |
| | | Secured Debt | (9) (28) | 11/30/2023 | | 11.37% | SF+ | 6.25% | | 11/30/2028 | | 975 | | 951 | | 975 | | 0.2 | % |
| | | Secured Debt | (9) (26) | 11/30/2023 | | 11.33% | SF+ | 6.25% | | 11/30/2028 | | 860 | | 842 | | 860 | | 0.1 | % |
| | | Secured Debt | (9) | 11/30/2023 | | 10.31% | SF+ | 5.25% | | 11/30/2028 | | 3,209 | | 3,144 | | 3,209 | | 0.5 | % |
| | | Secured Debt | (9) | 11/30/2023 | | 12.31% | SF+ | 7.25% | | 11/30/2028 | | 3,209 | | 3,142 | | 3,209 | | 0.5 | % |
| | | | | | | | | | | | | | | | | | | | | | | | | | | | | | | | | | | | | | | | | | | | | | | | | | |
| Portfolio Company (1) (20) | | Business Description | Type of Investment (2) (3) (15) | | Investment Date (22) | Shares/Units | Total Rate | Reference Rate and Spread (25) | PIK Rate (19) | Maturity Date | Percentage of Class Held (35) | Principal (4) | Cost (4) | Fair Value (18) | Percentage of Net Assets |
| | | Common Equity | | 11/30/2023 | 300,000 | | | | | | 0.3 | % | | 300 | | 300 | | 0.0 | % |
| | | | | | | | | | | | | | 8,379 | | 8,553 | | 1.4 | % |
MoneyThumb Acquisition, LLC 150 Washington Avenue, Suite 201 Sante Fe, New Mexico 87501 | | Provider of Software-as-a-Service Financial File Conversion and Reconciliation | | | | | | | | | | | | | | |
| | | Secured Debt | | 8/19/2024 | | 14.00% | | | | 8/19/2029 | | 2,400 | | 2,186 | | 2,186 | | 0.4 | % |
| | | Preferred Member Units | (8) | 8/19/2024 | 40,821 | 12.00% | | | 12.00% | | 4.1 | % | | 414 | | 414 | | 0.1 | % |
| | | Warrants | (27) | 8/19/2024 | 14,842 | | | | | | 1.0 | % | | 148 | | 148 | | 0.0 | % |
| | | | | | | | | | | | | | 2,748 | | 2,748 | | 0.4 | % |
MonitorUS Holding, LLC 7th Floor 186 Shoreditch High Street London E1 6HU United Kingdom | (10) (13) (21) | SaaS Provider of Media Intelligence Services | | | | | | | | | | | | | | |
| | | Secured Debt | | 5/24/2022 | | 14.00% | | | 4.00% | 5/24/2027 | | 1,155 | | 1,143 | | 1,181 | | 0.2 | % |
| | | Secured Debt | | 5/24/2022 | | 14.00% | | | 4.00% | 5/24/2027 | | 3,002 | | 2,970 | | 3,319 | | 0.5 | % |
| | | Secured Debt | | 5/24/2022 | | 14.00% | | | 4.00% | 5/24/2027 | | 5,109 | | 5,057 | | 5,109 | | 0.8 | % |
| | | Unsecured Debt | | 11/14/2023 | | 8.00% | | | 8.00% | 3/31/2025 | | 32 | | 32 | | 32 | | 0.0 | % |
| | | Unsecured Debt | | 3/15/2024 | | 8.00% | | | 8.00% | 6/30/2025 | | 16 | | 16 | | 16 | | 0.0 | % |
| | | Unsecured Debt | | 9/25/2024 | | 8.00% | | | 8.00% | 12/21/2025 | | 30 | | 30 | | 30 | | 0.0 | % |
| | | Common Stock | | 8/30/2022 | 12,798,820 | | | | | | 0.2 | % | | 256 | | 211 | | 0.0 | % |
| | | | | | | | | | | | | | 9,504 | | 9,898 | | 1.6 | % |
NinjaTrader, LLC 222 N LaSalle Street, Suite 1450 Chicago, IL 60601 | (10) | Operator of Futures Trading Platform | | | | | | | | | | | | | | |
| | | Secured Debt | (9) (30) | 12/18/2019 | | | SF+ | 6.50% | | 12/18/2026 | | — | | (3) | | (3) | | 0.0 | % |
| | | Secured Debt | (9) | 12/18/2019 | | 11.98% | SF+ | 6.50% | | 12/18/2026 | | 14,651 | | 14,521 | | 14,651 | | 2.4 | % |
| | | | | | | | | | | | | | 14,518 | | 14,648 | | 2.4 | % |
Obra Capital, Inc. 437 Madison Avenue, 26th Floor New York, NY 10022 | (10) | Provider of Asset Management Services Specialized in Insurance-Linked Strategies | | | | | | | | | | | | | | |
| | | Secured Debt | (9) (30) | 6/21/2024 | | | SF+ | 7.50% | | 12/21/2028 | | — | | (14) | | (14) | | 0.0 | % |
| | | Secured Debt | (9) | 6/21/2024 | | 12.53% | SF+ | 7.50% | | 6/21/2029 | | 11,979 | | 11,643 | | 11,514 | | 1.9 | % |
| | | | | | | | | | | | | | 11,629 | | 11,500 | | 1.9 | % |
OnPoint 906 West 13th Street Deer Park, TX 77536 | (10) | Environmental & Facilities Services | | | | | | | | | | | | | | |
| | | Secured Debt | (9) | 4/1/2024 | | 11.60% | SF+ | 7.00% | | 11/16/2027 | | 2,910 | | 2,886 | | 2,886 | | 0.5 | % |
| | | | | | | | | | | | | | | | |
Peaches Holding Corporation 2450 Edison Blvd, Suite 3 Twinsburg, OH 44087 | | Wholesale Provider of Consumer Packaging Solutions | | | | | | | | | | | | | | |
| | | Common Equity | | 5/22/2024 | 806 | | | | | | 0.7 | % | | 1,805 | | 1,805 | | 0.3 | % |
| | | | | | | | | | | | | | | | |
Power System Solutions 21301 HWY 71 W Spicewood, TX 78669 | (10) | Backup Power Generation | | | | | | | | | | | | | | |
| | | Secured Debt | (9) (30) | 6/7/2023 | | | SF+ | 6.50% | | 6/7/2028 | | — | | (29) | | (29) | | 0.0 | % |
| | | Secured Debt | (9) | 6/7/2023 | | 11.35% | SF+ | 6.50% | | 6/7/2028 | | 2,646 | | 2,583 | | 2,646 | | 0.4 | % |
| | | Secured Debt | (9) | 6/7/2023 | | 11.60% | SF+ | 6.50% | | 6/7/2028 | | 7,879 | | 7,705 | | 7,879 | | 1.3 | % |
| | | Common Equity | | 6/7/2023 | 532 | | | | | | 0.8 | % | | 532 | | 1,360 | | 0.2 | % |
| | | | | | | | | | | | | | | | | | | | | | | | | | | | | | | | | | | | | | | | | | | | | | | | | | |
| Portfolio Company (1) (20) | | Business Description | Type of Investment (2) (3) (15) | | Investment Date (22) | Shares/Units | Total Rate | Reference Rate and Spread (25) | PIK Rate (19) | Maturity Date | Percentage of Class Held (35) | Principal (4) | Cost (4) | Fair Value (18) | Percentage of Net Assets |
| | | | | | | | | | | | | | 10,791 | | 11,856 | | 1.9 | % |
PrimeFlight Aviation Services 3 Sugar Creek Center Boulevard, Suite 450 Sugar Land, TX 77478 | (10) | Air Freight & Logistics | | | | | | | | | | | | | | |
| | | Secured Debt | (9) | 5/1/2023 | | 10.58% | SF+ | 5.50% | | 5/1/2029 | | 5,925 | | 5,757 | | 5,925 | | 1.0 | % |
| | | Secured Debt | (9) | 9/7/2023 | | 10.10% | SF+ | 5.50% | | 5/1/2029 | | 566 | | 548 | | 566 | | 0.1 | % |
| | | Secured Debt | (9) | 1/30/2024 | | 10.10% | SF+ | 5.50% | | 5/1/2029 | | 569 | | 556 | | 569 | | 0.1 | % |
| | | Secured Debt | (9) | 6/28/2024 | | 9.85% | SF+ | 5.25% | | 5/1/2029 | | 646 | | 637 | | 646 | | 0.1 | % |
| | | | | | | | | | | | | | 7,498 | | 7,706 | | 1.2 | % |
PTL US Bidco, Inc Atholl House 51 Melville Street Edinburgh EH3 7HL | (10) (13) (21) | Manufacturers of Equipment, Including Drilling Rigs and Equipment, and Providers of Supplies and Services to Companies Involved in the Drilling, Evaluation and Completion of Oil and Gas Wells | | | | | | | | | | | | | | |
| | | Secured Debt | (9) (28) | 8/19/2022 | | 12.19% | SF+ | 6.75% | | 8/19/2027 | | 448 | | 441 | | 442 | | 0.1 | % |
| | | Secured Debt | (9) | 8/19/2022 | | 12.13% | SF+ | 6.75% | | 8/19/2027 | | 1,422 | | 1,404 | | 1,403 | | 0.2 | % |
| | | | | | | | | | | | | | 1,845 | | 1,845 | | 0.3 | % |
Purge Rite, LLC 13802 N Hwy 75 Willis, TX 77378 | (10) | HVAC Flushing and Filtration Services | | | | | | | | | | | | | | |
| | | Secured Debt | (9) (30) | 10/2/2023 | | | SF+ | 8.00% | | 10/2/2028 | | — | | (16) | | (16) | | 0.0 | % |
| | | Secured Debt | (9) | 10/2/2023 | | 13.64% | SF+ | 8.00% | | 10/2/2028 | | 3,906 | | 3,828 | | 3,906 | | 0.6 | % |
| | | Preferred Equity | | 10/2/2023 | 13,021 | | | | | | 3.8 | % | | 1,289 | | 1,289 | | 0.2 | % |
| | | Common Equity | | 4/1/2024 | 13,021 | | | | | | 1.0 | % | | 13 | | 520 | | 0.1 | % |
| | | | | | | | | | | | | | 5,114 | | 5,699 | | 0.9 | % |
Richardson Sales Solutions 2001 Market Street, Suite 2850 Philadelphia, PA 19103 | (10) | Business Services | | | | | | | | | | | | | | |
| | | Secured Debt | (9) (28) | 8/24/2023 | | 11.92% | SF+ | 6.75% | | 8/24/2028 | | 1,333 | | 1,288 | | 1,313 | | 0.2 | % |
| | | Secured Debt | (9) | 8/24/2023 | | 12.03% | SF+ | 6.75% | | 8/24/2028 | | 10,354 | | 10,109 | | 10,194 | | 1.6 | % |
| | | Secured Debt | (9) | 9/10/2024 | | 11.86% | SF+ | 6.75% | | 8/24/2028 | | 5,097 | | 4,997 | | 5,018 | | 0.8 | % |
| | | | | | | | | | | | | | 16,394 | | 16,525 | | 2.7 | % |
Roof Opco, LLC 1209 N Avenue, Suite 13 Plano, TX 75074 | (10) | Residential Re-Roofing/Repair | | | | | | | | | | | | | | |
| | | Secured Debt | (9) (30) | 8/27/2021 | | | SF+ | 8.00% | | 8/27/2026 | | — | | (7) | | — | | 0.0 | % |
| | | Secured Debt | (9) | 8/27/2021 | | 12.59% | SF+ | 7.00% | | 8/27/2026 | | 4,223 | | 4,158 | | 4,057 | | 0.7 | % |
| | | Secured Debt | (9) | 8/27/2021 | | 14.59% | SF+ | 9.00% | | 8/27/2026 | | 4,223 | | 4,158 | | 4,016 | | 0.6 | % |
| | | | | | | | | | | | | | 8,309 | | 8,073 | | 1.3 | % |
Rug Doctor, LLC. 2201 West Plano Parkway, Suite 100 Plano, TX 75075 | (10) | Carpet Cleaning Products and Machinery | | | | | | | | | | | | | | |
| | | Secured Debt | (9) | 7/16/2021 | | 12.79% | SF+ | 8.00% | 2.00% | 11/16/2025 | | 6,509 | | 6,496 | | 6,509 | | 1.1 | % |
| | | Secured Debt | (9) | 7/16/2021 | | 12.79% | SF+ | 8.00% | 2.00% | 11/16/2025 | | 8,465 | | 8,446 | | 8,465 | | 1.4 | % |
| | | | | | | | | | | | | | 14,942 | | 14,974 | | 2.4 | % |
Slick Innovations, LLC 301 E 2nd St, Suite 304 Jamestown, NY 14701 | | Text Message Marketing Platform | | | | | | | | | | | | | | |
| | | Secured Debt | | 9/13/2018 | | 14.00% | | | | 12/22/2027 | | 4,200 | | 4,087 | | 4,200 | | 0.7 | % |
| | | Common Stock | (8) | 9/13/2018 | 17,500 | | | | | | 1.6 | % | | — | | 540 | | 0.1 | % |
| | | | | | | | | | | | | | 4,087 | | 4,740 | | 0.8 | % |
| | | | | | | | | | | | | | | | | | | | | | | | | | | | | | | | | | | | | | | | | | | | | | | | | | |
| Portfolio Company (1) (20) | | Business Description | Type of Investment (2) (3) (15) | | Investment Date (22) | Shares/Units | Total Rate | Reference Rate and Spread (25) | PIK Rate (19) | Maturity Date | Percentage of Class Held (35) | Principal (4) | Cost (4) | Fair Value (18) | Percentage of Net Assets |
South Coast Terminals Holdings, LLC 7401 Wallisville Road Houston, TX 77020 | (10) | Specialty Toll Chemical Manufacturer | | | | | | | | | | | | | | |
| | | Secured Debt | (9) (30) | 8/8/2024 | | | SF+ | 5.25% | | 8/8/2029 | | — | | — | | — | | 0.0 | % |
| | | Secured Debt | (9) | 8/8/2024 | | 10.20% | SF+ | 5.25% | | 8/8/2029 | | 4,388 | | 4,355 | | 4,355 | | 0.7 | % |
| | | Common Equity | | 12/10/2021 | 61 | | | | | | 0.0 | % | | 61 | | 59 | | 0.0 | % |
| | | | | | | | | | | | | | 4,416 | | 4,414 | | 0.7 | % |
SPAU Holdings, LLC 1616 Stout St, Suite 200 Denver, CO 80202 | (10) | Digital Photo Product Provider | | | | | | | | | | | | | | |
| | | Secured Debt | (9) (28) | 7/1/2022 | | 12.46% | SF+ | 7.50% | | 7/1/2027 | | 780 | | 769 | | 780 | | 0.1 | % |
| | | Secured Debt | (9) | 7/1/2022 | | 12.45% | SF+ | 7.50% | | 7/1/2027 | | 4,888 | | 4,834 | | 4,888 | | 0.8 | % |
| | | Common Stock | | 7/1/2022 | 200,000 | | | | | | 0.5 | % | | 200 | | 190 | | 0.0 | % |
| | | | | | | | | | | | | | 5,803 | | 5,858 | | 0.9 | % |
Tex Tech Tennis, LLC 4448 West Lover Lane Dallas, TX 75209 | (10) | Sporting Goods & Textiles | | | | | | | | | | | | | | |
| | | Preferred Equity | (23) | 7/7/2021 | 1,000,000 | | | | | | 3.0 | % | | 1,000 | | 2,410 | | 0.4 | % |
| | | | | | | | | | | | | | | | |
The Affiliati Network, LLC 804 Anacapa Street Santa Barbara, CA 93101 | | Performance Marketing Solutions | | | | | | | | | | | | | | |
| | | Secured Debt | (30) | 8/9/2021 | | | | | | 8/9/2026 | | — | | (2) | | (2) | | 0.0 | % |
| | | Secured Debt | | 8/9/2021 | | 10.00% | | | | 8/9/2026 | | 1,400 | | 1,388 | | 1,372 | | 0.2 | % |
| | | Preferred Stock | (8) | 9/1/2023 | 65,427 | | | | | | 3.2 | % | | 65 | | 65 | | 0.0 | % |
| | | Preferred Stock | (8) | 8/9/2021 | 320,000 | | | | | | 20.0 | % | | 1,600 | | 1,600 | | 0.3 | % |
| | | | | | | | | | | | | | 3,051 | | 3,035 | | 0.5 | % |
Titan Meter Midco Corp. 5825 North Sam Houston Parkway West, Suite 120 Houston, TX 77086 | (10) | Value Added Distributor of a Variety of Metering and Measurement Products and Solutions to the Energy Industry | | | | | | | | | | | | | | |
| | | Secured Debt | (9) (30) | 3/11/2024 | | | SF+ | 6.50% | | 3/11/2029 | | — | | (43) | | (43) | | 0.0 | % |
| | | Secured Debt | (9) | 3/11/2024 | | 11.10% | SF+ | 6.50% | | 3/11/2029 | | 13,082 | | 12,676 | | 12,844 | | 2.1 | % |
| | | Preferred Equity | | 3/11/2024 | 468,750 | 8.00% | | | 8.00% | | 0.4 | % | | 469 | | 469 | | 0.1 | % |
| | | | | | | | | | | | | | 13,102 | | 13,270 | | 2.1 | % |
U.S. TelePacific Corp. 515 S Flower Street, 47th Floor Los Angeles, CA 90071 | (11) | Provider of Communications and Managed Services | | | | | | | | | | | | | | |
| | | Secured Debt | (9) (14) | 6/1/2023 | | 12.50% | SF+ | 7.15% | 6.00% | 5/2/2027 | | 6,755 | | 2,458 | | 2,702 | | 0.4 | % |
| | | Secured Debt | (14) | 6/1/2023 | | | | | | 5/2/2027 | | 692 | | 15 | | — | | 0.0 | % |
| | | | | | | | | | | | | | 2,473 | | 2,702 | | 0.4 | % |
UPS Intermediate, LLC 4460 Highway 225 Deer Park, TX 77536 | (10) | Provider of Maintenance, Repair, and Overhaul Services for Industrial Equipment Serving the Refining, Chemical, Midstream, Renewables, Power, and Utilities End Markets | | | | | | | | | | | | | | |
| | | Secured Debt | (9) | 7/29/2024 | | 11.51% | SF+ | 6.25% | | 7/27/2029 | | 19,539 | | 19,147 | | 19,147 | | 3.1 | % |
| | | Common Equity | | 7/29/2024 | 412,371 | | | | | | 0.5 | % | | 412 | | 412 | | 0.1 | % |
| | | | | | | | | | | | | | 19,559 | | 19,559 | | 3.2 | % |
| | | | | | | | | | | | | | | | | | | | | | | | | | | | | | | | | | | | | | | | | | | | | | | | | | |
| Portfolio Company (1) (20) | | Business Description | Type of Investment (2) (3) (15) | | Investment Date (22) | Shares/Units | Total Rate | Reference Rate and Spread (25) | PIK Rate (19) | Maturity Date | Percentage of Class Held (35) | Principal (4) | Cost (4) | Fair Value (18) | Percentage of Net Assets |
Urgent DSO LLC 10409 East Washington Street Indianapolis, IN 46229 | | General and Emergency Dentistry Practice | | | | | | | | | | | | | | |
| | | Secured Debt | | 2/16/2024 | | 13.50% | | | | 2/16/2029 | | 2,200 | | 2,142 | | 2,142 | | 0.3 | % |
| | | Preferred Equity | (8) | 2/16/2024 | 1,000 | 9.00% | | | 9.00% | | 11.4 | % | | 1,057 | | 1,057 | | 0.2 | % |
| | | | | | | | | | | | | | 3,199 | | 3,199 | | 0.5 | % |
UserZoom Technologies, Inc. 1484 Pollard Road, Suite 271 Los Gatos, CA 95032 | (10) | Provider of User Experience Research Automation Software | | | | | | | | | | | | | | |
| | | Secured Debt | (9) | 1/11/2023 | | 12.75% | SF+ | 7.50% | | 4/5/2029 | | 3,000 | | 2,934 | | 3,000 | | 0.5 | % |
| | | | | | | | | | | | | | | | |
Vistar Media, Inc. 149 5th Avenue 6th Floor New York, NY 10011 | (10) | Operator of Digital Out-of-Home Advertising Platform | | | | | | | | | | | | | | |
| | | Preferred Stock | | 4/3/2019 | 70,207 | | | | | | 22.5 | % | | 767 | | 3,180 | | 0.5 | % |
| | | | | | | | | | | | | | | | |
Vitesse Systems 37955 Central Court Newark, CA 94560 | (10) | Component Manufacturing and Machining Platform | | | | | | | | | | | | | | |
| | | Secured Debt | (9) (32) | 12/22/2023 | | 12.47% | | | | 12/22/2028 | | 1,705 | | 1,666 | | 1,705 | | 0.3 | % |
| | | Secured Debt | (9) | 12/22/2023 | | 11.96% | SF+ | 7.00% | | 12/22/2028 | | 12,406 | | 12,146 | | 12,406 | | 2.0 | % |
| | | | | | | | | | | | | | 13,812 | | 14,111 | | 2.3 | % |
VORTEQ Coil Finishers, LLC 135 Alleghany Avenue, Suite A Oakmont, PA 15139 | (10) | Specialty Coating of Aluminum and Light-Gauge Steel | | | | | | | | | | | | | | |
| | | Common Equity | (8) | 11/30/2021 | 769,231 | | | | | | 2.7 | % | | 769 | | 1,910 | | 0.3 | % |
| | | | | | | | | | | | | | | | |
Wall Street Prep, Inc. 1330 Beacon Street Brookline, MA 02446 | (10) | Financial Training Services | | | | | | | | | | | | | | |
| | | Secured Debt | (9) (30) | 7/19/2021 | | | SF+ | 7.00% | | 7/19/2026 | | — | | (4) | | (4) | | 0.0 | % |
| | | Secured Debt | (9) | 7/19/2021 | | 12.48% | SF+ | 7.00% | | 7/19/2026 | | 3,733 | | 3,702 | | 3,733 | | 0.6 | % |
| | | Common Stock | | 7/19/2021 | 500,000 | | | | | | 0.9 | % | | 500 | | 1,160 | | 0.2 | % |
| | | | | | | | | | | | | | 4,198 | | 4,889 | | 0.8 | % |
Watterson Brands, LLC 1700 E Golf Road Suite 500 Schaumburg, IL 60173 | (10) | Facility Management Services | | | | | | | | | | | | | | |
| | | Secured Debt | | 12/17/2021 | | 12.00% | | | 4.00% | 12/17/2026 | | 306 | | 303 | | 290 | | 0.0 | % |
| | | Secured Debt | | 12/17/2021 | | 12.00% | | | 4.00% | 12/17/2026 | | 53 | | 48 | | 50 | | 0.0 | % |
| | | Secured Debt | | 12/17/2021 | | 12.00% | | | 4.00% | 12/17/2026 | | 2,177 | | 2,162 | | 2,059 | | 0.3 | % |
| | | Secured Debt | | 12/17/2021 | | 12.00% | | | 4.00% | 12/17/2026 | | 1,965 | | 1,951 | | 1,858 | | 0.3 | % |
| | | | | | | | | | | | | | 4,464 | | 4,257 | | 0.7 | % |
West Star Aviation Acquisition, LLC 2 Airline Court East Alton, IL 62024 | (10) | Aircraft, Aircraft Engine and Engine Parts | | | | | | | | | | | | | | |
| | | Secured Debt | (9) (26) | 3/1/2022 | | 9.60% | SF+ | 5.00% | | 3/1/2028 | | 662 | | 652 | | 662 | | 0.1 | % |
| | | Secured Debt | (9) | 3/1/2022 | | 9.60% | SF+ | 5.00% | | 3/1/2028 | | 2,925 | | 2,888 | | 2,925 | | 0.5 | % |
| | | Secured Debt | (9) | 11/3/2023 | | 9.60% | SF+ | 5.00% | | 3/1/2028 | | 1,456 | | 1,430 | | 1,456 | | 0.2 | % |
| | | Common Stock | (8) | 3/1/2022 | 200,000 | | | | | | 0.1 | % | | 200 | | 590 | | 0.1 | % |
| | | | | | | | | | | | | | 5,170 | | 5,633 | | 0.9 | % |
| | | | | | | | | | | | | | | | | | | | | | | | | | | | | | | | | | | | | | | | | | | | | | | | | | |
| Portfolio Company (1) (20) | | Business Description | Type of Investment (2) (3) (15) | | Investment Date (22) | Shares/Units | Total Rate | Reference Rate and Spread (25) | PIK Rate (19) | Maturity Date | Percentage of Class Held (35) | Principal (4) | Cost (4) | Fair Value (18) | Percentage of Net Assets |
Winter Services LLC 2100 S 116th Street West Allis, WI 53227 | (10) | Provider of Snow Removal and Ice Management Services | | | | | | | | | | | | | | |
| | | Secured Debt | (9) | 11/19/2021 | | 13.59% | SF+ | 8.00% | | 11/19/2026 | | 833 | | 778 | | 800 | | 0.1 | % |
| | | Secured Debt | (9) | 11/19/2021 | | 13.59% | SF+ | 8.00% | | 11/19/2026 | | 2,343 | | 2,305 | | 2,248 | | 0.4 | % |
| | | Secured Debt | (9) | 1/16/2024 | | 12.59% | SF+ | 7.00% | | 11/19/2026 | | 9,050 | | 8,892 | | 8,684 | | 1.4 | % |
| | | Secured Debt | (9) | 1/16/2024 | | 14.59% | SF+ | 9.00% | | 11/19/2026 | | 9,050 | | 8,892 | | 8,684 | | 1.4 | % |
| | | | | | | | | | | | | | 20,867 | | 20,416 | | 3.3 | % |
World Micro Holdings, LLC 205 Hembree Park Drive, Suite 106 Roswell, GA 30076 | | Supply Chain Management | | | | | | | | | | | | | | |
| | | Secured Debt | | 12/12/2022 | | 13.00% | | | | 12/12/2027 | | 1,606 | | 1,586 | | 1,586 | | 0.3 | % |
| | | Preferred Equity | (8) | 12/12/2022 | 530 | | | | | | 12.1 | % | | 530 | | 530 | | 0.1 | % |
| | | | | | | | | | | | | | 2,116 | | 2,116 | | 0.3 | % |
Xenon Arc, Inc. 10500 NE 8th Street Suite 1250 Bellevue, WA 98004 | (10) | Tech-enabled Distribution Services to Chemicals and Food Ingredients Primary Producers | | | | | | | | | | | | | | |
| | | Secured Debt | (9) | 12/17/2021 | | 10.16% | SF+ | 5.25% | | 12/20/2028 | | 1,179 | | 1,159 | | 1,179 | | 0.2 | % |
| | | Secured Debt | (9) | 12/17/2021 | | 10.63% | SF+ | 5.25% | | 12/20/2028 | | 2,334 | | 2,309 | | 2,334 | | 0.4 | % |
| | | | | | | | | | | | | | 3,468 | | 3,513 | | 0.6 | % |
YS Garments, LLC 15730 S Figueroa Street Gardena, CA 90248 | (11) | Designer and Provider of Branded Activewear | | | | | | | | | | | | | | |
| | | Secured Debt | (9) | 8/22/2018 | | 12.89% | SF+ | 7.50% | | 8/9/2026 | | 5,153 | | 5,087 | | 4,699 | | 0.8 | % |
| | | | | | | | | | | | | | | | |
Zips Car Wash, LLC 1400 W Markham Street, Suite 100 Little Rock, AR 72201 | (10) | Express Car Wash Operator | | | | | | | | | | | | | | |
| | | Secured Debt | (9) (26) | 2/11/2022 | | 12.46% | SF+ | 7.25% | 1.50% | 12/31/2024 | | 2,360 | | 2,360 | | 2,219 | | 0.4 | % |
| | | Secured Debt | (9) (26) | 2/11/2022 | | 12.46% | SF+ | 7.25% | 1.50% | 12/31/2024 | | 591 | | 591 | | 555 | | 0.1 | % |
| | | | | | | | | | | | | | 2,951 | | 2,774 | | 0.4 | % |
ZRG Partners, LLC 365 W Passaic Street Rochelle Park, NJ 07662 | (10) | Talent Advisory Services Provider | | | | | | | | | | | | | | |
| | | Secured Debt | (9) (30) | 6/14/2024 | | | SF+ | 6.00% | | 6/14/2029 | | — | | (29) | | (29) | | 0.0 | % |
| | | Secured Debt | (9) | 6/14/2024 | | | SF+ | 6.00% | | 6/14/2029 | | 630 | | 598 | | 613 | | 0.1 | % |
| | | Secured Debt | (9) | 6/14/2024 | | 11.26% | SF+ | 6.00% | | 6/14/2029 | | 995 | | 977 | | 969 | | 0.2 | % |
| | | Secured Debt | (9) | 6/14/2024 | | 11.30% | SF+ | 6.00% | | 6/14/2029 | | 7,133 | | 7,000 | | 6,944 | | 1.1 | % |
| | | | | | | | | | | | | | 8,546 | | 8,497 | | 1.4 | % |
Subtotal Non-Control/Non-Affiliate Investments (127.8% of net assets at fair value) | | | | | | | | | | | | | | $ | 836,194 | | $ | 790,604 | | 127.8 | % |
Total Portfolio Investments, September 30, 2024 (188.0% of net assets at fair value) | | | | | | | | | | | | | | $ | 1,132,577 | | $ | 1,162,627 | | 188.0 | % |
| | | | | | | | | | | | | | | | |
| Money market funds (included in cash and cash equivalents) | | | | | | | | | | | | | | | | |
| First American Treasury Obligations Fund Class Z | (16) | | | | | | | | | | | | | $ | 10,798 | | $ | 10,798 | | 1.7 | % |
| Fidelity Government Portfolio Fund Class III | (34) | | | | | | | | | | | | | 20,397 | | 20,397 | | 3.3 | % |
| | | | | | | | | | | | | | | | | | | | | | | | | | | | | | | | | | | | | | | | | | | | | | | | | | |
| Portfolio Company (1) (20) | | Business Description | Type of Investment (2) (3) (15) | | Investment Date (22) | Shares/Units | Total Rate | Reference Rate and Spread (25) | PIK Rate (19) | Maturity Date | Percentage of Class Held (35) | Principal (4) | Cost (4) | Fair Value (18) | Percentage of Net Assets |
| Total money market funds | | | | | | | | | | | | | | $ | 31,195 | | $ | 31,195 | | 5.0 | % |
_____________________________
(1)All investments are Lower Middle Market portfolio investments, unless otherwise noted. All of the Company’s investments, unless otherwise noted, are encumbered as security for one of the Company’s Credit Facilities.
(2)Debt investments are income producing, unless otherwise noted by footnote (14), as described below. Equity and warrants are non-income producing, unless otherwise noted by footnote (8), as described below.
(3)Intentionally omitted.
(4)Principal is net of repayments. Cost is net of repayments and accumulated unearned income. Negative cost is the result of the capitalized discount being greater than the principal amount outstanding on the loan.
(5)Control investments are defined by the 1940 Act as investments in which more than 25% of the voting securities are owned or where the ability to nominate greater than 50% of the board representation is maintained.
(6)Affiliate investments are defined by the 1940 Act as investments in which between 5% and 25% (inclusive) of the voting securities are owned and the investments are not classified as Control investments.
(7)Non-Control/Non-Affiliate investments are defined by the 1940 Act as investments that are neither Control investments nor Affiliate investments.
(8)Income producing through dividends or distributions.
(9)Index based floating interest rate is subject to contractual minimum interest rate. As noted in this schedule, 96% of the loans (based on the par amount) contain Term SOFR (“SOFR”) floors which range between 0.75% and 5.25%, with a weighted-average floor of 1.25%.
(10)Private Loan portfolio investment.
(11)Middle Market portfolio investment.
(12)Other Portfolio investment.
(13)Investment is not a qualifying asset as defined under Section 55(a) of the 1940 Act. Qualifying assets must represent at least 70% of total assets at the time of acquisition of any additional non-qualifying assets.
(14)Non-accrual and non-income producing debt investment.
(15)All of the Company’s portfolio investments are generally subject to restrictions on resale as “restricted securities.”
(16)Effective yield as of September 30, 2024 was approximately 4.97% on the First American Treasury Obligations Fund Class Z.
(17)Maturity date is under on-going negotiations with the portfolio company and other lenders, if applicable.
(18)Investment fair value was determined using significant unobservable inputs, unless otherwise noted. Negative fair value is the result of the capitalized discount on the loan or the unfunded commitment being valued below par.
(19)Investments may have a portion, or all, of their income received from Paid-in-Kind (“PIK”) interest or dividends. PIK interest income and cumulative dividend income represent income not paid currently in cash. The difference between the Total Rate and PIK Rate represents the cash rate as of September 30, 2024.
(20)All portfolio company headquarters are based in the United States, unless otherwise noted.
(21)Portfolio company headquarters are located outside of the United States.
(22)Investment date represents the date of initial investment in the security position.
(23)Shares/Units represent ownership in a related Real Estate or HoldCo entity.
(24)Investment is not unitized. Presentation is made in percent of fully diluted ownership unless otherwise indicated.
(25)A majority of the variable rate loans in the Company’s Investment Portfolio (defined below) bear interest at a rate that may be determined by reference to either SOFR (“SF”) or an alternate base rate (commonly based on the Federal Funds Rate or the Prime rate (“P”)), which typically resets every one, three, or six months at the borrower’s option. SOFR based contracts may include a credit spread adjustment (the “Adjustment”) that is charged in addition to the stated spread. The Adjustment is applied when the SOFR rate, plus the Adjustment, exceeds the stated floor rate, as applicable. As of September 30, 2024, SOFR based contracts in the portfolio had Adjustments ranging from 0.10% to 0.43%.
(26)Each new draw or funding on the facility has a different floating rate reset date. The rate presented represents a weighted-average rate for borrowings under the facility, as of September 30, 2024.
(27)Warrants are presented in equivalent shares/units with a strike price of $0.01 per share/unit.
(28)RLOC facility permits the borrower to make an interest rate election regarding the base rate on each draw under the facility. The rate presented represents a weighted-average rate for borrowings under the facility, as of September 30, 2024.
(29)Index based floating interest rate is subject to contractual maximum base rate of 3.00%.
(30)The position is unfunded and no interest income is being earned as of September 30, 2024. The position may earn a nominal unused facility fee on committed amounts.
(31)Warrants are presented in equivalent shares/units with a strike price of $1.00 per share/unit.
(32)RLOC facility permits the borrower to make an interest rate election regarding the base rate on each draw under the facility. As of September 30, 2024, the facility had contracts running under the terms SF+7.00% (Floor 1.00%) and P+6.00% (Floor 2.00%). The rate presented represents a weighted-average rate for borrowings under the facility, as of September 30, 2024.
(33)The Company has entered into an intercreditor agreement that entitles the Company to the “last out” tranche of the first lien secured loans, whereby the “first out” tranche will receive priority as to the “last out” tranche with respect to payments of principal, interest, and any other amounts due thereunder. Therefore, the Company receives a higher interest rate than the contractual stated interest rate of 11.75% per the credit agreement and the Consolidated Schedule of Investments above reflects such higher rate.
(34)Effective yield as of September 30, 2024 was approximately 4.58% on the Fidelity Government Portfolio Fund Class III.
(35)Percent of class held is presented for equity investments only. Unless otherwise noted, for any warrants, convertible or preferred equity instruments, the percent of class represents the percent of its equity class in the portfolio company.
SENIOR SECURITIES
Information about our senior securities is shown in the following table as of the end of the fiscal quarter ended September 30, 2024 (unaudited) and the end of each of the fiscal years ended December 31, 2023, 2022, 2021, 2020, 2019, 2018, 2017, 2016, 2015 and 2014. The report of Grant Thornton LLP, our independent registered public accounting firm, on the senior securities table as of December 31, 2023, December 31, 2022, December 31, 2021, December 31, 2020, and December 31, 2019 is attached as an exhibit to the registration statement of which this prospectus is a part.
| | | | | | | | | | | | | | | | | | | | | | | | | | |
| | Total Amount Outstanding Exclusive of Treasury Securities(1) | | Asset Coverage per Unit(2) | | Involuntary Liquidating Preference per Unit(3) | | Average Market Value per Unit(4) |
| | (dollars in thousands) | | | | | | |
| Corporate Facility | | | | | | | | |
| 2014 | | $ | 87,900 | | | $ | 2,422 | | | — | | | N/A |
| 2015 | | 105,000 | | | 2,294 | | | — | | | N/A |
| 2016 | | 80,000 | | | 2,448 | | | — | | | N/A |
| 2017 | | 82,000 | | | 2,506 | | | — | | | N/A |
| 2018 | | 120,000 | | | 2,229 | | | — | | | N/A |
| 2019 | | 105,000 | | | 2,369 | | | — | | | N/A |
| 2020 | | 44,000 | | | 2,920 | | | — | | | N/A |
| 2021 | | 153,000 | | | 2,214 | | | — | | | N/A |
| 2022 | | 98,000 | | | 2,290 | | | — | | | N/A |
| 2023 | | 132,000 | | | 2,280 | | | — | | | N/A |
| September 30, 2024 (unaudited) | | 147,000 | | | 2,110 | | | — | | | N/A |
| SPV Facility | | | | | | | | |
| 2021 | | $ | 273,688 | | | $ | 2,214 | | | — | | | N/A |
| 2022 | | 223,688 | | | 2,290 | | | — | | | N/A |
| 2023 | | 203,688 | | | 2,280 | | | — | | | N/A |
| September 30, 2024 (unaudited) | | 259,688 | | | 2,110 | | | — | | | N/A |
| Series A Notes | | | | | | | | |
| 2021 | | $ | 77,500 | | | $ | 2,214 | | | — | | | N/A |
| 2022 | | 150,000 | | | 2,290 | | | — | | | N/A |
| 2023 | | 150,000 | | | 2,280 | | | — | | | N/A |
| September 30, 2024 (unaudited) | | 150,000 | | | 2,110 | | | — | | | N/A |
| Deutsche Bank Credit Facility | | | | | | | | |
| 2014 | | $ | 94,964 | | | $ | 2,422 | | | — | | | N/A |
| 2015 | | 275,000 | | | 2,294 | | | — | | | N/A |
| 2016 | | 333,000 | | | 2,448 | | | — | | | N/A |
| 2017 | | 348,000 | | | 2,506 | | | — | | | N/A |
| 2018 | | 389,000 | | | 2,229 | | | — | | | N/A |
| 2019 | | 340,000 | | | 2,369 | | | — | | | N/A |
| 2020 | | 257,816 | | | 2,920 | | | — | | | N/A |
_____________________________
(1)Total amount of each class of senior securities outstanding at the end of the period presented.
(2)Asset coverage per unit is the ratio of the carrying value of MSC Income Fund’s total consolidated assets, less all liabilities and indebtedness not represented by senior securities, to the aggregate amount of senior securities representing indebtedness. Asset coverage per unit is expressed in terms of dollar amounts per $1,000 of indebtedness.
(3)The amount to which such class of senior security would be entitled upon the involuntary liquidation of the issuer in preference to any security junior to it. The “—” indicates information that the SEC expressly does not require to be disclosed for certain types of senior securities.
(4)Not applicable because the senior securities are not registered for public trading on a stock exchange.
BUSINESS
Unless otherwise noted or the context otherwise indicates, the term “MSIF” refers to MSC Income Fund, Inc., and the terms “we,” “us,” “our,” the “Company” and “MSC Income Fund” refer to MSIF and its consolidated subsidiaries, including the Taxable Subsidiaries and the Structured Subsidiaries.
MSC Income Fund
We are a principal investment firm primarily focused on providing debt capital to private companies which are owned by or in the process of being acquired by a private equity fund through our Private Loan investment strategy and secondarily focused on providing customized long-term debt and equity capital solutions to LMM companies through our LMM investment strategy. A portion of our Private Loan investments may include equity investments in our Private Loan companies. Our portfolio investments are typically made to support leveraged buyouts, recapitalizations, growth financings, refinancings and acquisitions of companies that operate in diverse industry sectors. We seek to partner with private equity fund sponsors in our Private Loan investment strategy and primarily invest in secured debt investments of Private Loan companies generally headquartered in the United States. We maintain relationships with a diverse group of private equity fund sponsors, with no aggregate Private Loan portfolio investments with a single sponsor exceeding 13% of our total Private Loan portfolio investments at fair value as of September 30, 2024. We also seek to partner with entrepreneurs, business owners and management teams and generally provide “one-stop” debt and equity financing solutions within our LMM investment strategy. Through our LMM investment strategy, we primarily invest in secured debt investments, equity investments, warrants and other securities of LMM companies typically based in the United States.
We also maintain our legacy Middle Market investment portfolio and Other Portfolio investments. Our Middle Market investments are generally debt investments in companies owned by a private equity fund that were originally issued through a syndication financing process. We have generally stopped making new Middle Market investments and expect our Middle Market investment portfolio to continue to decline in future periods as our existing Middle Market investments are repaid or sold. Our Other Portfolio investments primarily consist of investments that are not consistent with the typical profiles for our Private Loan, LMM or Middle Market portfolio investments, including investments in non-affiliated investment companies and private funds managed by third parties.
We were formed on November 28, 2011 as a Maryland corporation to operate as an externally managed BDC under the 1940 Act. MSIF has elected to be treated for U.S. federal income tax purposes as a RIC under Subchapter M of the Code. As a result, MSIF generally does not pay corporate-level U.S. federal income taxes on any net ordinary taxable income or capital gains that it distributes to its stockholders.
On October 28, 2020, MSIF’s stockholders approved the appointment of our Adviser, which is wholly-owned by Main Street, a New York Stock Exchange listed BDC, as MSIF’s investment adviser and administrator under the Current Investment Advisory Agreement. In such role, the Adviser has the responsibility to manage our business, including the responsibility to identify, evaluate, negotiate and structure prospective investments, make investment and portfolio management decisions, monitor our Investment Portfolio and provide ongoing administrative services. In connection with this offering, we intend to enter into the New Investment Advisory Agreement with our Adviser, which was approved by our board of directors, including a majority of members who are not “interested” persons (as defined by the 1940 Act) of the Company or the Adviser, on July 17, 2024 (and subsequently ratified at an in-person meeting on August 13, 2024). The New Investment Advisory Agreement was approved by the affirmative vote of the holders of a majority of our outstanding voting securities, as defined in the 1940 Act, at a special meeting of stockholders held on December 11, 2024, and will be effective for an initial two-year term upon a Listing.
MSIF has certain direct and indirect wholly-owned Taxable Subsidiaries. The primary purpose of the Taxable Subsidiaries is to permit MSIF to hold equity investments in portfolio companies which are “pass-through” entities for tax purposes. MSIF also has certain direct and indirect wholly-owned Structured Subsidiaries formed for financing purposes.
Corporate Structure
The following diagram depicts our organizational structure upon the closing of this offering:
_____________________________
(1)Assumes (1) that Main Street purchases 289,761 shares in this offering (see “The Offering – Main Street Indication of Interest”), (2) that no shares of our common stock are sold through the directed share program described elsewhere in this prospectus and (3) that the underwriters do not exercise their option to purchase additional shares of common stock.
(2)Includes Main Street, certain officers and employees of Main Street and certain directors and officers of the Company.
(3)From time to time, we may form subsidiaries to facilitate our normal course of business investing activities. A “subsidiary” is an entity that primarily engages in investment activities in securities or other assets that is wholly- owned by us, including existing Taxable Subsidiaries and Structured Subsidiaries. We comply with the 1940 Act provisions governing capital structure and leverage on an aggregate basis with such wholly-owned subsidiaries, and each such subsidiary complies with the 1940 Act provisions relating to affiliated transactions and custody and is subject to the same principal investment strategies and principal risks of the Company. Any investment adviser to such wholly-owned subsidiary will comply with the provisions of the 1940 Act relating to investment advisory contract approval as if it were an investment adviser to an investment company under the 1940 Act. We do not intend to create or acquire primary control of any subsidiary that primarily engages in investment activities in securities or other assets other than entities wholly-owned by us. Each of the Taxable Subsidiaries and the Structured Subsidiaries uses the same custodians as the Company.
(4)Excludes Main Street, officers and employees of Main Street and directors and officers of the Company.
Corporate Information
Our principal executive offices are located at 1300 Post Oak Boulevard, 8th Floor, Houston, Texas 77056. We maintain a website on the Internet at www.mscincomefund.com. We make available free of charge on our website our annual reports on Form 10-K, quarterly reports on Form 10-Q, current reports on Form 8-K and all amendments to those reports as soon as reasonably practicable after such material is electronically filed with or furnished to the SEC. Information contained on our website is not incorporated by reference into this prospectus, and you should not consider that information to be part of this prospectus. Our annual reports on Form 10-K, quarterly reports on Form 10-Q, current reports on Form 8-K, and all amendments to those reports and other public filings are also available free of charge on the EDGAR Database on the SEC’s website at www.sec.gov.
Overview of Our Business
Our principal investment objective is to maximize our Investment Portfolio’s total return, primarily by generating current income from our debt investments and, to a lesser extent, by generating current income and capital appreciation from our equity and equity-related investments, including warrants, convertible securities and other rights to acquire equity securities in a portfolio company. We seek to achieve our investment objective through our Private Loan and LMM investment strategies. A portion of our Private Loan investments may include equity investments in our Private Loan companies. Our Private Loan investment strategy involves investments in companies that generally have annual revenues between $25 million and $500 million and annual EBITDA between $7.5 million and $50 million. Our LMM investment strategy involves investments in companies that generally have annual revenues between $10 million and $150 million and annual EBITDA between $3 million and $20 million. Our Private Loan and LMM investments generally range in size from $1 million to $20 million. Geographically, we maintain a diversified portfolio throughout the United States. As of September 30, 2024, our invested capital by transaction types as a percentage of our total investment portfolio at cost (excluding Other Portfolio investments, which in aggregate represented approximately 1.7% of our total investment portfolio at cost) varied from recapitalization/refinancing (40%), leveraged buyouts/management buyouts (35%), acquisitions (22%), and growth capital (3%).
Private Loan investments primarily consist of debt securities that have primarily been originated directly by our Adviser or, to a lesser extent, through our Adviser’s strategic relationships with other investment funds on a collaborative basis through investments that are often referred to in the debt markets as “club deals” because of the small lender group size. Our Private Loan investments are typically made in a company owned by or in the process of being acquired by a private equity fund. Our Private Loan portfolio debt investments are generally secured by a first priority lien on the assets of the portfolio company and typically have a term of between three and seven years from the original investment date. We may also co-invest with Main Street and the private equity funds in the equity securities of our Private Loan portfolio companies.
We seek to avoid Private Loan investments in businesses with the following characteristics: distressed situations, highly cyclical or seasonal revenues, low operating margins, high capital intensity, high customer concentration, and inexperienced management teams. Our target loan profiles for Private Loan investments typically include a total leverage level below 4.5x EBITDA, a debt-to-enterprise value below 60%, and companies with demonstrated historical cash flow generation. As of September 30, 2024 and based upon cost, our Private Loan investment portfolio generation consisted of 47.1% lead investments, which are investments where our Adviser was the lender leading the lenders’ activities on the Private Loan investment (which include, but are not limited to, sourcing the opportunity, due diligence procedures, negotiations, supervision of legal documentation and post-investment monitoring, with these activities together, the “Lender Activities”), 25.0% co-lead investments, which are investments where our Adviser was a co-lead with another lender for the Lender Activities, and 27.9% club investments, which are investments where our Adviser was not leading or co-leading the Lender Activities (excluding Private Loan investments closed by LMM investment teams, which in aggregate represent approximately 3.3% and 3.5% of our total Private Loan investment portfolio at cost and fair value, respectively, as of September 30, 2024). The portfolio company ownership within our Private Loan portfolio, based upon cost as of September 30, 2024, consisted of 97% owned by a private equity fund and 3% owned by a non-private equity fund party (excluding Private Loan investments closed by LMM investment teams). Since January 1, 2021 through September 30, 2024, our Adviser’s Private Credit investment team reviewed approximately 1,045 Private Loan investment opportunities and closed 74 investments; we participated in 73 of such investments.
We also seek to fill the financing gap for LMM businesses, which, historically, have had limited access to financing from commercial banks and other traditional sources. The underserved nature of the LMM creates the opportunity for us to meet the financing needs of LMM companies while also negotiating favorable transaction terms and equity participation. Our ability to invest across a company’s capital structure, from secured loans to equity securities, allows us to offer portfolio companies a comprehensive suite of financing options, or a “one-stop” financing solution. We believe that providing customized, “one-stop” financing solutions is important and valuable to LMM portfolio companies. We generally seek to partner directly with entrepreneurs, management teams and business owners in making our LMM investments. Our LMM portfolio debt investments are generally secured by a first lien on the assets of the portfolio company and typically have a term of between five and seven years from the original investment date. Our target purchase price multiple for LMM investments is between 4.5x – 6.5x enterprise value-to-EBITDA. As of September 30, 2024, our invested capital by transaction types in our LMM portfolio, as a percentage of our LMM investment portfolio at cost, varied from recapitalization/refinancing (53.6%), leveraged buyouts/management buyouts (34.9%), acquisitions (7.1%), and growth capital (4.4%).
In contemplation of this public offering, our board of directors and the Adviser decided to shift our future investment strategy with respect to new platform investments to be solely focused on our Private Loan investment strategy. As a result, the size of our LMM investment strategy portfolio is expected to decrease over time as we make new investments consistent with our Private Loan investment strategy and our existing LMM investment strategy investments are repaid or sold in the ordinary course of business. We do, however, plan to continue executing follow on investments in our existing LMM portfolio companies going forward in accordance with our existing SEC order for co-investment exemptive relief.
We also maintain our legacy Middle Market investment portfolio. Our Middle Market investments are generally debt investments in companies owned by private equity funds that were originally issued through a syndication financing process. We have generally stopped making new Middle Market investments and expect our Middle Market investment portfolio to continue to decline in future periods as existing Middle Market investments are repaid or sold. Our Middle Market debt investments generally range in size from $1 million to $20 million, are generally secured by a first priority lien on the assets of the portfolio company and typically have an expected duration of between three and seven years from the original investment date.
Our Other Portfolio investments primarily consist of investments that are not consistent with the typical profiles for our Private Loan, LMM or Middle Market portfolio investments, including investments in non-affiliated investment companies and private funds managed by third parties. In our Other Portfolio, we may incur indirect fees and expenses to third party managers. Similar to our Middle Market investments, we have generally stopped making new Other Portfolio investments and expect our Other Portfolio to continue to decline in future periods as existing Other Portfolio investments are repaid or sold.
Our portfolio investments are generally made through MSIF, the Taxable Subsidiaries and the Structured Subsidiaries. MSIF, the Taxable Subsidiaries and the Structured Subsidiaries share the same investment strategies and criteria. An investor’s return in MSIF will depend, in part, on the Taxable Subsidiaries’ and the Structured Subsidiaries’ investment returns as they are wholly-owned subsidiaries of MSIF.
The level of new portfolio investment activity will fluctuate from period to period based upon our view of the current economic fundamentals, our ability to identify new investment opportunities that meet our investment criteria, and our ability to consummate the identified opportunities and our available liquidity. The level of new investment activity, and associated interest and fee income, will directly impact future investment income. In addition, the level of dividends paid by portfolio companies and the portion of our portfolio debt investments on non-accrual status will directly impact future investment income. While we intend to grow our portfolio and our investment income over the long term, our growth and our operating results may be more limited during depressed economic periods. However, we intend to appropriately manage our cost structure and liquidity position based on applicable economic conditions and our investment outlook. The level of realized gains or losses and unrealized appreciation or depreciation on our investments will also fluctuate depending upon portfolio activity, economic conditions and the performance of our individual portfolio companies. The changes in realized gains and losses and unrealized appreciation or depreciation could have a material impact on our operating results.
We have received an exemptive order from the SEC permitting co-investments among us, Main Street and other funds and clients advised by our Adviser in certain negotiated transactions where co-investing would otherwise be prohibited under the 1940 Act. We have made co-investments with, and in the future intend to continue to make co-investments with Main Street and other funds and clients advised by our Adviser, in accordance with the conditions of the order. The order requires, among other things, that we and our Adviser consider whether each such investment opportunity is appropriate for us, Main Street and the other funds and clients advised by our Adviser, as applicable, and if it is appropriate, to propose an allocation of the investment opportunity between such parties. Because our Adviser is wholly-owned by Main Street and is not managing our investment activities as its sole activity, this may provide our Adviser an incentive to allocate opportunities to Main Street, other participating funds and other clients instead of us. However, both we and our Adviser have policies and procedures in place to manage this conflict, including oversight by the independent members of our board of directors. In addition to the co-investment program described above, we also co-invest in syndicated deals and other transactions where price is the only negotiated point by us and our affiliates.
Market Opportunity
We believe that the investing environment in the markets served by our Private Loan and LMM investment strategies continues to be attractive, providing strong risk-adjusted returns due to structural and market factors. We believe that when private equity sponsors experience the flexibility of private credit financing solutions and the speed and certainty of execution, they will continue to consider financing from non-bank lenders. Additionally, we believe that our target market in our Private Loan investment strategy (companies with $7.5 million to $50 million of EBITDA) continues to be underserved. This has allowed us to establish ourselves as a “go-to” player in the space. These factors present a compelling opportunity for us to invest in quality companies on attractive terms and conditions. Certain private equity sponsors who historically sought to finance their transactions in the public, syndicated markets or with commercial banks have turned to private credit providers, including us, to finance their transactions.
The following chart illustrates levels of committed but uncalled capital that private equity funds have on hand, or “dry powder,” which supports a continued demand outlook for private credit providers.
_____________________________
(1)Data from Preqin as of November 2024.
We believe that commercial bank loans and broadly syndicated loans have decreased materially over the past decades as a percentage of total middle market private debt issuance. Additionally, private equity sponsors value the flexibility and efficiency of private credit financing solutions. Continued growth in private equity dry powder has created more opportunities to source and execute Private Loan investment opportunities.
Competitive Advantage
Ability to leverage the Main Street platform
We believe that our Adviser’s expertise in analyzing, valuing, structuring, negotiating and closing transactions provides us with a competitive advantage in offering customized financing solutions to companies. Main Street has a substantial network of business relationships with individuals, companies, and institutions in the United States, which we believe is a consistent source of investment opportunities for us and differentiates us relative to other BDCs. Additionally, we believe that this network assists our portfolio companies through our ability to make introductions and referrals to Main Street’s key third-party relationships.
Diversified investment strategy differentiates MSC Income Fund from other investment funds
We have a U.S.-focused Private Loan investment strategy investing primarily in senior secured, first lien loans of companies owned by or being acquired by private equity funds. We also have a LMM investment strategy focused on investing in partnership with business owners and management teams of companies in the underserved LMM. Our core focus is sourcing investment opportunities in companies with significantly lower EBITDA versus many BDC peers, as we believe these companies are underserved from a financing standpoint. We believe the underserved nature of the market we serve results in an enhanced risk profile: including smaller lending groups, more control over underwriting, structure, and documentation, and better communication and more direct interaction with the portfolio company, its management team and its private equity sponsor. Lastly, we believe the lower leverage ratios of our portfolio companies at the time of our initial debt investment allow for greater downside protection, and the lower equity investment valuations at the time of our initial equity investments allow opportunities for higher levels of future capital appreciation. As a result of our unique investment strategies, we also have minimal portfolio company overlap versus most BDC peers, many of which have significant overlap and commonality within their investment portfolios and therefore represent common risk profiles, which we believe allows us to provide a unique investment opportunity for our investors, including the benefits of differentiation and diversification away from most BDC peers.
Experienced investment team with a strong track record
Our Adviser is served by experienced investment professionals within Main Street’s platform. Our Adviser’s investment professionals are responsible for the origination, due diligence, underwriting, structuring and monitoring of each investment throughout its life cycle. In addition, the Main Street platform includes numerous professionals focused on its legal, compliance, risk management, finance, accounting and tax functions who help support our Adviser’s investment professionals by providing guidance on our operations. As of September 30, 2024, our Adviser had 104 professionals, including 58 dedicated investment professionals, with the senior investment professionals averaging 22 years of experience and with an average of 11 years of experience at Main Street.
Stockholder alignment
As of September 30, 2024, our directors and executive officers own 0.2% of our outstanding shares of common stock, while Main Street owns 2.7% of our outstanding shares. These ownership stakes are important factors that align interests between our Adviser, management and stockholders.
Stockholder friendly cost structure
Effective upon a Listing, we and the Adviser intend to amend the Current Investment Advisory Agreement to better align with our transition to focus on our Private Loan investment strategy. The changes to the Current Investment Advisory Agreement include (i) a reduction in the annual base management fees payable by us to our Adviser (with additional future contractual reductions based upon our investment portfolio composition), (ii) amendments to the structure of the subordinated incentive fee on income payable by us to our Adviser and reductions in the hurdle, catch-up percentage and incentive fee rates, including the adoption of a differentiated and stockholder friendly 50% / 50% catch-up feature, (iii) a reduction to and reset of the incentive fee on capital gains payable by us to our Adviser, (iv) establishment of a cap on the amount of expenses payable by us relating to certain internal administrative services, which varies based on the value of our total assets and (v) other changes to delete provisions required by NASAA Guidelines. We believe that our revised fee structure is among industry leaders and provides strong alignment with stockholders.
BUSINESS STRATEGIES
Our investment objective is to maximize our portfolio’s total return by generating current income and capital appreciation from our portfolio investments. We have adopted the following business strategies to achieve our investment objective:
•Focus on Established Companies. We generally invest in companies with established market positions, experienced management teams and proven revenue streams. Through our Private Loan investment strategy, we access proprietary investments with attractive risk-adjusted return characteristics to generate a cash yield to support our quarterly dividend. We believe that those companies generally possess better risk-adjusted return profiles than newer companies that are building their management teams or are in the early stages of building a revenue base. We also believe that established companies in our targeted size range also generally provide opportunities for capital appreciation.
•Deliver Customized Financing Solutions in the Lower Middle Market. We offer LMM portfolio companies customized debt and equity financing solutions that are tailored to the facts and circumstances of each situation. We believe our ability to provide a broad range of customized financing solutions to LMM companies sets us apart from other capital providers that focus on providing a limited number of financing solutions. Our ability to invest across a company’s capital structure, from senior secured loans to subordinated debt to equity securities, allows us to offer LMM portfolio companies a comprehensive suite of financing options, or a “one-stop” financing solution.
•Leverage the Skills and Experience of our Adviser’s Investment Team. Our Adviser’s investment team has significant experience in lending to and investing in Private Loan, LMM and Middle Market companies. The members of our Adviser’s investment team have broad investment backgrounds, with significant experience and long-term tenure with our Adviser and prior experience at private investment funds, corporate entities with active acquisition growth strategies and activities, investment banks and other financial services companies. The expertise of our Adviser’s investment team in analyzing, valuing, structuring, negotiating and closing transactions should provide us with competitive advantages by allowing us to consider customized financing solutions and non-traditional or complex structures for our portfolio companies.
•Invest Across Multiple Companies, Industries, Regions and End Markets. We seek to maintain a portfolio of investments that is appropriately balanced among various companies, industries, geographic regions and end markets. This portfolio balance is intended to mitigate the potential effects of negative economic events for particular companies, regions, industries and end markets.
•Capitalize on Strong Transaction Sourcing Network. Our Adviser’s investment team seeks to leverage its extensive network of referral sources for portfolio company investments. Main Street has developed a reputation in our marketplace as a responsive, efficient and reliable source of financing, which has created a growing stream of proprietary deal flow for us.
•Benefit from Lower, Fixed, Long-Term Cost of Capital. We maintain an investment grade rating from Kroll Bond Rating Agency, LLC which provides us the opportunity and flexibility to obtain additional, attractive long-term financing options to supplement our capital structure, including the unsecured notes with fixed interest rates we issue.
INVESTMENT CRITERIA
Our Adviser’s investment team has identified the following investment criteria that it believes are important in evaluating prospective portfolio companies. Our Adviser’s investment team uses these criteria in evaluating investment opportunities. However, not all of these criteria have been, or will be, met in connection with each of our investments:
•Established Companies with Positive Cash Flow. We seek to invest in established companies with sound historical financial performance. We primarily pursue investments in Private Loan companies that have historically generated annual EBITDA of $7.5 million to $50 million. We also seek to invest in LMM companies that have historically generated annual EBITDA of $3 million to $20 million. We generally do not invest in start-up companies or companies with speculative business plans.
•Defensible Competitive Advantages/Favorable Industry Position. We primarily focus on companies having competitive advantages in their respective markets and/or operating in industries with barriers to entry, which may help to protect their market position and profitability.
•Proven Management Team with Meaningful Equity Stake. We look for operationally-oriented management with direct industry experience and a successful track record. We believe management teams with these attributes are more likely to manage the companies in a manner that protects our investment.
•Exit Alternatives. We exit our debt investments primarily through the repayment of our investment from internally generated cash flow of the portfolio company and/or a refinancing. In addition, we seek to invest in companies whose business models and expected future cash flows may provide alternate methods of repaying our investment, such as through a strategic acquisition by other industry participants or a recapitalization.
INVESTMENT PORTFOLIO
The following tables provide a summary of our investments in the Private Loan, LMM and Middle Market portfolios as of September 30, 2024 and December 31, 2023 (excluding certain investments in Other Portfolio investments).
| | | | | | | | | | | | | | | | | |
| As of September 30, 2024 |
| Private Loan | | LMM (a) | | Middle Market |
| (dollars in millions) |
| Number of portfolio companies | 84 | | 55 | | 11 |
| Fair value | $ | 679.9 | | | $ | 411.0 | | | $ | 46.1 | |
| Cost | $ | 700.0 | | | $ | 340.5 | | | $ | 73.0 | |
| Debt investments as a % of portfolio (at cost) | 95.6 | % | | 70.8 | % | | 88.9 | % |
| Equity investments as a % of portfolio (at cost) | 4.4 | % | | 29.2 | % | | 11.1 | % |
| % of debt investments at cost secured by first priority lien | 99.9 | % | | 99.9 | % | | 99.9 | % |
| Weighted-average annual effective yield (b) | 12.7 | % | | 13.2 | % | | 14.1 | % |
| Average EBITDA (c) | $ | 33.2 | | | $ | 10.0 | | | $ | 44.3 | |
_____________________________
(a)As of September 30, 2024, we had equity ownership in all of our LMM portfolio companies, and the average fully diluted equity ownership in those portfolio companies was 9%.
(b)The weighted-average annual effective yields were computed using the effective interest rates for all debt investments as of September 30, 2024, including amortization of deferred debt origination fees and accretion of original issue discount but excluding fees payable upon repayment of the debt instruments and any debt investments on non-accrual status, and are weighted based upon the principal amount of each applicable debt investment as of September 30, 2024. The weighted-average annual effective yield on our debt portfolio as of September 30, 2024 including debt investments on non-accrual status was 12.1% for our Private Loan portfolio, 11.8% for our LMM portfolio and 9.4% for our Middle Market portfolio. The weighted-average annual effective yield on our entire investment portfolio as of September 30, 2024, including debt investments on non-accrual status, was 11.9%. The weighted-average annual effective yield is not reflective of what an investor in shares of our common stock will realize on its investment because it does not reflect our utilization of debt capital in our capital structure, our expenses or any sales load paid by an investor. The total return based on change in the Company’s net asset value was 6.4% (not annualized) for the nine months ended September 30, 2024. See “Financial Highlights” above.
(c)The average EBITDA is calculated using a weighted-average for the Private Loan and Middle Market portfolios and a simple average for the LMM portfolio. These calculations exclude certain portfolio companies, including two Private Loan portfolio companies, two LMM portfolio companies and one Middle Market portfolio company, as EBITDA is not a meaningful valuation metric for our investments in these portfolio companies, and those portfolio companies whose primary purpose is to own real estate and those portfolio companies whose primary operations have ceased and only residual value remains.
| | | | | | | | | | | | | | | | | |
| As of December 31, 2023 |
| Private Loan | | LMM (a) | | Middle Market |
| (dollars in millions) |
| Number of portfolio companies | 78 | | 50 | | 16 |
| Fair value | $ | 595.3 | | | $ | 387.0 | | | $ | 86.0 | |
| Cost | $ | 586.4 | | | $ | 315.7 | | | $ | 114.7 | |
| Debt investments as a % of portfolio (at cost) | 94.1 | % | | 70.2 | % | | 93.1 | % |
| Equity investments as a % of portfolio (at cost) | 5.9 | % | | 29.8 | % | | 6.9 | % |
| % of debt investments at cost secured by first priority lien | 100.0 | % | | 99.9 | % | | 100.0 | % |
| Weighted-average annual effective yield (b) | 13.1 | % | | 13.0 | % | | 13.0 | % |
| Average EBITDA (c) | $ | 30.5 | | | $ | 8.8 | | | $ | 74.2 | |
_____________________________
(a)As of December 31, 2023, we had equity ownership in all of our LMM portfolio companies, and the average fully diluted equity ownership in those portfolio companies was 9%.
(b)The weighted-average annual effective yields were computed using the effective interest rates for all debt investments as of December 31, 2023, including amortization of deferred debt origination fees and accretion of original issue discount but excluding fees payable upon repayment of the debt instruments and any debt investments on non-accrual status, and are weighted based upon the principal amount of each applicable debt investment as of December 31, 2023. The weighted-average annual effective yield on our debt portfolio as of December 31, 2023 including debt investments on non-accrual status was 12.6% for our Private Loan portfolio, 13.0% for our LMM portfolio and 9.9% for our Middle Market portfolio. The weighted-average annual effective yield on our entire investment portfolio as of December 31, 2023, including debt investments on non-accrual status, was 12.4%. The weighted-average annual effective yield is not reflective of what an investor in shares of our common stock will realize on its investment because it does not reflect our utilization of debt capital in our capital structure, our expenses or any sales load paid by an investor. The total return based on change in the Company’s net asset value was 10.9% for the year ended December 31, 2023. See “Financial Highlights” above.
(c)The average EBITDA is calculated using a weighted-average for the Private Loan and Middle Market portfolios and a simple average for the LMM portfolio. These calculations exclude certain portfolio companies, including one Private Loan portfolio company, as EBITDA is not a meaningful valuation metric for our investment in this portfolio company, and those portfolio companies whose primary purpose is to own real estate.
INVESTMENT PROCESS
Our Adviser’s investment committee has oversight over all aspects of our investment processes. The current members of the investment committee are Dwayne L. Hyzak, our Chief Executive Officer, David Magdol, our President and Chief Investment Officer, and Vincent D. Foster, Chairman of Main Street’s board of directors.
Our Adviser’s investment processes for portfolio investments are outlined below. Our Adviser’s investment strategy involves a “team” approach, whereby potential transactions are screened by several members of our Adviser’s investment team before being presented to the investment committee. The investment committee meets on an as-needed basis depending on transaction volume. Our Adviser generally categorizes our investment process into seven distinct stages:
Deal Generation/Origination
Deal generation and origination is maximized through our Adviser’s long-standing and extensive relationships with industry contacts, brokers, commercial and investment bankers, entrepreneurs, service providers such as lawyers, financial advisors and accountants, and current and former portfolio companies and investors. Our Adviser’s investment team has focused its deal generation and origination efforts on investments, and Main Street has developed a reputation as a knowledgeable, reliable and active source of capital and assistance in these markets.
Screening
During the screening process, if a transaction initially meets our investment criteria, our Adviser will perform preliminary due diligence, taking into consideration some or all of the following information:
•a comprehensive financial model based on quantitative analysis of historical financial performance, projections and pro forma adjustments to determine the estimated internal rate of return;
•a brief industry and market analysis;
•direct industry expertise imported from other portfolio companies or investors;
•preliminary qualitative analysis of the management team’s competencies and backgrounds;
•potential investment structures and pricing terms; and
•regulatory compliance.
Upon successful screening of a proposed transaction, the investment team makes a recommendation to the investment committee. If the investment committee concurs with moving forward on the proposed Private Loan transaction, we typically issue a non-binding term sheet to the company.
Term Sheet
For proposed transactions, the non-binding term sheet will include the key economic terms based upon our analysis performed during the screening process, as well as a proposed timeline and our qualitative expectation for the transaction. Upon execution of a term sheet, our Adviser begins the formal due diligence process.
Due Diligence
Due diligence on a proposed investment is generally performed on materials and information obtained from certain external resources and assessed internally by a minimum of three of our Adviser’s investment professionals, who work to understand the relationships among the prospective portfolio company’s business plan, operations and financial performance using the accumulated due diligence information. Our Adviser’s typical due diligence review includes some or all of the following:
•detailed review of historical and projected financial statements;
•site visits or other discussions with management and key personnel;
•in-depth industry, market, operational and strategy analysis;
•regulatory compliance analysis; and
•detailed review of the company’s management team and their capabilities.
During the due diligence process, significant attention is given to sensitivity analyses and how the company might be expected to perform given downside, base-case and upside scenarios. In certain cases, we may decide not to make an investment based on the results of the diligence process.
Document and Close
Upon completion of a satisfactory due diligence review of a proposed portfolio investment, the investment team presents the findings and a recommendation to the investment committee. The presentation contains information which can include, but is not limited to, the following:
•company history and overview;
•transaction overview, history and rationale, including an analysis of transaction strengths and risks;
•overview and history of the private equity sponsor as the company’s equity owner;
•analysis of key customers and suppliers;
•an analysis of the company’s business strategy;
•investment structure and expected returns;
•anticipated sources of repayment and potential exit strategies;
•pro forma capitalization and ownership;
•regulatory compliance analysis findings; and
•an analysis of historical financial results and key financial ratios.
If any adjustments to the transaction terms or structures are proposed by the investment committee, such changes are made and applicable analyses are updated prior to approval of the transaction. Approval for the transaction must be made by the affirmative vote from a majority of the members of the investment committee, with the committee member managing the transaction, if any, abstaining from the vote. Upon receipt of transaction approval, the investment team will re-confirm regulatory compliance, process and finalize all required legal documents, and fund the investment.
Post-Investment
Our Adviser continuously monitors the status and progress of our portfolio companies. Our Adviser generally offers managerial assistance to our portfolio companies, giving them access to our Adviser’s investment experience, direct industry expertise and contacts. The same investment team that was involved in the investment process will continue its involvement in the portfolio company post-investment. This provides for continuity of knowledge and allows the investment team to maintain a strong business relationship with key management of our portfolio companies for post-investment assistance and monitoring purposes.
As part of the monitoring process of our Private Loan and Middle Market portfolio investments, the investment team will analyze monthly and quarterly financial statements versus the previous periods and year, review financial projections and review all compliance certificates and covenants. Depending upon the nature of our portfolio investments, the investment team may also attend board meetings, and meet and discuss issues or opportunities with the portfolio company’s management team or private equity owners.
As part of the monitoring process of our LMM portfolio investments, the investment team will analyze monthly and quarterly financial statements versus the previous periods and year, review financial projections, meet and discuss issues or opportunities with management, attend board meetings and review all compliance certificates and covenants. While the investment team maintains limited involvement in the ordinary course operations of our LMM portfolio companies, the investment team maintains a higher level of involvement in non-ordinary course financing or strategic activities and any non-performing scenarios.
Our Adviser utilizes an internally developed investment rating system to rate the performance of each Private Loan, LMM and Middle Market portfolio company and to monitor our expected level of returns on each of our Private Loan, LMM and Middle Market investments in relation to our expectations for the portfolio company. The investment rating system takes into consideration various factors, including, but not limited to, each investment’s expected level of returns, the collectability of our debt investments and the ability to receive a return of the invested capital in our equity investments, comparisons to competitors and other industry participants, the portfolio company’s future outlook and other factors that are deemed to be significant to the portfolio company.
Exit Strategies/Refinancing
While we generally exit most investments through the refinancing or repayment of our debt and redemption or sale of our equity positions, the refinancing or repayment of Private Loan investments and Middle Market debt investments typically do not require our Adviser’s assistance due to the additional resources available to these larger Private Loan and Middle Market companies. Our Adviser typically assists our LMM portfolio companies in developing and planning exit opportunities, including any sale or merger of our portfolio companies. Our Adviser may also assist in the structure, timing, execution and transition of the exit strategy.
DETERMINATION OF NET ASSET VALUE AND INVESTMENT PORTFOLIO VALUATION PROCESS
We determine the net asset value (“NAV”) per share of our common stock on at least a quarterly basis. The NAV per share is equal to our total assets minus total liabilities divided by the total number of shares of common stock outstanding.
We are required to report our investments at fair value. As a result, the most significant determination inherent in the preparation of our consolidated financial statements is the valuation of our investment portfolio and the related amounts of unrealized appreciation and depreciation. We follow the provisions of the Financial Accounting Standards Board Accounting Standards Codification (“ASC”) 820, Fair Value Measurements and Disclosures (“ASC 820”). ASC 820, which defines fair value, establishes a framework for measuring fair value, establishes a fair value hierarchy based on the quality of inputs used to measure fair value and enhances disclosure requirements for fair value measurements. ASC 820 requires us to assume that the portfolio investment is to be sold in the principal market to independent market participants, which may be a hypothetical market. Market participants are defined as buyers and sellers in the principal market that are independent, knowledgeable and willing and able to transact.
We determine in good faith the fair value of our investment portfolio pursuant to a valuation policy in accordance with ASC 820 and a valuation process approved by our board of directors and in accordance with the 1940 Act. Our valuation policies and processes are intended to provide a consistent basis for determining the fair value of our investment portfolio.
Due to the inherent uncertainty in the valuation process, our determination of fair value for our investment portfolio may differ materially from the values that would have been determined had a ready market for the securities existed. In addition, changes in the market environment, portfolio company performance and other events that may occur over the lives of the investments may cause the gains or losses ultimately realized on these investments to be materially different than the valuations currently assigned. We determine the fair value of each individual investment and record changes in fair value as unrealized appreciation or depreciation.
The 1940 Act requires valuation of a portfolio security at “market value” if market quotations for the security are “readily available.” Portfolio securities for which market quotations are not readily available must be valued at fair value as determined in good faith by the board of directors. Rule 2a-5 under the 1940 Act permits a BDC’s board of directors to designate its executive officers or investment adviser as a valuation designee to determine the fair value for its investment portfolio, subject to the active oversight of the board.
Our board of directors has approved policies and procedures pursuant to Rule 2a-5 (the “Valuation Procedures”) and designated our Adviser, led by a group of our Adviser’s executive officers, to serve as our board of directors’ valuation designee thereunder (the “Valuation Committee”). Pursuant to the Valuation Procedures, we undertake a multi-step process each quarter in connection with determining the fair value of our investments.
The following outlines our valuation process as established under the Valuation Procedures:
•Our quarterly process begins with an initial valuation of each portfolio investment performed by the Adviser’s valuation team consisting of several professionals who apply the appropriate valuation methodology depending on the type of investment.
•Each valuation model is then reviewed by the investment team responsible for monitoring the portfolio investment for accuracy, with any recommended changes reviewed by the valuation team.
•Updated valuation conclusions are then reviewed by and discussed with the Valuation Committee at quarterly valuation meetings. Valuation meetings are generally attended by the Valuation Committee, the valuation team, members of the investment team responsible for each investment and members of the compliance team. Valuation models and valuation conclusions are adjusted as necessary following such meetings.
•A nationally recognized independent financial advisory services firm analyzes and provides observations, recommendations and an assurance certification regarding the determinations of the fair value for the majority of our portfolio companies on a rotational basis.
•After incorporating commentary by the Valuation Committee and review of recommendations provided by the independent financial advisory services firm, valuation results are finalized and approved by the Valuation Committee.
•Our board of directors oversees the process through its Audit Committee in accordance with Rule 2a-5 pursuant to the Valuation Procedures.
Determination of fair value involves subjective judgments and estimates. The notes to our consolidated financial statements refer to the uncertainty with respect to the possible effect of such valuations, and any change in such valuations, on our financial results and financial condition.
COMPETITION
We compete for investments with a number of investment funds (including private equity funds, mezzanine funds and BDCs, as well as traditional financial services companies such as commercial banks and other sources of financing. Many of the entities that compete with us are larger and have more resources available to them. We believe we are able to be competitive with these entities primarily on the basis of the experience and contacts of our Adviser’s management team and our ability to co-invest with Main Street and funds and other accounts managed by our Adviser, our general focus on smaller companies in our Private Loan and LMM investment strategies, which we believe to be underserved in the capital markets, our Adviser’s responsive and efficient investment analysis and decision-making processes, our comprehensive suite of customized financing solutions and the investment terms we offer.
We believe that some of our competitors make senior secured loans, junior secured loans and subordinated debt investments with interest rates and returns that are comparable to or lower than the rates and returns that we target. Therefore, we do not seek to compete primarily on the interest rates and returns that we offer to potential portfolio companies.
LEGAL PROCEEDINGS
We and the Adviser may, from time to time, be involved in litigation arising out of our operations in the normal course of business or otherwise. Furthermore, third parties may seek to impose liability on us and/or the Adviser in connection with the activities of our portfolio companies. While the outcome of any current legal proceedings cannot at this time be predicted with certainty, we do not expect any current matters will materially affect our or the Adviser’s financial condition or results of operations; however, there can be no assurance whether any pending legal proceedings will have a material adverse effect on our or the Adviser’s financial condition or results of operations in any future reporting period.
PROPERTIES
We do not own any real estate or other physical properties materially important to our operations. We believe that our current leased office facilities are adequate to meet our needs.
HUMAN CAPITAL
We do not currently have any employees and do not expect to have any employees in the future. Services necessary for the operation of our business are provided by individuals who are employees of our Adviser or its affiliates, pursuant to the terms of the investment advisory and administrative services agreement. Each of our executive officers is an employee of the Adviser or its affiliates. Our day-to-day investment activities are managed by the Adviser. The services necessary for the origination and monitoring of our investment portfolio are provided by investment professionals of the Adviser, who are all employed by Main Street. As of September 30, 2024, our Adviser had 104 investment and portfolio management professionals, operations professionals and administrative staff. Because we have no employees, we do not have a formal employee relations policy.
MANAGEMENT
Our board of directors oversees our management. Our board of directors currently consists of four members, three of whom are not “interested persons” as defined in Section 2(a)(19) of the 1940 Act. Our board of directors elects our executive officers, who serve at the discretion of our board of directors. The responsibilities of each director include the oversight of our investment activity, the quarterly valuation of our assets, and oversight of our financing arrangements. Our board of directors has also established an audit committee (the “Audit Committee”), a nominating and corporate governance committee (the “Nominating and Corporate Governance Committee”) and, effective upon Listing, a compensation committee (the “Compensation Committee”), in addition to any other committees our board of directors may establish in the future.
Board of Directors
Directors
The following table sets forth certain information regarding our directors:
| | | | | | | | |
Name and Principal Occupation(1) | Age | Director Since(2) |
| | |
| Independent Directors | | |
| | |
Robert L. Kay Mr. Kay has been an independent director since October 2020. Mr. Kay has more than 40 years of broad based banking, investments, private equity intermediary and private business management experience, including commercial loan and venture capital investment portfolio oversight. After spending the first 10 years of his career as a corporate lender with a major Texas bank holding company in Dallas, he returned to his hometown in Austin where he spent the next eight years in the venture investing arena. Beginning in 1990, Mr. Kay served as Chief Executive Officer and/or Chief Operating Officer of multiple start up, growth phase and turnaround operating company situations, including serving as Chief Operating Officer and Chief Financial Officer of DrillingInfo from 2006 until its sale in 2012. Mr. Kay has served as the managing member and Chief Executive Officer of Excelleration Partners, an early stage investment firm since 2012. Mr. Kay currently serves as Chief Executive Officer of halFILE Systems Corporation, a software and data subscription business located in Kyle, Texas, as a Director of Myocardial Solutions, Inc., a healthcare technology company located in Raleigh, North Carolina, and as a Director of The Muny Conservancy, a non-profit organization located in Austin, Texas. Mr. Kay earned a B.B.A. in general business (accounting concentration) from the University of Texas. | 72 | 2020 |
| | |
| | | | | | | | |
John O. Niemann, Jr. Mr. Niemann has been an independent director since 2012 and Chairman of the Nominating and Corporate Governance Committee since October 2020. He is the President and Chief Operating Officer of Arthur Andersen LLP and has been since 2003. He previously served as a Managing Director of Andersen Tax LLC from June 2013 until his retirement from this position in March 2023. He previously served on the administrative board of Arthur Andersen LLP and on the board of partners of Andersen Worldwide. He began his career at Arthur Andersen LLP in 1978 and has served in increasing responsibilities in senior management positions, since 1992. Mг. Niemann has served as a director and Chairman of the Audit Committee of Hines Global Income Trust since July 2014 and as the lead independent director since May 2019 and as a director and Chairman of the Audit Committee of Adams Resources & Energy, Inc. since May 2019 and as Vice-Chairman of the board since May 2024. He previously served as a director of Professional Asset Indemnity Limited, a non-public Bermuda captive insurance company, from October 2021 until it was voluntarily wound up in March 2024. Mr. Niemann has served on the board of directors of many Houston area non-profit organizations, including Catholic Endowment Foundation of Galveston-Houston, Strake Jesuit College Preparatory School (past chair of the board), The Regis School of the Sacred Heart (past chair of the board), The Houston Symphony, The University of St. Thomas, The Alley Theatre and Taping for the Blind, Inc. He graduated with a B.A. in Managerial Studies (magna cum laude) and a master's degree in accounting from Rice University, received a J.D. (summa cum laude) from the South Texas College of Law and an LL.M. in taxation (summa cum laude) from the University of San Francisco School of Law. | 68 | 2012 |
| | |
Jeffrey B. Walker Mr. Walker has been an independent director and Chairman of the Audit Committee since October 2020. Mr. Walker retired in May 2020 after a successful 38 year career in public accounting with Arthur Andersen and, more recently, Deloitte Tax, LLP where he held several leadership roles including, most recently, Vice Chairman from 2014 until May 2020. Mr. Walker served as a member of Deloitte LLP's board from 2011 until 2015 and also served as the Chief Development Officer of Deloitte Tax from 2013 until 2015. During Mr. Walker's tenure with Deloitte, he assisted and advised some of the world's leading private equity firms. Mr. Walker is a certified public accountant and a member of the AICPA and Texas State Board of CPAs and earned a B.B.A. in Accounting and Economics from the University of Mississippi. | 64 | 2020 |
| | |
| Interested Director | | |
| | |
| Mr. Hyzak is an interested person, as defined in the 1940 Act, due to his positions at MSC Income Fund and our Adviser. | | |
| | |
| | | | | | | | |
Dwayne L. Hyzak Mr. Hyzak has been a member of our board of directors since June 2020 and has served as our Chief Executive Officer and Chairman since October 2020. Since 2018, Mr. Hyzak has also served as Main Street's Chief Executive Officer and as a member of Main Street's board of directors. Mr. Hyzak also serves as a member of Main Street's management team's executive and investment committees. Previously, he served as Main Street's President (2015 until November 2018), Chief Operating Officer (2014 until November 2018), Chief Financial Officer (2011 until 2014) and Senior Managing Director since 2011 and also served in other senior executive positions at Main Street prior to 2011. Prior to its IPO in 2007, Mr. Hyzak served as a Senior Managing Director and other executive positions of several Main Street predecessor funds and entities, which are now subsidiaries of Main Street. Mr. Hyzak joined Main Street in 2002, becoming one of the founding members of the firm. Prior to joining Main Street, Mr. Hyzak was a Director of Acquisitions and Integration with Quanta Services, Inc. (NYSE: PWR), which provides specialty contracting services to the power, natural gas and telecommunications industries, where he was principally focused on the company's mergers and acquisitions and corporate finance activities. Previously, Mr. Hyzak was a Manager with Arthur Andersen in its Transaction Advisory Services group. Mr. Hyzak currently serves on the board of directors of Child Advocates, a non-profit organization that trains and supports advocates to serve the interests of abused or neglected children in the greater Houston area. | 51 | 2018 |
_____________________________(1)The address of each director is c/o MSC Income Fund, Inc., 1300 Post Oak Boulevard, 8th Floor, Houston, Texas 77056. The age given for each of our directors is as of September 30, 2024.
(2)Directors serve for a term until the next annual meeting of stockholders and until their successors are duly elected and qualified or until their earlier removal or resignation.
Officers
Our officers serve at the discretion of our board of directors. The following persons serve as our officers and certain significant personnel in the following capacities:
| | | | | | | | | | | |
| Name | Age | Position(s) Held | Officer Since |
Dwayne L. Hyzak(1)(2) | 51 | Chairman of our board of directors and Chief Executive Officer | 2020 |
David L. Magdol(1)(2) | 54 | President and Chief Investment Officer | 2020 |
| Cory E. Gilbert | 51 | Chief Financial Officer and Treasurer | 2020 |
Jesse E. Morris(2) | 56 | Executive Vice President, Chief Operating Officer and Senior Managing Director | 2020 |
Jason B. Beauvais(2) | 49 | Executive Vice President, General Counsel, and Secretary | 2020 |
Nicholas T. Meserve | 44 | Managing Director | 2020 |
Ryan H. McHugh | 47 | Vice President, Chief Accounting Officer and Assistant Treasurer | 2024 |
Kristin L. Rininger | 44 | Chief Compliance Officer and Deputy General Counsel | 2024 |
_____________________________
(1)Member of our Adviser’s investment committee. The investment committee is responsible for all aspects of our investment processes, including approval of investments. Vincent D. Foster, Chairman of Main Street’s board of directors, is also a member of our Adviser’s investment committee.
(2)Executive officer and member of our management team’s executive committee.
The address for each person in the table above is 1300 Post Oak Boulevard, 8th Floor, Houston, Texas 77056. The age given for each person is as of September 30, 2024. Each officer holds office until his successor is chosen and qualified or until his earlier death, removal or resignation.
For more information on Mr. Hyzak, Chairman of our board of directors and Chief Executive Officer, see his biographical information above.
David L. Magdol is our President and Chief Investment Officer and has served in these roles since 2020. Mr. Magdol also serves as the President and Chief Investment Officer of Main Street and as a member of Main Street’s management team's executive and investment committees. He was promoted to the role of President of Main Street in November 2018 and has served as Chief Investment Officer of Main Street since 2011. Previously, he also served as Vice Chairman and Senior Managing Director and in other senior executive positions at Main Street. Prior to its IPO in 2007, Mr. Magdol served as a Senior Managing Director and other executive positions of several Main Street predecessor funds and entities, which are now subsidiaries of Main Street. Mr. Magdol joined Main Street in 2002, becoming one of the founding members of the firm. Prior to joining Main Street, Mr. Magdol was a Vice President in the investment banking group at Lazard Freres & Co. Previously, he managed a portfolio of private equity investments for the McMullen Group, a private investment firm/family office capitalized by Dr. John J. McMullen, the former owner of the New Jersey Devils and the Houston Astros. Mr. Magdol began his career in the structured finance services group of JP Morgan Chase.
Cory E. Gilbert, a certified public accountant, is our Chief Financial Officer and Treasurer and has served in these roles since July 2024. Mr. Gilbert previously served as our Vice President and Chief Accounting Officer since 2020. He also serves as Main Street’s Chief Financial Officer - Asset Management Business and Assistant Treasurer. Prior to joining Main Street in 2019, Mr. Gilbert served as the Chief Financial Officer and Treasurer for OHA Investment Corporation, a publicly traded business development company externally managed by Oak Hill Advisors LP. Prior to joining Oak Hill Advisors LP, Mr. Gilbert worked at RED Capital Group, the commercial mortgage banking arm of ORIX USA, where he most recently served as their Chief Financial Officer. Prior to that, from September 2008 to August 2013, Mr. Gilbert served as a line of business controller of ORIX USA. Mr. Gilbert began his career at KPMG LLP and was a manager in KPMG’s financial services practice in the Dallas-Fort Worth area.
Jesse E. Morris is our Executive Vice President and Chief Operating Officer. Mr. Morris also serves as the Executive Vice President and Chief Operating Officer of Main Street, serves as a member of Main Street’s management team’s executive committee and has held various management roles since joining Main Street in 2019. He has management responsibility over Main Street’s internal operations and is also a Senior Managing Director on Main Street’s lower middle market investment team where his responsibilities include managing a portfolio of lower middle market investments where he is an active board member and assists those companies with various strategic initiatives, capital raises and M&A activity. Mr. Morris is also responsible for originating and executing new investments for the firm. Mr. Morris has served as our Executive Vice President and Chief Operating Officer since 2020 and previously served as our and Main Street’s Chief Financial Officer and Treasurer from 2021 until 2024. Prior to joining Main Street, Mr. Morris served in various roles of increasing responsibility with Quanta Services, Inc. (NYSE: PWR) from 2014 to 2019 including most recently as Executive Vice President – Finance and President – Infrastructure Solutions. In this position, he oversaw the accounting, treasury, tax and financial planning and analysis activities and led Quanta’s public-private partnership (P3) concession and private infrastructure investment activities. Prior to joining Quanta, Mr. Morris served in various financial and accounting positions of increasing responsibility with Sysco Corporation (NYSE: SYY) including as Vice President and Chief Financial Officer – Foodservice Operations and Vice President of Finance and Chief Financial Officer – Broadline Operations. Mr. Morris began his career as a certified public accountant and was an Experienced Manager with Arthur Anderson.
Jason B. Beauvais is our Executive Vice President, General Counsel and Secretary and has served as General Counsel and Secretary since 2020 and as Executive Vice President since 2021. Mr. Beauvais previously served as our Chief Compliance Officer from 2020 until 2023. Mr. Beauvais also serves the Executive Vice President, General Counsel and Secretary of Main Street, as a member of Main Street’s management team's executive committee and has held various management roles since joining Main Street in 2008. He has management responsibility over Main Street's legal, compliance, human resources and technology functions. Mr. Beauvais has served as General Counsel and Secretary since joining Main Street in 2008, as Chief Compliance Officer from 2012 to 2024 and as Executive Vice President since 2021. In addition, he is a member of the Board of Directors of the Houston Arboretum & Nature Center, a non-profit urban nature sanctuary. Prior to joining Main Street, Mr. Beauvais was an attorney with Occidental Petroleum Corporation (NYSE: OXY), an international oil and gas exploration and production company. Before that, Mr. Beauvais practiced corporate and securities law at Baker Botts L.L.P., where he primarily counseled companies in public issuances and private placements of debt and equity and handled a wide range of general corporate and securities matters as well as mergers and acquisitions.
Nicholas T. Meserve is a Managing Director of the Company and has served in this role since 2020. Mr. Meserve has also served as a Managing Director on Main Street’s private credit investment team since joining Main Street in 2012. Mr. Meserve previously served on our Board of Directors from April 2016 until June 2020. Mr. Meserve's responsibilities include managing a portfolio of private loan and middle market investments. He is also responsible for sourcing, originating and executing on new investments for the firm. Prior to joining Main Street in 2012, Mr. Meserve was at Highland Capital Management, LP, a large alternative credit manager, and certain of its affiliates, where he managed a portfolio of senior loans and high yield bonds across a diverse set of industries. Prior to Highland, he was a Director at Pyxis Capital, LP and a Credit Analyst at JP Morgan Chase & Co.
Ryan H. McHugh, a certified public accountant, is our Vice President and Chief Accounting Officer and has served in these roles since August 2024. He also serves as Main Street's Vice President and Chief Accounting Officer and has served in these roles since August 2024. Mr. McHugh previously served as our Vice President of Finance since May 2024. Prior to joining Main Street, Mr. McHugh spent eight years with Academy Sports + Outdoors (NASDAQ: ASO) (“Academy”) where he worked in several leadership roles including Vice President and Corporate Controller. Prior to joining Academy, Mr. McHugh held various accounting and leadership roles at Glori Energy (NASDAQ: GLRI) and Stewart Title Company (NYSE: STC). Mr. McHugh started his career at Grant Thornton in the assurance practice. Mr. McHugh graduated from the University of Texas at Austin with a B.A. in Economics and holds a Master's degree in Accounting from the University of Texas at San Antonio.
Kristin L. Rininger is our Chief Compliance Officer and Deputy General Counsel and has served in these roles since November 2024. She has also served as Chief Compliance Officer and Deputy General Counsel of Main Street since November 2024. Prior to joining Main Street, Ms. Rininger was a Senior Director at ACA Group from June to August 2024 after spending four years as a Director and BDC Team Lead at Optima Partners, a leading financial industry regulatory and compliance consulting firm. She previously spent six years as a corporate and securities attorney at the law firm of Eversheds Sutherland, primarily handling legal, regulatory and compliance matters for BDC clients.
Biographies of Investment Committee Members
For more information on Mr. Hyzak, Chairman of our board of directors and Chief Executive Officer, and David Magdol, our President and Chief Investment Officer, see their biographical information above.
Vincent D. Foster has served as a member of the investment committee since 2007. He has served as Chairman of Main Street’s board of directors since 2007. Mr. Foster previously served as Main Street’s Chief Executive Officer from 2007 until November 2018 and also served as Main Street’s President from 2012 until 2015, as Executive Chairman from November 2018 until 2021 and as senior advisor from 2022 until May 2024. He was also a member of Main Street’s management team’s executive committee from its formation in 2015 until 2021. Mr. Foster also currently serves as a founding director of Quanta Services, Inc. (NYSE: PWR), which provides specialty contracting services to the power, natural gas and telecommunications industries, where he also serves on the audit committee and investment committee. He also served as a director of U.S. Concrete, Inc. (NASDAQ-CM: USCR) from 1999 until 2010, Carriage Services, Inc. (NYSE: CSV) from 1999 to 2011, MSC Income Fund from 2012 until 2013 and Team, Inc. (NYSE: TISI) from 2005 until 2017. In addition, Mr. Foster served as a founding director of the Texas TriCities Chapter of the National Association of Corporate Directors from 2004 to 2011. Mr. Foster, a certified public accountant, had a 19-year career with Arthur Andersen, where he was a partner from 1988 to 1997. Mr. Foster was the director of Arthur Andersen’s Corporate Finance and Mergers and Acquisitions practice for the Southwest United States and specialized in working with companies involved in consolidating their respective industries. Mr. Foster co-founded and from 1997 until December 2021 acted as co-managing partner and in other senior executive positions of several Main Street predecessor funds and entities, which are now subsidiaries of Main Street.
Director Independence
We will be subject to the corporate governance rules of the New York Stock Exchange (“NYSE”) requiring listed companies to have a board of directors with at least a majority of independent directors. The NYSE listing standards provide that a director of a BDC will be considered to be independent if he or she is not an “interested person” of such company, as defined in Section 2(a)(19) of the 1940 Act. The 1940 Act also requires that we, as a BDC, maintain a majority of independent directors on our board of directors. On an annual basis, each member of our board of directors is required to complete a questionnaire designed to provide information to assist our board of directors in determining whether the director is independent under the NYSE’s corporate governance rules, the applicable provisions of the Exchange Act and the 1940 Act. Based on these independence standards and the recommendation of the Nominating and Corporate Governance Committee, our board of directors has affirmatively determined that each of our directors, other than Mr. Hyzak, is independent under such standards.
Our board of directors considered certain portfolio investments and other transactions in which our independent directors may have had a direct or indirect interest, including the transactions, if any, described or cross-referenced under “Certain Relationships and Related Party Transactions, and Director Independence,” in evaluating each director’s independence under the 1940 Act and NYSE standards, our board of directors determined that no such transaction would impact the ability of any director to exercise independent judgment or impair his or her independence.
Communications with our Board of Directors
Stockholders or other interested persons may send written communications to the members of our board of directors, addressed to board of directors, c/o MSC Income Fund, Inc., Corporate Secretary’s Office, 1300 Post Oak Blvd., 8th Floor, Houston, Texas 77056. All communications received in this manner will be delivered to one or more members of our board of directors.
Board of Directors Leadership Structure
Mr. Hyzak serves as Chief Executive Officer, Chairman of our board of directors and a member of our Adviser’s investment committee. Our board of directors believes that Mr. Hyzak is currently best situated to serve as Chairman of our board of directors given his history with the Company and Main Street, his deep knowledge of the Company’s business and his extensive experience in managing private debt investments in middle market companies and private debt and equity investments in lower middle market companies. The Company’s independent directors bring experience, oversight and expertise from outside the Company and industry, while Mr. Hyzak brings Company-specific and industry-specific experience and expertise. Our board of directors believes that the current leadership structure with Mr. Hyzak serving as Chief Executive Officer and Chairman of our board of directors promotes strategy development and execution while facilitating effective, timely communication between management and our board of directors and is optimal for effective corporate governance.
Effective upon a Listing, our board of directors has designated John O. Niemann, Jr. as Lead Independent Director to preside over all executive sessions of independent directors. In the Lead Independent Director’s absence, the remaining independent directors may appoint a presiding director by majority vote. Our corporate governance practices include regular meetings of the independent directors in executive session without the presence of interested directors and management, the establishment of an audit committee, a nominating and corporate governance committee and, effective upon a Listing, a compensation committee, each of which is comprised solely of independent directors, and the appointment of a Chief Compliance Officer, with whom the independent directors meet without the presence of interested directors and other members of management, for administering our compliance policies and procedures. The Lead Independent Director also has the responsibility of consulting with management on board of directors and committee meeting agendas, acting as a liaison between management and independent directors, including maintaining frequent contact with the Chairman and Chief Executive Officer and facilitating collaboration and communication between the independent directors and management.
Committees of our Board of Directors
Our board of directors currently has, and appoints the members of, standing Audit and Nominating and Corporate Governance Committees. Each of those committees is comprised entirely of independent directors and has a written charter approved by our board of directors. The current members of the committees are identified in the following table, with chair positions reflective of such positions to be effective as of a Listing.
| | | | | | | | | | | | | | | | | | | | |
| | Board Committees |
| Director | | Audit | | Nominating and Corporate Governance | | Compensation Committee |
| Robert L. Kay | | þ | | Chair | | þ |
| John O. Niemann, Jr. | | þ | | þ | | Chair |
| Jeffrey B. Walker | | Chair | | þ | | þ |
Mr. Kay also serves as our board of directors’ liaison to our Adviser’s Conflicts Committee, described further below.
Audit Committee. During the year ended December 31, 2023, the Audit Committee met four times. The Audit Committee is responsible for selecting, engaging and discharging our independent accountants, reviewing the plans, scope and results of the audit engagement with our independent accountants, approving professional services provided by our independent accountants (as well as the compensation for those services), reviewing the independence of our independent accountants and reviewing the adequacy of our internal control over financial reporting. In addition, the Audit Committee is responsible for assisting our board of directors with its oversight of our investment valuation policy and procedures and monitoring and overseeing the Company’s policy standards and guidelines for risk assessment and risk management, including with respect to information technology and cybersecurity policies, procedures and incidents. Our board of directors has determined that each of Messrs. Kay, Niemann and Walker is an “audit committee financial expert” as defined by the SEC. For more information on the backgrounds of these directors, see their biographical information above.
Nominating and Corporate Governance Committee. During the year ended December 31, 2023, the Nominating and Corporate Governance Committee met five times. The Nominating and Corporate Governance Committee is responsible for determining criteria for service on our Board, identifying, researching and recommending to our board of directors director nominees for election by our stockholders, selecting nominees to fill vacancies on our board of directors or a committee of our board of directors, developing and recommending to our board of directors any amendments to our corporate governance principles and overseeing the self-assessment of our board of directors and its committees. The Nominating and Corporate Governance Committee also oversees the Company’s strategy, initiatives, policies and reporting related to environmental, social and governance (“ESG”) activities.
Compensation Committee. The Compensation Committee is newly formed, to be effective as of a Listing, and did not meet during the year ended December 31, 2023. The Compensation Committee assists our board of directors in developing and evaluating the compensation of our non-management directors and evaluating succession planning with respect to the chief executive officer and other key executive positions. The Compensation Committee has the authority to engage the services of outside advisers, experts and others as it deems necessary to assist the committee in connection with its responsibilities. The actions of the Compensation Committee are generally reviewed and ratified by the entire board of directors. Our executive officers do not receive any direct compensation from us and, as a result, the Compensation Committee does not produce and/or review a report on executive compensation practices.
MSC Adviser Conflicts Committee. Our Adviser maintains a conflicts committee (the “Conflicts Committee”) that reviews and approves specific matters that may involve conflicts of interest among Main Street and our Adviser’s investment advisory clients, including the Company. Our board of directors has appointed Mr. Kay to represent the Company’s interest as liaison to our Adviser’s Conflicts Committee.
Board and Committee Evaluation Process
Each year, our Board conducts a thorough self-assessment evaluation process. Detailed questionnaires solicit anonymous input from directors regarding the performance and effectiveness of the Board, Board committees, individual directors and interaction with management and provide an opportunity for Board members to identify areas for improvement. The Nominating and Corporate Governance Committee reviews the results and feedback from this process and makes recommendations for improvements as appropriate. The Board has successfully used this process to evaluate Board and Board committee effectiveness and identify opportunities to strengthen the Board.
Board of Directors’ Role in the Oversight of Risk Management
Our board of directors as a whole has responsibility for risk oversight, with reviews of certain areas being conducted by the relevant board of directors committees that report on their deliberations to the full board of directors. The oversight responsibility of our board of directors and its committees is enabled by management reporting processes that are designed to provide visibility to our board of directors about the identification, assessment and management of critical risks and management’s risk mitigation strategies. Areas of focus include competitive, economic, operational, financial (accounting, credit, liquidity and tax), legal, regulatory, compliance and other risks.
Our Adviser has an enterprise risk management program designed to help us identify, categorize, assess, mitigate and manage various risks facing our business. Members of our Adviser’s executive management team monitor and update each risk, regularly reassess the program and the risks identified to align with Company strategy and report on progress thereof to the Audit Committee, which is responsible for overseeing the program.
Our board of directors and its committees oversee risks associated with their respective principal areas of focus, as summarized below. Committees meet in executive session with key management personnel regularly and with representatives of outside advisers as necessary.
| | | | | |
| Board of Directors/Committee | Primary Areas of Risk Oversight |
| Full Board of Directors | Strategic, financial and execution risks and exposures associated with the annual operating plan; major litigation and regulatory exposures and other current matters that may present material risk to our operations, plans, prospects or reputation; material acquisitions and divestitures; risks and exposures associated with leadership assessment, director compensation programs and arrangements and review and approval of our Investment Advisory Agreement (defined below) with our Adviser. |
| Audit Committee | Risks and exposures associated with financial matters, particularly investment valuation including oversight of the valuation designee pursuant to Rule 2a-5 under the 1940 Act, financial reporting and disclosure, tax, accounting, oversight of independent accountants, internal control over financial reporting, related party transactions, financial policies and credit and liquidity matters, along with information technology and cybersecurity systems, policies and procedures, including data privacy and security and business continuity and operational risks. |
| Nominating and Corporate Governance Committee | Risks and exposures relating to our programs and policies relating to legal compliance, corporate governance, director nomination, evaluation and succession planning and oversight of ESG activities. |
| Compensation Committee | Risks and exposures associated with leadership assessment, senior management succession planning, director compensation programs and arrangements, including compensation related regulatory compliance. |
Succession Planning
Our board of directors is actively engaged in succession planning for key personnel. Its succession planning efforts are led by the Compensation Committee for senior management and by the Nominating and Corporate Governance Committee for board of directors members, in each case overseen by the full board of directors. These activities include an ongoing evaluation of our Adviser’s talent and leadership.
Code of Ethics
We and our Adviser have each adopted a code of ethics pursuant to Rule 17j-1 under the 1940 Act that establishes procedures for personal investments and restricts certain personal securities transactions. Personnel subject to the code may invest in securities for their personal investment accounts, including securities that may be purchased or held by us, so long as such investments are made in accordance with the code’s requirements. The code of ethics is available on the EDGAR Database on the SEC’s website at http://www.sec.gov.
In addition, our Code of Business Conduct and Ethics, which is applicable to all of officers, directors and personnel, requires that all officers, directors and personnel avoid any conflict, or the appearance of a conflict, between an individual’s personal interests and our interests. Our Code of Business Conduct and Ethics is available under the “Governance” tab on our website at www.mscincomefund.com/investors. We intend to disclose any substantive amendments to, or waivers from, this code of conduct within four business days of the waiver or amendment through a website posting.
Insider Trading and Hedging and Speculative Trading, Pledging of Company Securities
We have adopted an insider trading policy, which, among other things, governs the purchase, sale, and/or other disposition of the Company’s securities by the Company’s directors, officers and personnel, and which the Company believes is reasonably designed to promote compliance with insider trading laws, rules and regulations. Our insider trading policy prohibits all directors, officers and personnel from, directly or indirectly, trading while in the possession of material nonpublic information related to the Company’s securities and from engaging in short sales and short-term or other speculative trading of our securities and any transactions that hedge or offset, or are designed to hedge or offset, any decrease in the market value of securities issued by us. Prohibited hedging activity includes market transactions in puts, calls and other derivatives and the purchase of prepaid variable forward contracts, equity swaps and collars. Pledging our securities in a margin account or as collateral for a loan is also prohibited under the policy except in limited circumstances that are pre-approved by our chief compliance officer.
Executive Compensation Recovery, or “Clawback”
We have adopted a Clawback Policy in accordance with the requirements of the NYSE and Rule 10D-1 under the Securities Exchange Act of 1934, as amended (the “Exchange Act”), to be effective upon a Listing. Our Clawback Policy provides for the recovery of certain incentive-based compensation in the event of an accounting restatement of our financial statements in connection with material non-compliance with any financial reporting requirement under U.S. Federal securities laws, including any required accounting statement to correct a material error in previously issued financial statements. Under the Clawback Policy, we will promptly recoup from covered executive officers, including our named executive officers, erroneously awarded compensation received by any such covered executive officer after the policy’s effective date if we are required to prepare an accounting restatement.
Responsible Investment
We believe that thoughtful consideration of ESG matters provides meaningful value to our personnel, portfolio companies, stockholders and community. We believe that our commitment to implementing, maintaining and consistently seeking to improve business practices mindful of ESG matters will have a lasting positive impact on all of our key stakeholders. Therefore, we are dedicated to taking ESG considerations into account with respect to our corporate activities, including in the evaluation of investments. Our Adviser incorporates ESG considerations into its investment diligence and evaluation processes. ESG topics considered for any particular business can vary, but can include use of natural resources, compliance with environmental regulation and best practices, gender and ethnic diversity and inclusion practices, community outreach and support and governance policies and practices, among others. These ESG considerations evaluated are part of the total underwriting information considered by our investment teams and investment committee and positive or negative findings with respect to any or all ESG factors will not be dispositive in an investment decision.
Director Compensation
In 2024, our independent directors were entitled to an annual retainer of $120,000. Effective upon a Listing, the annual retainer paid to our independent directors will be $125,000, plus an additional $25,000 annual retainer for the Lead Independent Director. Non-employee directors do not receive fees based on meetings attended absent circumstances that require an exceptionally high number of meetings within an annual period. We do not pay compensation to our interested directors.
Additionally, the Chairpersons of certain committees of our board of directors are entitled to the following annual retainer amounts:
•$15,000 to the Chair of the Audit Committee of our board of directors;
•$10,000 to the Chair of the Nominating and Corporate Governance Committee of our board of directors; and
•$5,000 to the Chair of the Compensation Committee of our board of directors.
We also pay a $10,000 annual retainer to the member of our board of directors appointed to be the liaison to our Adviser’s Conflicts Committee and reimburse all of our directors for reasonable out-of-pocket expenses incurred in connection with their service on our board of directors. Effective upon a Listing, an annual retainer will no longer be paid to the member of our board of directors appointed to be the liaison to our Adviser’s Conflicts Committee.
The following table sets forth the compensation that we paid during the year ended December 31, 2023 to our non-interested directors. Directors who are also employees of Main Street or any of its subsidiaries do not receive compensation for their services as directors.
| | | | | | | | | | | | | | | | | | | | |
| Name of Director | | Fees Earned or Paid in Cash | | All Other Compensation(1) | | Total Compensation(2) |
| Interested Directors: | | | | | | |
| Dwayne L. Hyzak | | $ | — | | | $ | — | | | $ | — | |
| Independent Directors: | | | | | | |
| Robert L. Kay | | 126,500 | | | — | | | 126,500 | |
| John O. Niemann, Jr. | | 126,500 | | | — | | | 126,500 | |
| Jeffrey B. Walker | | 131,500 | | | — | | | 131,500 | |
_____________________________
(1)We did not award any portion of the fees earned by our directors in stock or options during the year ended December 31, 2023. We do not have a profit-sharing, compensation or retirement plan, and directors do not receive any pension or retirement benefits.
(2) The amounts listed are for the fiscal year ending December 31, 2023.
Compensation of our Executive Officers
None of our executive officers receives direct compensation from us. The compensation of the principals and other investment professionals of our Adviser is paid by our Adviser or its affiliates. The compensation of our executive officers for administrative services provided to the Company is paid by our Adviser, but we reimburse our Adviser for, among other things, our allocable portion of the actual cost (without markup) of the persons performing the functions of chief financial officer and chief compliance officer and other personnel engaged to provide such administrative services (including, without limitation, direct compensation costs including the allocable portion of salaries, bonuses, benefits and other direct costs associated therewith) and related overhead costs, including rent. To the extent that our Adviser outsources any of its functions as administrator, we will pay the fees associated with such functions on a direct basis without profit to our Adviser.
Equity Owned by Portfolio Managers
The following table sets forth the dollar range of equity securities of MSIF beneficially owned by the members of our Adviser’s investment committee based on the NAV per share of our common stock as of September 30, 2024:
| | | | | | | | |
| Name | | Dollar Range of Common Stock Beneficially Owned in the Company(1) |
| Vincent D. Foster | | None |
Dwayne L. Hyzak | | Over $100,000 |
| David L. Magdol | | Over $100,000 |
_____________________________(1)The dollar ranges used in the above table are: None, $1 – $10,000, $10,001 – $50,000, $50,001 – $100,000, or over $100,000.
Each of Messrs. Foster, Hyzak and Magdol, who comprise our Adviser’s investment committee, are primarily responsible for the day-to-day management of (i) four pooled investment vehicles, including Main Street and us (each a BDC), with capital under management (which includes total assets and the undrawn portions of debt capital) of $6,344.8 million and $1,285.6 million, respectively, and two private fund clients of our Adviser, with $232.4 million and $123.4 million of capital under management (which includes total assets and the undrawn portions of debt and equity capital), respectively, and (ii) two separately managed accounts, with a total of $57.2 million of capital under management, each of which is a client of our Adviser. The pooled investment vehicles and other accounts for which Messrs. Foster, Hyzak and Magdol are primarily responsible had a combined aggregate of $8.0 billion of capital under management (which includes total assets and the undrawn portions of debt capital) as of September 30, 2024, $1.7 billion of which our Adviser earns management fees and may earn incentive fees, or a carried interest, based on the performance of the capital managed (excluding the $6.3 billion of Main Street’s capital under management as Main Street is internally managed and does not pay any external investment advisory fees). See Risk Factors — Risks Related to our Adviser and its Affiliates for a description of the material risks and conflicts associated with the Adviser and its affiliates provision of investment advisory services to us and other advisory clients.
Main Street and the Adviser have entered into a sharing agreement pursuant to which Main Street provides the Adviser with investment professionals and access to its resources, including Messrs. Foster, Hyzak and Magdol, and none of Messrs. Foster, Hyzak and Magdol receives any direct compensation from us. Mr. Foster serves Main Street as a non-employee director and, in connection with such service, receives an annual cash retainer from Main Street, as well as equity awards under Main Street’s 2022 Non-Employee Director Restricted Stock Plan, subject to forfeiture provisions. Mr. Foster may also defer receipt of some or all of his cash compensation under Main Street’s Deferred Compensation Plan, subject to certain limitations.
As executive officers of Main Street, Messrs. Hyzak and Magdol receive compensation comprised of a base salary, annual cash bonuses, long-term equity compensation pursuant to Main Street’s 2022 Equity and Incentive Plan, and other benefits as detailed in Main Street’s definitive proxy statement on Schedule 14A, filed with the SEC on March 25, 2024. The annual cash bonuses are intended to reward individual performance on an annual basis and can therefore be variable from year to year based on Main Street’s dividend performance as well as corporate and individual performance goals and other measures. Similarly, any long-term equity incentive awards granted to Messrs. Hyzak and Magdol are intended to motivate them by means of performance-related incentives to achieve long-range performance goals and are subject to vesting schedules.
Mr. Foster has served as a member of our Adviser’s investment committee since 2007. Mr. Hyzak has served as a member of our Adviser’s investment committee since 2013. Mr. Magdol has served as a member of our Adviser’s investment committee since 2011. For more information on Mr. Foster, Mr. Hyzak, and Mr. Magdol, see their biographical information above.
Beneficial Ownership of Directors
The following table sets forth the dollar range of equity securities of the Company that were beneficially owned by each director as of September 30, 2024:
| | | | | | | | |
Name and Address(1) | | Dollar Range of Equity Securities Beneficially Owned(2)(3)(4) |
| Interested Directors: | | |
| Dwayne L. Hyzak | | Over $100,000 |
| Independent Directors: | | |
| Robert L. Kay | | Over $100,000 |
| John O. Niemann, Jr. | | Over $100,000 |
| Jeffrey B. Walker | | Over $100,000 |
_____________________________(1)The address of each director is c/o MSC Income Fund, Inc., 1300 Post Oak Boulevard, 8th Floor, Houston, Texas 77056.
(2)Beneficial ownership has been determined in accordance with Rule 16a-1(a)(2) under the Exchange Act.
(3)The dollar range of equity securities beneficially owned by our directors is based on our NAV per share of $15.38 (giving effect to the Reverse Stock Split effected on December 16, 2024) as of September 30, 2024.
(4)The dollar range of equity securities beneficially owned is: None, $1 - $10,000, $10,001 - $50,000, $50,001 - $100,000, or over $100,000.
MANAGEMENT AGREEMENTS
Our Investment Adviser
Our Adviser, a wholly-owned subsidiary of Main Street, was formed in 2013 and serves as the investment adviser for various funds, accounts and strategies.
Current Investment Advisory Agreement
On October 28, 2020, our stockholders approved the appointment of the Adviser as our investment adviser and administrator under the Current Investment Advisory Agreement. In such role, our Adviser has the responsibility to manage our business, including the responsibility to identify, evaluate, negotiate and structure prospective investments, make investment and portfolio management decisions, monitor our investment portfolio and provide our ongoing administrative services.
New Investment Advisory Agreement
We entered into the Current Investment Advisory Agreement with our Adviser and expect to enter into a New Investment Advisory Agreement in connection with this offering. Pursuant to the New Investment Advisory Agreement with our Adviser, we pay our Adviser a fee for investment advisory and management services consisting of two components — a base management fee and an incentive fee. As a part of the New Investment Advisory Agreement, we agreed to reimburse the Adviser for certain expenses it incurs on our behalf. The New Investment Advisory Agreement was approved on July 17, 2024, as described further below under “Board of Directors Approval of the Investment Advisory Agreement.” The New Investment Advisory Agreement was approved by the affirmative vote of the holders of a majority of our outstanding voting securities, as defined in the 1940 Act, at a special meeting of stockholders held on December 11, 2024, and will be effective for an initial two-year term upon a Listing. Thereafter, it will remain effective from year-to-year if approved annually by our board of directors or our stockholders, including, in each case, a majority of the Independent Directors.
Base Management Fee
Pursuant to the New Investment Advisory Agreement, we pay the Adviser a base management fee. The base management fee is calculated at an annual rate of 1.5% of our average total assets (including cash and cash equivalents), payable quarterly in arrears and is calculated based on the average value of our total assets (including cash and cash equivalents) at the end of the two most recently completed calendar quarters. The determination of total assets will reflect changes in the fair value of our portfolio investments reflecting both unrealized appreciation and unrealized depreciation. All or any part of the base management fee not taken as to any quarter shall be deferred without interest and may be taken in such other quarter as the Adviser shall determine, unless the Adviser expressly and in writing delivered to us permanently waives receipt of such base management fee, in which event we shall forever be relieved of the obligation to pay such base management fee for such quarter. The base management fee for any partial quarter shall be appropriately pro-rated.
In addition, under the New Investment Advisory Agreement, the base management fee will be further reduced to an annual rate of (i) 1.25% of the average value of our total assets (including cash and cash equivalents) commencing with the first full calendar quarter following the date on which the aggregate fair value of our investments in our lower middle market investment strategy (“LMM portfolio investments”) falls below 20% of our total investment portfolio at fair value, and (ii) 1.00% of the average value of our total assets (including cash and cash equivalents) commencing with the first full calendar quarter following the date on which the aggregate fair value of our LMM portfolio investments falls below 7.5% of our total investment portfolio at fair value.
Incentive Fee
The incentive fee under the New Investment Advisory Agreement consists of two parts. The first part, referred to as the subordinated incentive fee on income, is calculated and payable quarterly in arrears based on Pre-Incentive Fee Net Investment Income (as defined below) for the immediately preceding quarter. The payment of the subordinated incentive fee will be subject to Pre-Incentive Fee Net Investment Income for the previous quarter, expressed as a quarterly rate of return on our net assets at the beginning of the most recently completed calendar quarter, exceeding 1.50% (or 6.0% annualized), subject to a “catch up” feature (as described below).
For this purpose, “Pre-Incentive Fee Net Investment Income” means interest income, dividend income and any other income (including any other fees such as commitment, origination, structuring, diligence and consulting fees or other fees that we receive from portfolio companies) accrued during the calendar quarter, minus our operating expenses for the quarter (including the base management fee, administrative services expense, the expenses payable under any other administration or similar agreement and any interest expense and dividends paid on any issued and outstanding preferred stock and any income tax expense on our net investment income and any excise tax, but excluding any income tax expense or benefit on our realized capital gains, realized capital losses or unrealized capital appreciation or depreciation and the incentive fee). Pre-Incentive Fee Net Investment Income includes, in the case of investments with a deferred interest feature (such as original issue discount debt instruments and payment in kind (“PIK”) interest and zero coupon securities), accrued income that we have not yet received in cash. Pre-Incentive Fee Net Investment Income does not include any realized capital gains, realized capital losses or unrealized capital appreciation or depreciation, or any income tax expense or benefit related to such items.
The calculation of the subordinated incentive fee on income for each quarter is as follows:
•No subordinated incentive fee on income shall be payable to the Adviser in any calendar quarter in which our Pre-Incentive Fee Net Investment Income does not exceed the hurdle rate of 1.50% (or 6.0% annualized);
•50% of our Pre-Incentive Fee Net Investment Income, if any, that exceeds the hurdle rate but is less than or equal to 2.307692% in any calendar quarter (9.230769% annualized) shall be payable to the Adviser. This portion of the subordinated incentive fee on income is referred to as the “catch up” and is intended to provide the Adviser with an incentive fee of 17.5% on all of our Pre-Incentive Fee Net Investment Income as if the hurdle rate did not apply when the Pre-Incentive Fee Net Investment Income exceeds 2.307692% (9.230769% annualized) in any calendar quarter; and
•For any quarter in which our Pre-Incentive Fee Net Investment Income exceeds 2.307692% (9.230769% annualized), the subordinated incentive fee on income shall equal 17.5% of the amount of our Pre-Incentive Fee Net Investment Income, as the hurdle rate and catch-up will have been achieved.
The second part of the incentive fee, referred to as the incentive fee on capital gains, is an incentive fee on realized capital gains earned on liquidated investments from our investment portfolio, net of any income tax expense associated with such realized capital gains and is determined and payable in arrears as of the end of each calendar year (or upon termination of the New Investment Advisory Agreement). This fee will equal (a) 17.5% of our incentive fee capital gains, which will equal our realized capital gains (net of any related income tax expense) on a cumulative basis from the effective date of the New Investment Advisory Agreement, calculated as of the end of each calendar year thereafter (or upon termination of the New Investment Advisory Agreement), computed net of (1) all realized capital losses on a cumulative basis (net of any related income tax benefit) from the effective date of the New Investment Advisory Agreement, and (2) unrealized capital depreciation (net of any related income tax benefit) on a cumulative basis from the effective date of the New Investment Advisory Agreement, less (b) the aggregate amount of any previously paid capital gain incentive fees from the effective date of the New Investment Advisory Agreement. For purposes of calculating each component of our incentive fee capital gains under the New Investment Advisory Agreement, (1) the cost basis for any investment held by us as of the effective date of the New Investment Advisory Agreement will be deemed to be the fair value for such investment as of the most recent quarter end immediately prior to the effective date of New Investment Advisory Agreement and, with respect to any investment acquired by us subsequent to the effective date of the New Investment Advisory Agreement, the cost basis will equal the cost basis of such investment as reflected in the Company’s financial statements and (2) the income tax expense or benefit associated with all investments will be measured from the most recent quarter end immediately prior to the effective date of the New Investment Advisory Agreement through the date of any such calculation.
Board of Directors Approval of the New Investment Advisory Agreement
Our board of directors determined at a telephonic meeting held on July 17, 2024 to approve the New Investment Advisory Agreement. The approval was then ratified at an in-person meeting on August 13, 2024. In its consideration of the approval of the New Investment Advisory Agreement, our board of directors discussed with our Adviser the intent, in connection with any Listing, to shift our investment focus to be solely focused on the Private Loan investment strategy, rather than the current investment focus primarily on the Private Loan investment strategy and secondarily on our LMM investment strategy, and the potential effects associated with this change in investment strategy. The Board also reviewed the proposed changes in the New Investment Advisory Agreement as compared to the Current Investment Advisory Agreement, including, among other things, (i) the reduction in the annual base management fees payable by the Company to our Adviser, (ii) the amendments to the structure of the subordinated incentive fee on income payable by the Company to our Adviser and reduction in the hurdle, catch-up percentage and incentive fee rates, (iii) the reduction and reset the incentive fee on capital gains payable by the Company to our Adviser, (iv) the incorporation of a cap on the amount of expenses payable by the Company relating to certain internal administrative services, which varies based on the value of the Company’s total assets, and (v) the deletion of provisions required by NASAA Guidelines.
During its review, the Board noted that our Adviser expected that the New Investment Advisory Agreement would not change the nature, quality and extent of the investment advisory and other services currently being provided to us by our Adviser under the Current Investment Advisory Agreement. In addition, the Board members were provided substantial information regarding our Adviser and our performance and focused on information it had received relating to, among other things: (a) the nature, quality and extent of the advisory and other services to be provided to us by our Adviser; (b) the investment performance of the Company and the Adviser; (c) comparative data with respect to advisory fees or similar expenses paid by other BDCs with similar investment objectives; (d) our projected operating expenses and expense ratio, including reimbursement obligations under the New Investment Advisory Agreement, compared to other BDCs with similar investment objectives; (e) any existing and potential sources of indirect income to our Adviser from its relationships with the Company and the profitability of those relationships; (f) information about the services to be performed and the personnel performing such services under the New Investment Advisory Agreement; (g) the organizational capability and financial condition of our Adviser and its respective affiliates, including the credentials of our Adviser’s professional employees; and (h) the possibility of obtaining similar services from other third-party service providers or through an internally managed structure. Our board of directors also reviewed a report prepared by our Adviser which included information comparing (1) our performance with the performance of a group of comparable funds for various periods ended March 31, 2024 and (2) the Company’s total fees with those of a group of comparable funds, the information for which was derived in part from publicly available financial information as of the date of the analysis.
In determining whether to approve the New Investment Advisory Agreement, our board of directors considered all factors that it believed to be relevant, including those discussed above. Our board of directors did not identify any one factor as dispositive, and each director may have attributed different weights to the factors considered.
Based on the information reviewed and the discussion thereof, our board of directors, including all of the Independent Directors, determined that the terms of the New Investment Advisory Agreement, including the fees, are fair and reasonable in relation to the services to be provided and approved the New Investment Advisory Agreement as being in the best interests of the Company and its stockholders, to be effective upon a Listing and directed that the New Investment Advisory Agreement be submitted to stockholders for approval. The New Investment Advisory Agreement was approved by the affirmative vote of the holders of a majority of our outstanding voting securities, as defined in the 1940 Act, at a special meeting of stockholders held on December 11, 2024.
CERTAIN RELATIONSHIPS AND RELATED PARTY TRANSACTIONS
We have procedures in place for the review, approval and monitoring of transactions involving us and certain persons related to us. As a BDC, the 1940 Act restricts us from participating in transactions with any persons affiliated with us, including our or our Adviser’s officers, directors and personnel and any person controlling or under common control with us or our Adviser, subject to certain exceptions. In addition, the Audit Committee reviews and considers related party transactions.
Our Investment Adviser
We are managed by our Adviser, a registered investment adviser under the Investment Advisers Act of 1940, as amended (the “Advisers Act”), formed in November 2013 as a wholly-owned subsidiary of Main Street to provide investment management and other services to parties other than Main Street and its subsidiaries. Our Adviser or its affiliate provided investment sub-advisory services to us since our inception through October 30, 2020. On October 30, 2020, we entered into the Current Investment Advisory with our Adviser, which states that our Adviser will oversee the management of our activities and is responsible for making investment decisions with respect to, and providing day-to-day management and administration of, our investment portfolio.
Our stockholders and our board of directors, which consists of a majority of non-interested directors, approved the Current Investment Advisory Agreement, including the fee structure thereunder. The Current Investment Advisory Agreement was most recently re-approved by our board of directors, including a majority of members who are not “interested” persons (as defined by the 1940 Act) of MSC Income Fund or the Adviser, on July 17, 2024.
On July 17, 2024, our board of directors approved the New Investment Advisory Agreement which amended and restated the Current Investment Advisory Agreement to, among other things, (i) reduce the annual base management fees payable by the Company to our Adviser, (ii) amend the structure of the subordinated incentive fee on income payable by the Company to our Adviser and reduce the hurdle, catch-up percentage and incentive fee rates, (iii) reduce and reset the incentive fee on capital gains payable by the Company to our Adviser, (iv) place a cap on the amount of expenses payable by the Company relating to certain internal administrative services, which varies based on the value of the Company’s total assets, and (v) delete provisions required by NASAA Guidelines. See “Management Agreements–New Investment Advisory Agreement.” Pursuant to the New Investment Advisory Agreement, we pay the Adviser a fee consisting of a base management fee and an incentive fee.
Main Street Fund of Funds Agreement
Under Section 12 of the 1940 Act, investment companies, including other business development companies such as Main Street, generally cannot acquire more than 3% of our total outstanding voting stock, among other limitations. In light of these restrictions, on January 20, 2025, in connection with this offering and Main Street’s potential acquisition in excess of 3% of our outstanding common stock as a result of the purchase by Main Street of the Main Street Indicative Commitment Shares and any additional acquisitions pursuant to the terms of the Main Street Rule 10b5-1 Stock Purchase Plan that Main Street intends to enter in connection with or shortly after the closing of this offering, we entered into the Main Street Fund of Funds Agreement. The Main Street Fund of Funds Agreement provides for the acquisition of our shares of common stock by Main Street, and our sale of such shares to Main Street, in a manner consistent with the requirements of Rule 12d1-4 under the 1940 Act.
Under the Main Street Fund of Funds Agreement, we and Main Street have agreed to hold each other harmless, indemnify and defend the other party, including each party’s respective principals, directors or trustees, officers, employees and agents, against and from any and all losses, costs, expenses or liabilities incurred by or claims or actions asserted against us or Main Street, as applicable, including any of our respective principals, directors or trustees, officers, employees and agents, to the extent such claims or actions result from: (i) a violation of any provision of the Main Street Fund of Funds Agreement by us or Main Street, as applicable, or (ii) a violation of the terms and conditions of Rule 12d1-4 under the 1940 Act, in each case by us or Main Street, as applicable, or our respective principals, directors or trustees, officers, employees, agents, or if applicable, advisers.
Expense Waiver
Pursuant to the Current Investment Advisory Agreement, we are required to pay or reimburse our Adviser for administrative services expenses, which include all costs and expenses related to our day-to-day administration and management not related to advisory services, whether such administrative services were performed by a third-party service provider or our Adviser or its affiliates (to the extent performed by our Adviser, or its affiliates, the “Internal Administrative Services”). Internal Administrative Services include, but are not limited to, the cost of our Adviser’s personnel performing accounting and compliance functions and other administrative services on our behalf.
Our Adviser waived reimbursement of all Internal Administrative Services expenses from October 30, 2020 through December 31, 2021. On January 1, 2022, our Adviser assumed responsibility of certain administrative services that were previously provided for us by a third-party sub-administrator. After December 31, 2021, our Adviser continued to waive reimbursement of all Internal Administrative Services expenses, except for the cost of the services previously provided by the sub-administrator. For the nine months ended September 30, 2024 and 2023, we incurred Internal Administrative Services expenses before expense waivers of $7.2 million and $6.8 million, respectively. For the nine months ended September 30, 2024 and 2023, the Adviser waived the reimbursements of Internal Administrative Services expenses of $6.7 million and $6.3 million, respectively. For the years ended December 31, 2023 and 2022, we incurred Internal Administrative Services Expenses of $8.9 million and $5.1 million, respectively. For the years ended December 31, 2023 and 2022, the Adviser waived the reimbursements of Internal Administrative Services expenses of $8.3 million and $4.5 million, respectively. Waived Internal Administrative Services expenses are permanently waived and are not subject to future reimbursement.
Allocation of Our Adviser’s Time
We rely on our Adviser to manage our day-to-day activities and to implement our investment strategy. Our Adviser and certain of its affiliates are presently, and plan in the future to continue to be, involved with activities which are unrelated to us. Additionally, except for certain restrictions on our Adviser set forth in the Current Investment Advisory Agreement and the Investment Advisory Agreement, our Adviser and its affiliates are not restricted from forming additional investment funds, from entering into other investment advisory relationships or from engaging in other business activities, even though such activities may be in competition with us and/or may involve substantial time and resources of our Adviser. As a result of these activities, our Adviser and certain of its affiliates and their personnel will have conflicts of interest in allocating their time between us and other activities in which they are or may become involved. Therefore, our Adviser, and certain of its affiliates and their personnel may experience conflicts of interest in allocating management time, services, and functions among us and any other business ventures in which they or any of their key personnel, as applicable, are or may become involved. This could result in actions that are more favorable to other affiliated entities than to us. However, our Adviser believes that it and its affiliates have sufficient personnel to discharge fully their responsibilities to all activities in which they are involved.
Indemnification
The Current Investment Advisory Agreement and the New Investment Advisory Agreement provide that our Adviser, any sub-adviser and their respective officers, directors, managers, partners, shareholders, members (and their shareholders or members, including the owners of their shareholders or members), agents, employees, controlling persons and any other person or entity affiliated with or acting on behalf of our Adviser or any sub-adviser, as applicable (each an “Indemnified Party” and, collectively, the “Indemnified Parties”) will not be liable to us for any action taken or omitted to be taken by our Adviser or any sub-adviser in connection with the performance of any of their duties or obligations as an investment adviser of the Company (except to the extent specified in Section 36(b) of the 1940 Act concerning loss resulting from a breach of fiduciary duty (as the same is finally determined by judicial proceedings) with respect to the receipt of compensation for services), and that we will indemnify, defend and protect Indemnified Parties and hold them harmless from and against all losses, damages, liabilities, costs and expenses (including reasonable attorneys’ fees and amounts reasonably paid in settlement) incurred by the Indemnified Parties in connection with the performance of their duties as an investment adviser of the Company, to the extent such losses, damages, liabilities, costs and expenses are not fully reimbursed by insurance, and to the extent that such indemnification would not be inconsistent with the Maryland General Corporation Law, the 1940 Act, the Company’s charter and other applicable law if, among other things, (i) the Indemnified Party has determined, in good faith, that the course of conduct which caused the loss or liability was in the best interests of the Company, (ii) the Indemnified Party was acting on behalf of or performing services for the Company, (iii) such liability or loss was not the result of negligence, willful misfeasance, bad faith, or misconduct by the Indemnified Party and (iv) such indemnification or agreement to hold harmless is recoverable only out of the Company’s net assets and not from stockholders.
Co-Investment Transactions
In the ordinary course of business, we enter into transactions with other parties that may be considered related party transactions. We have implemented certain policies and procedures, both written and unwritten, to ensure that we do not engage in any prohibited transactions with any persons affiliated with us. If such affiliations are found to exist, we seek board of directors and/or appropriate board of directors committee review and approval for such transactions and otherwise comply with, or seek, orders for exemptive relief from the SEC, as appropriate.
We have received an exemptive order from the SEC permitting co-investments among us, Main Street and other funds and clients advised by our Adviser in certain negotiated transactions where co-investing would otherwise be prohibited under the 1940 Act. We have made co-investments, and in the future intend to continue to make co-investments with Main Street and other funds and clients advised by our Adviser, in accordance with the conditions of the order. The order requires, among other things, that our Adviser and Main Street consider whether each such investment opportunity is appropriate for us, Main Street and the other funds and clients advised by our Adviser, as applicable, and if it is appropriate, to propose an allocation of the investment opportunity between such parties. Because our Adviser is wholly-owned by Main Street and is not managing our investment activities as its sole activity, this may provide our Adviser an incentive to allocate opportunities to other participating funds and clients instead of us. However, our Adviser has policies and procedures in place to manage this conflict, including oversight by the independent members of our board of directors. Additional information regarding the operation of the co-investment program is set forth in the order granting exemptive relief, which may be reviewed on the SEC’s website at www.sec.gov. In addition to the co-investment program described above, we also co-invest in syndicated deals and other transactions where price is the only negotiated point by us and our affiliates.
Sales of Common Stock to Main Street
On May 2, 2022, we sold 94,697 shares of our common stock to Main Street at $7.92 per share (without giving effect to the Reverse Stock Split on a retrospective basis), the price at which we issued new shares in connection with reinvestments of the May 2, 2022 dividend pursuant to the DRIP, for total proceeds to the Company of $750,000. The issuance and sale were made pursuant to the exemption from registration under Section 4(a)(2) of the Securities Act of 1933, as amended (the “Securities Act”), and was unanimously approved by our board of directors, including each director who is not an “interested person,” as such term is defined in Section 2(a)(19) of the 1940 Act, of us or the Adviser.
On May 1, 2023, we sold 255,754 shares of our common stock to Main Street at $7.82 per share (without giving effect to the Reverse Stock Split on a retrospective basis), the price at which we issued new shares in connection with reinvestments of the May 1, 2023 dividend pursuant to the DRIP, for total proceeds to the Company of $2.0 million. The issuance and sale were made pursuant to the exemption from registration under Section 4(a)(2) of the Securities Act and was unanimously approved by our board of directors, including each director who is not an “interested person,” as such term is defined in Section 2(a)(19) of the 1940 Act, of us or the Adviser.
On August 1, 2023, we sold 348,542 shares of our common stock to Main Street at $7.89 per share (without giving effect to the Reverse Stock Split on a retrospective basis), the price at which we issued new shares in connection with reinvestments of the August 1, 2023 dividend pursuant to the DRIP, for total proceeds to the Company of $2.8 million. The issuance and sale were made pursuant to the exemption from registration under Section 4(a)(2) of the Securities Act and were unanimously approved by our board of directors, including each director who is not an “interested person,” as such term is defined in Section 2(a)(19) of the 1940 Act, of the Company or the Adviser.
In September 2023, pursuant to the August “Dutch auction” tender offer, Main Street purchased 115,385 shares of our common stock from our stockholders at the August Clearing Price, or $6.50 per share (without giving effect to the Reverse Stock Split on a retrospective basis), for an aggregate cost of $0.8 million. The August Dutch auction tender offer, including Main Street’s participation, were unanimously approved by our board of directors, including each director who is not an “interested person,” as such term is defined in Section 2(a)(19) of the 1940 Act, of the Company or the Adviser.
On November 1, 2023, we sold 475,888 shares of our common stock to Main Street at $7.88 per share (without giving effect to the Reverse Stock Split on a retrospective basis), the price at which we issued new shares in connection with reinvestments of the November 1, 2023 dividend pursuant to the DRIP, for total proceeds to the Company of $3.8 million. The issuance and sale were made pursuant to the exemption from registration under Section 4(a)(2) of the Securities Act and were unanimously approved by our board of directors, including each director who is not an “interested person,” as such term is defined in Section 2(a)(19) of the 1940 Act, of the Company or the Adviser.
On January 31, 2024, we sold 314,070 shares of our common stock to Main Street at $7.96 per share (without giving effect to the Reverse Stock Split on a retrospective basis), the price at which we issued new Shares in connection with reinvestments of the January 31, 2024 dividend pursuant to the DRIP, for total proceeds to the Company of $2.5 million. The issuance and sale were made pursuant to the exemption from registration under Section 4(a)(2) of the Securities Act and were unanimously approved by our board of directors, including each director who is not an “interested person,” as such term is defined in Section 2(a)(19) of the 1940 Act, of the Company or the Adviser.
On May 1, 2024, we sold 315,259 shares of our common stock to Main Street at $7.93 per share (without giving effect to the Reverse Stock Split on a retrospective basis), the price at which we issued new shares in connection with reinvestments of the May 1, 2024 dividend pursuant to the DRIP, for total proceeds to us of $2.5 million. The issuance and sale were made pursuant to the exemption from registration under Section 4(a)(2) of the Securities Act and were unanimously approved by our board of directors, including each director who is not an “interested person,” as such term is defined in Section 2(a)(19) of the 1940 Act, of the Company or the Adviser.
On August 1, 2024, we sold 250,627 shares of our common stock to Main Street at $7.98 per share (without giving effect to the Reverse Stock Split on a retrospective basis), the price at which we issued new shares in connection with reinvestments of the August 1, 2024 dividend pursuant to the DRIP, for total proceeds to us of $2.0 million. The issuance and sale were made pursuant to the exemption from registration under Section 4(a)(2) of the Securities Act and were unanimously approved by our board of directors, including each director who is not an “interested person,” as such term is defined in Section 2(a)(19) of the 1940 Act, of the Company or the Adviser.
CONTROL PERSONS AND PRINCIPAL STOCKHOLDERS
The following table sets forth, as of January 17, 2025, information with respect to the beneficial ownership of our common stock by:
•each person known to us to beneficially own more than five percent of the outstanding shares of our common stock;
•each of our directors and executive officers; and
•all of our directors and executive officers as a group.
Beneficial ownership is determined in accordance with the rules of the SEC and includes voting or investment power with respect to the securities. There is no common stock subject to options that are currently exercisable or exercisable within 60 days of January 17, 2025. Percentage of beneficial ownership is based on 40,240,358 shares of common stock outstanding as of January 17, 2025.
Unless otherwise indicated, to our knowledge, each stockholder listed below has sole voting and investment power with respect to the shares beneficially owned by the stockholder and maintains an address c/o MSC Income Fund, Inc. at 1300 Post Oak Boulevard, 8th Floor, Houston, Texas 77056.
| | | | | | | | | | | | | | |
Name | | Number of Shares of Common Stock Beneficially Owned # | | Percentage of Common Stock Beneficially Owned |
| Interested Directors: | | | | |
| Dwayne L. Hyzak | | 11,227 | | * |
| Independent Directors: | | | | |
| Robert L. Kay | | 10,000 | | * |
| John O. Niemann, Jr. | | 24,846 | | * |
| Jeffrey B. Walker | | 15,756 | | * |
| Executive Officers (that are not directors): | | | | |
| David L. Magdol | | 8,981 | | * |
| Jesse E. Morris | | — | | — | |
| Jason B. Beauvais | | 4,491 | | * |
Cory E. Gilbert | | — | | — |
Ryan H. McHugh | | — | | * |
All executive officers and directors as a group (9 persons) | | 75,301 | | * |
_____________________________
# Reflects the Reverse Stock Split effected on December 16, 2024.
* Amount represents less than 1.0%.
DETERMINATION OF NET ASSET VALUE
We determine the NAV per share of our common stock on at least a quarterly basis. The NAV per share is equal to our total assets minus total liabilities divided by the total number of shares of common stock outstanding.
We are required to report our investments at fair value. As a result, the most significant determination inherent in the preparation of our consolidated financial statements is the valuation of our investment portfolio and the related amounts of unrealized appreciation and depreciation. We follow the provisions of the ASC 820. ASC 820 defines fair value, establishes a framework for measuring fair value, establishes a fair value hierarchy based on the quality of inputs used to measure fair value and enhances disclosure requirements for fair value measurements. ASC 820 requires us to assume that the portfolio investment is to be sold in the principal market to independent market participants, which may be a hypothetical market. Market participants are defined as buyers and sellers in the principal market that are independent, knowledgeable and willing and able to transact.
We determine in good faith the fair value of our investment portfolio pursuant to a valuation policy in accordance with ASC 820 and a valuation process approved by our board of directors and in accordance with the 1940 Act. Our valuation policies and processes are intended to provide a consistent basis for determining the fair value of our investment portfolio.
Due to the inherent uncertainty in the valuation process, our determination of fair value for our investment portfolio may differ materially from the values that would have been determined had a ready market for the securities existed. In addition, changes in the market environment, portfolio company performance and other events that may occur over the lives of the investments may cause the gains or losses ultimately realized on these investments to be materially different than the valuations currently assigned. We determine the fair value of each individual investment and record changes in fair value as unrealized appreciation or depreciation.
The 1940 Act requires valuation of a portfolio security at “market value” if market quotations for the security are “readily available.” Portfolio securities for which market quotations are not readily available must be valued at fair value as determined in good faith by our board of directors. Rule 2a-5 under the 1940 Act permits a BDC’s board of directors to designate its executive officers or investment adviser as a valuation designee to determine the fair value for its investment portfolio, subject to the active oversight of the board.
Our board of directors has approved Valuation Procedures and designated our Adviser, led by a group of Main Street’s and our Adviser’s executive officers, to serve as our board of directors’ Valuation Committee. Pursuant to the Valuation Procedures, we undertake a multi-step process each quarter in connection with determining the fair value of our investments.
The following outlines our valuation process as established under the Valuation Procedures:
•Our quarterly process begins with an initial valuation of each portfolio investment performed by the Adviser’s valuation team consisting of several professionals who apply the appropriate valuation methodology depending on the type of investment.
•Each valuation model is then reviewed by the investment team responsible for monitoring the portfolio investment for accuracy, with any recommended changes reviewed by the valuation team.
•Updated valuation conclusions are then reviewed by and discussed with the Valuation Committee at quarterly valuation meetings. Valuation meetings are generally attended by the Valuation Committee, the valuation team, members of the investment team responsible for each investment and members of the compliance team. Valuation models and valuation conclusions are adjusted as necessary following such meetings.
•A nationally recognized independent financial advisory services firm analyzes and provides observations, recommendations and an assurance certification regarding the determinations of the fair value for the majority of our portfolio companies on a rotational basis.
•After incorporating commentary by the Valuation Committee and review of recommendations provided by the independent financial advisory services firm, valuation results are finalized and approved by the Valuation Committee.
•Our board of directors oversees the process through its Audit Committee in accordance with Rule 2a-5 pursuant to the Valuation Procedures.
Determination of fair value involves subjective judgments and estimates. The notes to our consolidated financial statements refer to the uncertainty with respect to the possible effect of such valuations, and any change in such valuations, on our financial results and financial condition.
DESCRIPTION OF CAPITAL STOCK
The following description is based on relevant portions of the Maryland General Corporation Law and on our Articles of Incorporation and bylaws. This summary may not contain all of the information that is important to you, and we refer you to the Maryland General Corporation Law and our Articles of Incorporation and bylaws, forms of which are incorporated by reference to the exhibits to the registration statement of which this prospectus is a part, for a more detailed description of the provisions summarized below.
Our authorized stock consists of 450,000,000 shares of common stock, par value $0.001 per share, and 50,000,000 shares of preferred stock. Prior to this offering, there has been no public market for shares of our common stock, and we can offer no assurance that a market for shares of our common stock will develop in the future or that the market price for shares of our common stock will not decline following the offering. There are no outstanding options or warrants to purchase shares of our common stock. No stock has been authorized for issuance under any equity compensation plan.
Under our Articles of Incorporation, our board of directors is authorized to classify and reclassify any unissued shares of stock into other classes or series of stock, and to cause the issuance of such shares, without obtaining stockholder approval. In addition, as permitted by the Maryland General Corporation Law, but subject to the 1940 Act, our Articles of Incorporation provide that our board of directors, without any action by our stockholders, may amend the Articles of Incorporation from time to time to increase or decrease the aggregate number of shares of stock or the number of shares of stock of any class or series that we have authority to issue. Under Maryland law, our stockholders generally are not personally liable for our debts or obligations.
The following are our authorized and outstanding classes of equity securities as of September 30, 2024. The amount of outstanding shares in the table below has been adjusted to reflect the Reverse Stock Split effected on December 16, 2024 on a retrospective basis, while the Reverse Stock Split had no affect on the amount of authorized shares.
| | | | | | | | | | | |
| (1) | (2) | (3) | (4) |
| Title of Class | Amount Authorized | Amount Held by us or for Our Account | Amount Outstanding Exclusive of Amounts Shown Under (3) |
| Common Stock | 450,000,000 | — | 40,217,446 |
| Preferred Stock | 50,000,000 | — | — |
All shares of our common stock have equal voting rights and rights to earnings, assets and distributions, except as described below. When shares are issued, upon payment therefor, they will be duly authorized, validly issued, fully paid and nonassessable. Distributions may be paid to the holders of our common stock if, as and when authorized by our board of directors and declared by us out of assets legally available therefore. Shares of our common stock have no conversion, exchange, preemptive or redemption rights. Other than the transfer restrictions set forth in our Articles of Incorporation and described in “Shares Eligible for Future Sale,” shares of our common stock are freely transferable, except where their transfer is restricted by federal and state securities laws or by contract. In the event of our liquidation, dissolution or winding up, each share of our common stock would be entitled to share ratably in all of our assets that are legally available for distribution after we pay all debts and other liabilities and subject to any preferential rights of holders of our preferred stock, if any preferred stock is outstanding at such time. Each share of our common stock is entitled to one vote on all matters submitted to a vote of stockholders, including the election of directors. Except as provided with respect to any other class or series of stock, the holders of our common stock will possess exclusive voting power. There is no cumulative voting in the election of directors, which means that holders of a majority of the outstanding shares of common stock will elect all of our directors, and holders of less than a majority of such shares will be unable to elect any director. Our bylaws currently provide that a plurality of all the votes cast at a meeting of stockholders duly called and at which a quorum is present shall be sufficient to elect a director.
Limitation on Liability of Directors and Officers; Indemnification and Advance of Expenses
Maryland law permits a Maryland corporation to include in its articles of incorporation a provision limiting the liability of its directors and officers to the corporation and its stockholders for money damages except for liability resulting from (a) actual receipt of an improper benefit or profit in money, property or services or (b) active and deliberate dishonesty established by a final judgment as being material to the cause of action. Our Articles of Incorporation contain such a provision that eliminates directors’ and officers’ liability to the maximum extent permitted by Maryland law, subject to the requirements of the 1940 Act.
Maryland law requires a corporation (unless its articles of incorporation provide otherwise, which our Articles of Incorporation do not) to indemnify a director or officer who has been successful in the defense of any proceeding to which he or she is made, or threatened to be made, a party by reason of his or her service in that capacity. Maryland law permits a corporation to indemnify its present and former directors and officers, among others, against judgments, penalties, fines, settlements and reasonable expenses actually incurred by them in connection with any proceeding to which they may be made, or threatened to be made, a party by reason of his or her service in those or other capacities unless it is established that (a) the act or omission of the director or officer was material to the matter giving rise to the proceeding and (1) was committed in bad faith or (2) was the result of active and deliberate dishonesty, (b) the director or officer actually received an improper personal benefit in money, property or services or (c) in the case of any criminal proceeding, the director or officer had reasonable cause to believe that the act or omission was unlawful. However, under Maryland law, a Maryland corporation may not indemnify for an adverse judgment in a suit by or in the right of the corporation or for a judgment of liability on the basis that a personal benefit was improperly received, unless in either case a court orders indemnification, and then only for expenses. In addition, Maryland law permits a corporation to advance reasonable expenses to a director or officer upon the corporation’s receipt of (a) a written affirmation by the director or officer of his or her good faith belief that he or she has met the standard of conduct necessary for indemnification by the corporation and (b) a written undertaking by him or her or on his or her behalf to repay the amount paid or reimbursed by the corporation if it is ultimately determined that the standard of conduct was not met.
Our Articles of Incorporation require us, subject to any limitations set forth under Maryland law and the 1940 Act, to indemnify and hold harmless from and against all liability, loss, judgments, penalties, fines, settlements, and reasonable expenses (including, without limitation, reasonable attorneys’ fees and amounts paid in settlement), and, without requiring a preliminary determination of the ultimate entitlement to indemnification, pay or reimburse reasonable expenses in advance of final disposition of a proceeding to (i) any individual who is a present or former director or officer of the Company and who is made or threatened to be made a party to the proceeding by reason of his or her service in that capacity, (ii) any individual who, while a director or officer of the Company and at the request of the Company, serves or has served as a director, officer, partner, member, manager or trustee of another corporation, partnership, limited liability company, joint venture, trust, employee benefit plan or other enterprise and who is made or threatened to be made a party to the proceeding by reason of his or her service in that capacity or (iii) the Adviser or any of its affiliates acting as an agent of the Company. The rights to indemnification and advance of expenses provided to a director or officer in the Articles of Incorporation vest immediately upon election of such director or officer. We may, with the approval of our board of directors or any duly authorized committee thereof, provide such indemnification and advancement of expenses to a person who served a predecessor of the Company in any of the capacities described in (i) or (ii) above and to any employee or agent of the Company or a predecessor of the Company.
In addition, we have entered into indemnity agreements (the “Indemnity Agreements”) with our directors and executive officers. The Indemnity Agreements generally provide that we will, to the extent specified in the agreements and to the fullest extent permitted by the 1940 Act and Maryland law as in effect on the day the agreement is executed, indemnify and advance expenses to each indemnitee that is, or is threatened to be made, a party to or a witness in any civil, criminal or administrative proceeding. We will indemnify the indemnitee against all expenses, judgments, fines, penalties and amounts paid in settlement actually and reasonably incurred in connection with any such proceeding unless it is established that (i) the act or omission of the indemnitee was material to the matter giving rise to the proceeding and (a) was committed in bad faith or (b) was the result of active and deliberate dishonesty, (ii) the indemnitee actually received an improper personal benefit, or (iii) in the case of a criminal proceeding, the indemnitee had reasonable cause to believe his or her conduct was unlawful. Additionally, we may advance funds to an indemnitee for legal expenses and other costs incurred as a result of legal action for which indemnification is being sought only if all of the following conditions are met: (i) the legal action relates to acts or omissions with respect to the performance of duties or services on our behalf; (ii) the indemnitee has provided us with written affirmation of his or her good faith belief that he or she has met the standard of conduct necessary for indemnification; (iii) the legal action is initiated by a third party who is not a stockholder or the legal action is initiated by a stockholder acting in his or her capacity as such and a court of competent jurisdiction specifically approves such advancement; and (iv) the indemnitee undertakes to repay the advanced funds to us, together with the applicable legal rate of interest thereon, in cases in which he or she is found not to be entitled to indemnification. The Indemnity Agreements also provide that if the indemnification rights provided for therein are unavailable for any reason, we will pay, in the first instance, the entire amount incurred by the indemnitee in connection with any covered proceeding and waive and relinquish any right of contribution we may have against the indemnitee. The rights provided by the Indemnity Agreements are in addition to any other rights to indemnification or advancement of expenses to which the indemnitee may be entitled under applicable law, our Articles of Incorporation, our bylaws, any agreement, a vote of stockholders or a resolution of directors, or otherwise. No amendment or repeal of the Indemnity Agreements will limit or restrict any right of the indemnitee in respect of any action taken or omitted by the indemnitee prior to such amendment or repeal. The Indemnity Agreements will terminate upon the later of (i) the date the indemnitee has ceased to serve as our director or officer, or (ii) the final termination of any proceeding for which the indemnitee is granted rights of indemnification or advancement of expenses or which is brought by the indemnitee. The above description of the Indemnity Agreements is subject to, and is qualified in its entirety by reference to, all the provisions of the form of Indemnity Agreement. We have also entered into agreements similar to the form of Indemnity Agreement with certain of our non-officer and non-director employees and agents serving as officers, managers, directors and in other similar roles of certain of our subsidiaries and portfolio companies at our request.
We have obtained primary and excess insurance policies insuring our directors and officers against certain liabilities they may incur in their capacity as directors and officers. Under such policies, the insurer, on our behalf, may also pay amounts for which we have granted indemnification to the directors or officers.
Provisions of the Maryland General Corporation Law and Our Articles of Incorporation and Bylaws
The Maryland General Corporation Law and our Articles of Incorporation and bylaws contain provisions that could make it more difficult for a potential acquiror to acquire us by means of a tender offer, proxy contest or otherwise. These provisions are expected to discourage certain coercive takeover practices and inadequate takeover bids and to encourage persons seeking to acquire control of us to negotiate first with our board of directors. We believe that the benefits of these provisions outweigh the potential disadvantages of discouraging any such acquisition proposals because, among other things, the negotiation of such proposals may improve their terms.
Election of Directors
Our bylaws provide that directors are elected by a plurality of the votes cast. Pursuant to our Articles of Incorporation and bylaws, our board of directors may amend the bylaws to alter the vote required to elect directors.
Number of Directors; Vacancies; Removal
Our Articles of Incorporation provide that the number of directors will be set only by our board of directors in accordance with our bylaws. Our bylaws provide that a majority of our entire board of directors may at any time increase or decrease the number of directors. However, under our second amended and restated bylaws, approved by our board of directors on December 20, 2024 to be effective upon a Listing, the number of directors may never be less than the minimum number required by the Maryland General Corporation Law, or more than 10. We have elected to be subject to the provision of Subtitle 8 of Title 3 of the Maryland General Corporation Law regarding the filling of vacancies on our board of directors. Accordingly, except as may be provided by our board of directors in setting the terms of any class or series of preferred stock, any and all vacancies on our board of directors may be filled only by the affirmative vote of a majority of the remaining directors in office, even if the remaining directors do not constitute a quorum, and any director elected to fill a vacancy shall serve for the remainder of the full term of the directorship in which the vacancy occurred and until a successor is elected and qualifies, subject to any applicable requirements of the 1940 Act. Our stockholders may remove a director only for cause by the affirmative vote of two-thirds of all the votes entitled to be cast generally in the election of directors.
Action by Stockholders
Under the Maryland General Corporation Law, stockholder action may be taken only at an annual or special meeting of stockholders or by unanimous consent in lieu of a meeting (unless the articles of incorporation provide for stockholder action by less than unanimous written consent, which our Articles of Incorporation do not). These provisions, combined with the requirements of our bylaws regarding the calling of a stockholder-requested special meeting of stockholders discussed below, may have the effect of delaying consideration of a stockholder proposal until the next annual meeting.
Advance Notice Provisions for Stockholder Nominations and Stockholder Proposals
Our bylaws provide that with respect to an annual meeting of stockholders, nominations of persons for election to our board of directors and the proposal of other business to be considered by stockholders may be made only (1) pursuant to our notice of the meeting, (2) by or at the direction of our board of directors or (3) by a stockholder who is a stockholder of record both at the time of giving notice required by our bylaws and at the time of the meeting, who is entitled to vote at the meeting and who has complied with the advance notice procedures of the bylaws. With respect to special meetings of stockholders, only the business specified in our notice of the meeting may be brought before the meeting. Nominations of persons for election to our board of directors at a special meeting may be made only (1) pursuant to our notice of the meeting, (2) by or at the direction of our board of directors or (3) provided that our board of directors has determined that directors will be elected at the meeting, by a stockholder who is a stockholder of record both at the time of giving notice required by our bylaws and at the time of the meeting, who is entitled to vote at the meeting and who has complied with the advance notice provisions of the bylaws.
The purpose of requiring stockholders to give us advance notice of nominations and other business is to afford our board of directors a meaningful opportunity to consider the qualifications of the proposed nominees and the advisability of any other proposed business and, to the extent deemed necessary or desirable by our board of directors, to inform stockholders and make recommendations about such qualifications or business, as well as to provide a more orderly procedure for conducting meetings of stockholders. Although our bylaws do not give our board of directors any power to disapprove stockholder nominations for the election of directors or proposals recommending certain action, they may have the effect of precluding a contest for the election of directors or the consideration of stockholder proposals if proper procedures are not followed and of discouraging or deterring a third party from conducting a solicitation of proxies to elect its own slate of directors or to approve its own proposal without regard to whether consideration of such nominees or proposals might be harmful or beneficial to us and our stockholders.
Calling of Special Meeting of Stockholders
Our bylaws provide that special meetings of stockholders may be called by our board of directors and certain of our officers. Additionally, our current bylaws provide that, subject to the satisfaction of certain procedural and informational requirements by the stockholders requesting the meeting, a special meeting of stockholders shall be called by our secretary upon the written request of stockholders who are stockholders of record at the time of the request and are entitled to cast not less than 10% of all of the votes entitled to be cast on such matter at such meeting. On December 20, 2024, our board of directors adopted our second amended and restated bylaws, to be effective upon a Listing. The second amended and restated bylaws provide that subject to the satisfaction of certain amended procedural and informational requirements by the stockholders requesting the meeting, a special meeting of stockholders shall be called by our secretary upon the written request of stockholders who are stockholders of record at the time of the request and are entitled to cast not less than a majority of all of the votes entitled to be cast on such matter at such meeting. Except for the amendments to the provisions of the bylaws governing special meetings, the terms of the current bylaws were unchanged.
Approval of Extraordinary Corporate Action; Amendment of Articles of Incorporation and Bylaws
Under Maryland law, a Maryland corporation generally cannot dissolve, amend its articles of incorporation, merge, convert, sell all or substantially all of its assets, engage in a share exchange or engage in similar transactions outside the ordinary course of business, unless approved by the affirmative vote of stockholders entitled to cast at least two-thirds of the votes entitled to be cast on the matter. However, a Maryland corporation may provide in its articles of incorporation for approval of these matters by a lesser percentage, but not less than a majority of all of the votes entitled to be cast on the matter. Our Articles of Incorporation generally provide for approval of amendments to our Articles of Incorporation and extraordinary transactions by the stockholders entitled to cast at least a majority of the votes entitled to be cast on the matter. Our Articles of Incorporation also provide that certain amendments and any proposal to make our shares of common stock a “redeemable security” or for our conversion, whether by merger or otherwise, from a closed-end company to an open-end company or any proposal for our liquidation or dissolution requires the approval of the stockholders entitled to cast at least two-thirds of the votes entitled to be cast on such matter.
Our Articles of Incorporation and bylaws provide that our board of directors will have the exclusive power to make, alter, amend or repeal any provision of our bylaws.
No Appraisal Rights
Except with respect to appraisal rights that may arise in connection with the Maryland Control Share Acquisition Act (the “Control Share Act”), discussed below, as permitted by the Maryland General Corporation Law, our Articles of Incorporation provide that stockholders will not be entitled to exercise appraisal rights.
Control Share Acquisitions
The Control Share Act provides that control shares of a Maryland corporation acquired in a control share acquisition have no voting rights except to the extent approved by a vote of at least two-thirds of the votes entitled to be cast on the matter. Shares owned by the acquiror, by officers or by directors who are employees of the corporation are excluded from shares entitled to vote on the matter. Control shares are voting shares of stock which, if aggregated with all other shares of stock owned by the acquiror or in respect of which the acquiror is able to exercise or direct the exercise of voting power (except solely by virtue of a revocable proxy), would entitle the acquiror to exercise voting power in electing directors within one of the following ranges of voting power:
•one-tenth or more but less than one-third;
•one-third or more but less than a majority; or
•a majority or more of all voting power.
The requisite stockholder approval must be obtained each time an acquiror crosses one of the thresholds of voting power set forth above. Control shares do not include shares the acquiring person is then entitled to vote as a result of having previously obtained stockholder approval. A control share acquisition means the acquisition of issued and outstanding control shares, subject to certain exceptions.
A person who has made or proposes to make a control share acquisition may compel the board of directors of the corporation to call a special meeting of stockholders to be held within 50 days of demand to consider the voting rights of the shares. The right to compel the calling of a special meeting is subject to the satisfaction of certain conditions, including an undertaking to pay the expenses of the meeting. If no request for a meeting is made, the corporation may itself present the question at any stockholders meeting.
If voting rights are not approved at the meeting or if the acquiring person does not deliver an acquiring person statement as required by the statute, then the corporation may repurchase for fair value any or all of the control shares, except those for which voting rights have previously been approved. The right of the corporation to repurchase control shares is subject to certain conditions and limitations. Fair value is determined, without regard to the absence of voting rights for the control shares, as of the date of the last control share acquisition by the acquiror or of any meeting of stockholders at which the voting rights of the shares are considered and not approved. If voting rights for control shares are approved at a stockholders meeting and the acquiror becomes entitled to vote a majority of the shares entitled to vote, all other stockholders may exercise appraisal rights. The fair value of the shares as determined for purposes of appraisal rights may not be less than the highest price per share paid by the acquiror in the control share acquisition.
The Control Share Act does not apply (a) to shares acquired in a merger, consolidation or share exchange if the corporation is a party to the transaction or (b) to acquisitions approved or exempted by the articles of incorporation or bylaws of the corporation.
We are not currently subject to the Control Share Act since our bylaws contain a provision exempting from the Control Share Act any and all acquisitions by any person of our shares of stock. There can be no assurance that such provision will not be otherwise amended or eliminated at any time in the future. Notwithstanding the foregoing, at least one United States District Court has held that opting into the Control Share Act conflicts with Section 18(i) of the 1940 Act, made applicable to BDCs by Section 61 thereunder. While the same holding may not apply to a BDC that is subject to the Control Share Act unless it opts out, we will amend our bylaws to be subject to the Control Share Act only if the board of directors determines that doing so is consistent with Section 18(i) of the 1940 Act and it would be in our best interests in light of (1) our board of directors’ fiduciary obligations to us, (2) applicable federal and state law provisions and (3) the particular facts and circumstances surrounding our board of directors’ action.
Business Combinations
Under the Maryland Business Combination Act (the “Business Combination Act”), “business combinations” between a Maryland corporation and an interested stockholder or an affiliate of an interested stockholder are prohibited for five years after the most recent date on which the interested stockholder becomes an interested stockholder. These business combinations include a merger, consolidation, share exchange or, in circumstances specified in the statute, an asset transfer or issuance or reclassification of equity securities. An interested stockholder is defined as:
•any person who, directly or indirectly, beneficially owns 10% or more of the voting power of the corporation’s outstanding voting stock; or
•an affiliate or associate of the corporation who, at any time within the two-year period prior to the date in question, was the beneficial owner, directly or indirectly, of 10% or more of the voting power of the then outstanding voting stock of the corporation.
A person is not an interested stockholder under this statute if the board of directors approved in advance the transaction by which such stockholder otherwise would have become an interested stockholder. However, in approving a transaction, the board of directors may provide that its approval is subject to compliance, at or after the time of approval, with any terms and conditions determined by the board.
After the five-year prohibition, any business combination between the Maryland corporation and an interested stockholder generally must be recommended by the board of directors of the corporation and approved by the affirmative vote of at least:
•80% of the votes entitled to be cast by holders of outstanding shares of voting stock of the corporation; and
•two-thirds of the votes entitled to be cast by holders of voting stock of the corporation other than shares held by the interested stockholder with whom or with whose affiliate the business combination is to be effected or held by an affiliate or associate of the interested stockholder.
These super-majority vote requirements do not apply if the corporation’s common stockholders receive a minimum price, as defined under Maryland law, for their shares in the form of cash or other consideration in the same form as previously paid by the interested stockholder for its shares.
The statute permits various exemptions from its provisions, including business combinations that are exempted by the board of directors before the time that the interested stockholder becomes an interested stockholder. Our board of directors has adopted a resolution exempting any business combination between us and any other person from the provisions of the Business Combination Act, provided that the business combination is first approved by the board of directors, including a majority of the directors who are not interested persons as defined in the 1940 Act. This resolution, however, may be altered or repealed in whole or in part at any time. If these resolutions are repealed, or the board of directors does not otherwise approve a business combination, the statute may discourage others from trying to acquire control of us and increase the difficulty of consummating any offer.
Conflict with 1940 Act
Our Articles of Incorporation provide that, if and to the extent that any provision of our Articles of Incorporation or bylaws conflicts with any provision of the 1940 Act, the applicable provision of the 1940 Act will control; provided however, that such conflict will not affect any of the remaining provisions of the Articles of Incorporation or bylaws or render invalid or improper any action taken or omitted prior to such determination.
Exclusive Forum
Our bylaws provide that, unless we consent in writing to the selection of a different forum, the Circuit Court for Baltimore City, Maryland, or, if that court does not have jurisdiction, the United States District Court for the District of Maryland, Baltimore Division, shall be, except for any claims made under the federal U.S. securities laws, the sole and exclusive forum for (a) any derivative action or proceeding brought on behalf of the Company, (b) any action asserting a claim of breach of any duty owed by a director or officer or other employee of the Company to the Company or to the stockholders of the Company, (c) any action asserting a claim against the Company or any director or officer or other employee of the Company arising pursuant to any provision of the Maryland General Corporation Law, our Articles of Incorporation or our bylaws, or (d) any action asserting a claim against the Company or any director or officer or other employee of the Company that is governed by the internal affairs doctrine. Such provision does not apply to any claims, suits, actions or proceedings arising under the federal securities laws. Any person or entity purchasing or otherwise acquiring any interest in shares of capital stock of the Company will be deemed, to the fullest extent permitted by law, to have notice of and consented to these exclusive forum provisions and to have irrevocably submitted to, and waived any objection to, the exclusive jurisdiction of such courts in connection with any such action or proceeding and consented to process being served in any such action or proceeding, without limitation, by United States mail addressed to the stockholder at the stockholder’s address as it appears on the records of the Company, with postage thereon prepaid.
SHARES ELIGIBLE FOR FUTURE SALE
Upon completion of this offering, 45,740,358 shares of our common stock will be outstanding, assuming no exercise of the underwriters’ option to purchase additional shares. The 5,500,000 shares of common stock sold in the offering (assuming no exercise of the underwriters’ option to purchase additional shares) will be freely tradable without restriction or limitation under the Securities Act, other than those shares that will be subject to a lock-up agreement with the underwriters or that may be acquired through the directed share program by certain program participants, as described elsewhere in this prospectus. Any shares purchased in this offering by our affiliates, as defined in the Securities Act, will be subject to the public information, manner of sale and volume limitations of Rule 144. The shares of our common stock that were issued prior to the completion of this offering, other than 1,160,412 shares of our common stock (adjusted to reflect the Reverse Stock Split effected on December 16, 2024) held by Main Street, and our executive officers and directors, will be freely tradeable without restriction or limitation under the Securities Act, other than as set forth in our Articles of Incorporation, as discussed below.
In general, under Rule 144 as currently in effect, if six months have elapsed since the date of acquisition of restricted securities from us or any of our affiliates and we are subject to the Exchange Act periodic reporting requirements for at least three months prior to the sale, the holder of such restricted securities can sell such securities. However, the number of securities sold by a holder that is an affiliate within any three-month period cannot exceed the greater of:
•1% of the total number of securities then outstanding; or
•the average weekly trading volume of our securities during the four calendar weeks preceding the date on which notice of the sale is filed with the SEC.
Sales under Rule 144 by our affiliates, including Main Street, and our executive officers and directors, also are subject to certain manner of sale limitations, notice requirements and the availability of current public information about us. No assurance can be given as to (a) the likelihood that an active market for our common stock will develop, (b) the liquidity of any such market, (c) the ability of our stockholders to sell our securities or (d) the prices that stockholders may obtain for any of our securities. No prediction can be made as to the effect, if any, that future sales of securities, or the availability of securities for future sales, will have on the market price prevailing from time to time. Sales of substantial amounts of our securities, or the perception that such sales could occur, may affect adversely prevailing market prices of our common stock.
Our Articles of Incorporation contain a provision that limits the transferability of all of our shares of common stock outstanding at the time of this offering for the 365-day period following the Trading Date. Specifically, without the prior written consent of our board of directors (with respect to all or any portion of the Restricted Shares), a stockholder may not Transfer any Restricted Shares until:
•180 days after the Trading Date for one-third of the Restricted Shares held by such stockholder;
•270 days after the Trading Date for two-thirds of the Restricted Shares held by such stockholder; and
•365 days after the Trading Date for all remaining Restricted Shares held by such stockholder.
Any purported Transfer in violation of this provision of our Articles of Incorporation would be void and have no force or effect.
In addition, the Company, its directors and executive officers, the Adviser and Main Street have agreed that, without the prior written consent of the representatives on behalf of the underwriters, they will not, and will not publicly disclose an intention to during the period ending 180 days after the date of this prospectus (the “restricted period”), subject to certain customary exceptions:
•offer, pledge, sell, contract to sell, sell any option or contract to purchase, purchase any option or contract to sell, grant any option, right or warrant to purchase, lend or otherwise transfer or dispose of, directly or indirectly, any shares of our common stock or any securities convertible into or exercisable or exchangeable for shares of our common stock;
•file any registration statement with the SEC relating to the offering of any shares of our common stock or any securities convertible into or exercisable or exchangeable for our common stock; or
•engage in any hedging or other transaction or arrangement (including, without limitation, any short sale or the purchase or sale of, or entry into, any put or call option, or combination thereof, forward, swap or any other derivative transaction or instrument, however described or defined) which is designed or intended to, or which reasonably could be expected to lead to or result in, a sale or disposition of our common stock, or any securities convertible into or exercisable or exchangeable for our common stock (whether by the undersigned or someone other than the undersigned), or transfer of any of the economic consequences of ownership, in whole or in part, directly or indirectly, of our common stock or other securities, in cash or otherwise,
whether any such transaction described above is to be settled by delivery of our common stock or such other securities, in cash or otherwise. In addition, each such person agrees that, without the prior written consent of the representatives on behalf of the underwriters, such person will not, during the restricted period, make any demand for, or exercise any right with respect to, the registration of any shares of our common stock or any security convertible into or exercisable or exchangeable for common stock.
DISTRIBUTION REINVESTMENT PLAN
We have adopted an “opt out” DRIP, which will become effective as of the date of our board of directors’ first declaration of a dividend or distribution on our common stock following a Listing. The DRIP provides for the reinvestment of dividends on behalf of our registered stockholders who hold their shares with SS&C GIDS, Inc., our transfer agent and registrar (the “DRIP Administrator”), or certain brokerage firms that have elected to participate in our DRIP, unless a stockholder has elected to receive dividends in cash. As a result, if we declare a cash dividend, our registered stockholders (or stockholders holding shares through participating brokerage firms) who have not properly “opted out” of the DRIP will have their cash dividend automatically reinvested into additional shares of our common stock. For the avoidance of doubt, stockholders of the Company who did not elect to “opt in” to the DRIP in effect prior to the effective date of the “opt out” DRIP will be deemed to have made an election to “opt out” of our DRIP as of the effective date of the “opt out” DRIP and to continue to receive cash as set forth below.
No action will be required on the part of a registered stockholder who has not “opted out” of the DRIP to have their cash dividends reinvested in shares of our common stock. A registered stockholder may elect to receive an entire dividend in cash by notifying the DRIP Administrator in writing so that such notice is received by the DRIP Administrator no later than ten days before the payment date for a particular dividend to stockholders. The DRIP Administrator will set up an account for shares acquired through the DRIP for each registered stockholder who has not elected to receive dividends in cash and hold such shares in non-certificated form. Those stockholders whose shares are held by a broker or other financial intermediary may receive dividends in cash by notifying their broker or other financial intermediary of their election.
To implement the DRIP, we may use newly issued shares of our common stock or we may instruct the DRIP Administrator to purchase shares of our common stock in the open market, in each case to the extent permitted under applicable law, whether our shares are trading at, above or below net asset value. The determination of whether to use newly issued shares or to purchase shares in the open market to implement the DRIP will be made by the Company based on an examination of the full facts and circumstances of each such distribution to determine the approach that is in the best interests of stockholders, taking into account the board of directors’ fiduciary duties to stockholders, including by weighing the potential dilution in connection with such issuance to be incurred by our stockholders against our need and usage of reinvested funds. If newly issued shares are used to implement the DRIP, the number of shares to be delivered to a participating stockholder will be determined by dividing the total dollar amount of the distribution payable to such stockholder by the closing sales price per share of common stock reported on the New York Stock Exchange on the trading day immediately preceding the applicable distribution payment date (or, if no sale is reported for such date, at the average of their reported bid and asked prices). If the shares of our common stock are purchased in the open market by the DRIP Administrator to implement the DRIP, the number of shares to be delivered to a participating stockholder will be determined by dividing the total dollar amount of the distribution payable to such stockholder by the weighted average price paid per share for all the shares of our common stock purchased by the DRIP Administrator in connection with such purchases on the open market. Participating stockholders will not be charged any fees or commissions with respect to such purchases. We will pay the DRIP Administrator’s fees and expenses under the DRIP.
Stockholders who receive dividends in the form of stock generally are subject to the same federal, state and local tax consequences as are stockholders who elect to receive their dividends in cash. A stockholder’s basis for determining gain or loss upon the sale of stock received in a dividend from us will be equal to the total dollar amount treated as a distribution to the stockholder for tax purposes. Any stock received in a dividend will have a holding period for tax purposes commencing on the day following the day on which the shares are credited to the U.S. stockholder’s account.
Registered stockholders may change their election under the DRIP at any time without penalty upon ten days’ written notice to the DRIP Administrator of such change. If the DRIP Administrator receives a stockholder’s properly executed change of election no later than ten days prior to the next distribution payment date, such election will be effective with respect the next distribution payable. Otherwise, the election will be effective only with respect to any subsequent distribution. Participants may send their written notice to the DRIP Administrator at P.O. Box 219010, Kansas City, MO 64121-9010 (or 430 W. 7th St., Kansas City, MO 64105 for overnight delivery).
We may amend, modify, suspend or terminate the DRIP at any time in our sole discretion. Participants will receive notice of any material amendment, modification, suspension or termination.
MATERIAL U.S. FEDERAL INCOME TAX CONSIDERATIONS
The following discussion is a general summary of the material U.S. federal income tax considerations applicable to us and to an investment in shares of our common stock. This summary does not purport to be a complete description of the U.S. federal income tax considerations applicable to such an investment. For example, we have not described tax consequences that may be relevant to certain types of holders subject to special treatment under U.S. federal income tax laws, including stockholders subject to the alternative minimum tax, tax-exempt organizations, insurance companies, dealers in securities, pension plans and trusts, and financial institutions. In addition, this summary does not address U.S. stockholders (as defined below) that use an accrual method of accounting for tax purposes and are required to include certain amounts in income no later than the time such amounts are reflected on certain applicable financial statements. This summary assumes that investors hold our common stock as capital assets (within the meaning of the Code). The discussion is based upon the Code, U.S. Department of Treasury (“Treasury”) regulations, and administrative and judicial interpretations, each as of the date of this prospectus and all of which are subject to change, possibly retroactively, which could affect the continuing validity of this discussion. We have not sought and will not seek any ruling from the Internal Revenue Service (“IRS”) regarding this offering. This summary does not discuss any aspects of U.S. estate or gift tax or foreign, state or local tax. It does not discuss the special treatment under U.S. federal income tax laws that could result if we invested in tax-exempt securities or certain other investment assets.
A “U.S. stockholder” generally is a beneficial owner of shares of our common stock who is for U.S. federal income tax purposes:
•A citizen or individual resident of the United States;
•A corporation or other entity treated as a corporation, for U.S. federal income tax purposes, created or organized in or under the laws of the United States, any state thereof or the District of Columbia;
•A trust if (i) a court within the United States is able to exercise primary supervision over the administration of the trust and one or more United States persons have the authority to control all substantive decisions of the trust or (ii) the trust has a valid election in effect to be treated as a domestic trust for U.S. federal income tax purposes; or
•An estate, the income of which is subject to U.S. federal income taxation regardless of its source.
A “Non-U.S. stockholder” generally is a beneficial owner of shares of our common stock that is not a U.S. stockholder and not a partnership (or an entity treated as a partnership for U.S. federal income tax purposes).
If a partnership (including an entity treated as a partnership for U.S. federal income tax purposes) holds shares of our common stock, the tax treatment of a partner in the partnership will generally depend upon the status of the partner and the activities of the partnership. A prospective stockholder that is a partner of a partnership holding shares of our common stock should consult his, her or its tax advisers with respect to the purchase, ownership and disposition of shares of our common stock.
Tax matters are very complicated, and the tax consequences to an investor of an investment in shares of our common stock will depend on the facts of his, her or its particular situation. We encourage investors to consult their own tax advisers regarding the specific consequences of such an investment, including tax reporting requirements, the applicability of federal, state, local and foreign tax laws, eligibility for the benefits of any applicable tax treaty and the effect of any possible changes in the tax laws.
Taxation as a Regulated Investment Company
We have elected to be treated for U.S. federal income tax purposes as a RIC under Subchapter M of the Code. Our taxable income includes the taxable income generated by us and certain of our subsidiaries, which are treated as disregarded entities for tax purposes. As a RIC, we generally will not pay corporate-level U.S. federal income taxes on any income that we distribute to our stockholders as dividends. To qualify as a RIC, we must, among other things, meet certain source-of-income and asset diversification requirements (as described below). In addition, in order to obtain RIC tax treatment, we must distribute to our stockholders, for each taxable year, at least 90% of our “investment company taxable income,” which is generally our net ordinary taxable income plus the excess of realized net short-term capital gains over realized net long-term capital losses, and 90% of our tax-exempt income (the “Annual Distribution Requirement”). As part of maintaining RIC status, undistributed taxable income (subject to a 4% non-deductible U.S. federal excise tax) pertaining to a given fiscal year may be distributed up to 12 months subsequent to the end of that fiscal year, provided such dividends are declared on or prior to the later of (i) filing of the U.S. federal income tax return for the applicable fiscal year or (ii) the fifteenth day of the ninth month following the close of the year in which such taxable income was generated.
For any taxable year in which we qualify as a RIC and satisfy the Annual Distribution Requirement, we will not be subject to U.S. federal income tax on the portion of our income or capital gains we distribute (or are deemed to distribute) to stockholders. We will be subject to U.S. federal income tax at the regular corporate rates on any income or capital gains not distributed (or deemed distributed) to our stockholders.
We are subject to a 4% non-deductible U.S. federal excise tax on certain undistributed income unless we distribute in a timely manner an amount at least equal to the sum of (1) 98% of our net ordinary taxable income for each calendar year, (2) 98.2% of our capital gain net income for the one-year period ending December 31 in that calendar year and (3) any taxable income recognized, but not distributed, in preceding years on which we paid no U.S. federal income tax (the “Excise Tax Avoidance Requirement”). Dividends declared and paid by us in a year will generally differ from taxable income for that year as such dividends may include the distribution of current year taxable income, exclude amounts carried over into the following year, and include the distribution of prior year taxable income carried over into and distributed in the current year. For amounts we carry over into the following year, we will be required to pay the 4% U.S. federal excise tax based on 98% of our annual taxable income and 98.2% of our capital gain net income in excess of distributions for the year.
In order to qualify as a RIC for U.S. federal income tax purposes, we must, among other things:
•continue to qualify as a BDC under the 1940 Act at all times during each taxable year;
•derive in each taxable year at least 90% of our gross income from dividends, interest, payments with respect to certain securities loans, gains from the sale of stock or other securities, net income from certain “qualified publicly traded partnerships,” or other income derived with respect to our business of investing in such stock or securities (the “90% Income Test”); and
•diversify our holdings so that at the end of each quarter of the taxable year:
•at least 50% of the value of our assets consists of cash, cash equivalents, U.S. government securities, securities of other RICs, and other securities if such other securities of any one issuer do not represent more than 5% of the value of our assets or more than 10% of the outstanding voting securities of the issuer; and
•no more than 25% of the value of our assets is invested in the securities, other than U.S. government securities or securities of other RICs, (i) of one issuer, (ii) of two or more issuers that are controlled, as determined under applicable Code rules, by us and that are engaged in the same or similar or related trades or businesses or (iii) of certain “qualified publicly traded partnerships” (collectively, the “Diversification Tests”).
In order to comply with the 90% Income Test, we formed the taxable subsidiaries (the “Taxable Subsidiaries”) as wholly-owned taxable subsidiaries for the primary purpose of permitting us to own equity interests in portfolio companies which are “pass-through” entities for tax purposes. Absent the taxable status of the Taxable Subsidiaries, a portion of the gross income from such portfolio companies would flow directly to us for purposes of the 90% Income Test. To the extent such income did not consist of income derived from securities, such as dividends and interest, it could jeopardize our ability to qualify as a RIC and, therefore cause us to incur significant U.S. federal income taxes. The Taxable Subsidiaries are consolidated with MSIF for U.S. GAAP purposes and are included in our consolidated financial statements, and the portfolio investments held by the Taxable Subsidiaries are included in our consolidated financial statements. The Taxable Subsidiaries are not consolidated with us for income tax purposes and may generate income tax expense, or benefit, as a result of their ownership of the portfolio investments. The income tax expense, or benefit, if any, and any related tax assets and liabilities, are reflected in our consolidated financial statements.
We may be required to recognize taxable income in circumstances in which we do not receive cash. For example, if we hold debt obligations that are treated under applicable tax rules as having original issue discount (such as debt instruments issued with warrants and debt securities invested in by us at original issuance at a discount to par), we must include in income each year a portion of the original issue discount that accrues over the life of the obligation, regardless of whether cash representing such income is received by us in the same taxable year. We may also have to include in income other amounts that we have not yet received in cash such as PIK interest, cumulative dividends or amounts that are received in non-cash compensation such as warrants or stock. Moreover, we generally will be required to take certain amounts in income no later than the time such amounts are reflected on our financial statements. Because any original issue discount or other amounts accrued will be included in our investment company taxable income for the year of accrual, we may be required to make a distribution to our stockholders in order to satisfy the Annual Distribution Requirement, even though we will not have received any corresponding cash amount.
Although we do not presently expect to do so, we are authorized to borrow funds and to sell assets in order to satisfy distribution requirements. However, under the 1940 Act, we are not permitted to make distributions to our stockholders in certain circumstances while our debt obligations and other senior securities are outstanding unless certain “asset coverage” tests are met. In addition, because we use debt financing, we may be prevented by covenants contained in our debt financing arrangements from making distributions to our stockholders in certain circumstances. Moreover, our ability to dispose of assets to meet our distribution requirements may be limited by (1) the illiquid nature of our portfolio and/or (2) other requirements relating to our status as a RIC, including the Diversification Tests. If we dispose of assets in order to meet the Annual Distribution Requirement or the Excise Tax Avoidance Requirement, we may make such dispositions at times and/or values that, from an investment standpoint, are not advantageous.
We may distribute taxable dividends that are payable in part in our stock. Under certain applicable provisions of the Code and the Treasury regulations, distributions payable by us in cash or in shares of stock (at the stockholder’s election) would satisfy the Annual Distribution Requirement. The IRS has issued guidance indicating that this rule will apply even where the total amount of cash that may be distributed is limited to no more than 20% of the total distribution. According to this guidance, if too many stockholders elect to receive their distributions in cash, each such stockholder would receive a pro rata share of the total cash to be distributed and would receive the remainder of their distribution in shares of stock. Taxable stockholders receiving such dividends will be required to include the full amount of the dividend (whether received in cash, our stock, or a combination thereof) as (i) ordinary income (including any qualified dividend income that, in the case of a noncorporate stockholder, may be eligible for the same reduced maximum tax rate applicable to long-term capital gains to the extent such distribution is properly reported by us as qualified dividend income and such stockholder satisfies certain minimum holding period requirements with respect to our stock), or (ii) long-term capital gain (to the extent such distribution is properly reported as a capital gain dividend), to the extent of our current and accumulated earnings and profits for U.S. federal income tax purposes. As a result, a U.S. stockholder may be required to pay tax with respect to such dividends in excess of any cash received. If a U.S. stockholder sells the stock it receives in order to pay this tax, the sales proceeds may be less than the amount included in income with respect to the dividend, depending on the market price of our stock at the time of the sale. Furthermore, with respect to Non-U.S. stockholders, we may be required to withhold U.S. tax with respect to such dividends, including in respect of all or a portion of such dividend that is payable in stock. In addition, if a significant number of our stockholders determine to sell shares of our stock in order to pay taxes owed on dividends, it may put downward pressure on the trading price of our stock.
The remainder of this discussion assumes that we qualify as a RIC and have satisfied the Annual Distribution Requirement.
Taxation of U.S. Stockholders
Distributions by us generally are taxable to U.S. stockholders as ordinary income or capital gains. Distributions of our “investment company taxable income” (which is, generally, our net ordinary income plus realized net short-term capital gains in excess of realized net long-term capital losses) will be taxable as ordinary income to U.S. stockholders to the extent of our current or accumulated earnings and profits, whether paid in cash or reinvested in additional common stock. To the extent such distributions paid by us to non-corporate stockholders (including individuals) are attributable to dividends received by us from U.S. corporations and certain qualified foreign corporations, such distributions (“Qualifying Dividends”) may be eligible for a maximum tax rate of 20.0% (plus the 3.8% Medicare surtax discussed below, if applicable). In this regard, it is anticipated that distributions paid by us will generally not be attributable to dividends received by us, and, therefore, generally will not qualify for the 20.0% (plus the 3.8% Medicare surtax, if applicable) maximum rate applicable to Qualifying Dividends. Distributions of our net capital gains (which is generally our realized net long-term capital gains in excess of realized net short-term capital losses) properly reported by us as “capital gain dividends” will be taxable to a U.S. stockholder as long-term capital gains that are currently taxable at a maximum rate of 20.0% (plus the 3.8% Medicare surtax, if applicable) in the case of individuals, trusts or estates, regardless of the U.S. stockholder’s holding period for his, her or its common stock and regardless of whether paid in cash or reinvested in additional common stock. Distributions in excess of our earnings and profits first will reduce a U.S. stockholder’s adjusted tax basis in such stockholder’s common stock and, after the adjusted basis is reduced to zero, will constitute capital gains to such U.S. stockholder.
We may retain some or all of our realized net long-term capital gains in excess of realized net short-term capital losses, but designate the retained net capital gain as a “deemed distribution.” In that case, among other consequences, we will pay tax on the retained amount, each U.S. stockholder will be required to include his, her or its share of the deemed distribution in income as if it had been actually distributed to the U.S. stockholder, and the U.S. stockholder will be entitled to claim a credit equal to his, her or its allocable share of the tax paid thereon by us. Because we expect to pay tax on any retained capital gains at our regular corporate tax rate, and because that rate is in excess of the maximum rate currently payable by individuals on long-term capital gains, the amount of tax that individual U.S. stockholders will be treated as having paid will exceed the tax they owe on the capital gain distribution and such excess generally may be refunded or claimed as a credit against the U.S. stockholder’s other U.S. federal income tax obligations. The amount of the deemed distribution net of such tax will be added to the U.S. stockholder’s cost basis for his, her or its common stock. In order to utilize the deemed distribution approach, we must provide written notice to our stockholders prior to the expiration of 60 days after the close of the relevant taxable year. We cannot treat any of our investment company taxable income as a “deemed distribution.”
We have adopted a distribution reinvestment plan for our stockholders. If a stockholder reinvests our distributions in additional shares, such stockholder will generally be subject to the same U.S. federal, state and local tax consequences as if it had received a distribution in cash and, for this purpose, a stockholder receiving a distribution in the form of additional shares will generally be treated as receiving a distribution in the amount of cash that the stockholder would have received if it had elected to receive the distribution in cash. If we issue additional shares with a fair market value equal to or greater than net asset value, however, the stockholder will be treated as receiving a distribution in the amount of the fair market value of the distributed shares. Any such additional shares will have a tax basis equal to the amount treated as a distribution for U.S. federal income tax purposes. The additional shares will have a new holding period commencing on the day following the day on which the shares are credited to the stockholder’s account.
In any fiscal year, we may elect to make distributions to our stockholders in excess of our taxable earnings for that fiscal year. As a result, a portion of those distributions may be deemed for tax purposes to be a return of capital to our stockholders.
For purposes of determining (1) whether the Annual Distribution Requirement is satisfied for any year and (2) the amount of capital gain dividends paid for that year, we may, under certain circumstances, elect to treat a dividend that is paid during the following taxable year as if it had been paid during the taxable year in question. If we make such an election, the U.S. stockholder will still be treated as receiving the dividend in the taxable year in which the distribution is made. However, any dividend declared by us in October, November or December of any calendar year, payable to stockholders of record on a specified date in such month and actually paid during January of the following year, will be treated as if it had been received by our U.S. stockholders on December 31 of the year in which the dividend was declared.
If an investor purchases shares of our common stock shortly before the record date of a distribution, the price of the shares will include the value of the distribution and the investor will be subject to tax on the distribution even though economically it may represent a return of his, her or its investment.
A stockholder generally will recognize taxable gain or loss if the stockholder sells or otherwise disposes of his, her or its shares of our common stock. The amount of gain or loss will be measured by the difference between such stockholder’s adjusted tax basis in the common stock sold and the amount of the proceeds received in exchange. Any gain arising from such sale or disposition generally will be treated as long-term capital gain or loss if the stockholder has held his, her or its shares for more than one year. Otherwise, it will be classified as short-term capital gain or loss. However, any capital loss arising from the sale or disposition of shares of our common stock held for six months or less will be treated as long-term capital loss to the extent of the amount of capital gain dividends received, or undistributed capital gain deemed received, with respect to such shares. In addition, all or a portion of any loss recognized upon a disposition of shares of our common stock may be disallowed if other shares of our common stock are purchased (whether through reinvestment of distributions or otherwise) within 30 days before or after the disposition.
In general, individual U.S. stockholders currently are subject to a maximum U.S. federal income tax rate of 20.0% on their net capital gain (i.e., the excess of realized net long-term capital gains over realized net short-term capital losses), including any long-term capital gain derived from an investment in our shares. Such rate is lower than the maximum rate on ordinary income currently payable by individuals. In addition, individuals with modified adjusted gross income in excess of $200,000 ($250,000 in the case of married individuals filing jointly) and certain estates and trusts are subject to an additional 3.8% Medicare surtax on their “net investment income,” which generally includes net income from interest, dividends, annuities, royalties, and rents, and net capital gains (other than certain amounts earned from trades or businesses). Corporate U.S. stockholders currently are subject to U.S. federal income tax on net capital gain at the maximum 21.0% rate also applied to ordinary income. Non-corporate stockholders with net capital losses for a year (i.e., capital losses in excess of capital gains) generally may deduct up to $3,000 of such losses against their ordinary income each year; any net capital losses of a non-corporate stockholder in excess of $3,000 generally may be carried forward and used in subsequent years as provided in the Code. Corporate stockholders generally may not deduct any net capital losses for a year but may carryback such losses for three years or carry forward such losses for five years.
We, or the applicable withholding agent, will send to each of our U.S. stockholders, as promptly as possible after the end of each calendar year, a notice detailing, on a per share and per distribution basis, the amounts includible in such U.S. stockholder’s taxable income for such year as ordinary income and as long-term capital gain. In addition, the U.S. federal tax status of each year’s distributions generally will be reported to the Internal Revenue Service (including the amount of dividends, if any, eligible for the 20.0% maximum rate). Dividends paid by us generally will not be eligible for the dividends-received deduction or the preferential tax rate applicable to Qualifying Dividends because our income generally will not consist of dividends. Distributions may also be subject to additional state, local and foreign taxes depending on a U.S. stockholder’s particular situation.
We, or the applicable withholding agent, may be required to withhold U.S. federal income tax (“backup withholding”) from all taxable distributions to any U.S. stockholder (1) who fails to furnish us, or the applicable withholding agent, with a correct taxpayer identification number or a certificate that such stockholder is exempt from backup withholding or (2) with respect to whom the IRS notifies us, or the applicable withholding agent, that such stockholder has failed to properly report certain interest and dividend income to the IRS and to respond to notices to that effect. An individual’s taxpayer identification number is his or her social security number. Any amount withheld under backup withholding is allowed as a credit against the U.S. stockholder’s U.S. federal income tax liability, provided that proper information is provided to the IRS.
Taxation of Non-U.S. Stockholders
Whether an investment in shares of our common stock is appropriate for a Non-U.S. stockholder will depend upon that person’s particular circumstances. An investment in shares of our common stock by a Non-U.S. stockholder may have adverse tax consequences. Non-U.S. stockholders should consult their tax advisers before investing in our common stock.
Distributions of our “investment company taxable income” to Non-U.S. stockholders (including interest income and realized net short-term capital gains in excess of realized long-term capital losses, which generally would be free of withholding if paid to Non-U.S. stockholders directly) will be subject to withholding of U.S. federal tax at a 30.0% rate (or lower rate provided by an applicable treaty) to the extent of our current and accumulated earnings and profits unless an applicable exception applies. If a Non-U.S. stockholder reinvests the distributions in additional shares pursuant to our distribution reinvestment plan, and the distribution is subject to withholding tax, only the net after-tax amount will be reinvested in additional shares. If the distributions are effectively connected with a U.S. trade or business of the Non-U.S. stockholder, and, if an income tax treaty applies, attributable to a permanent establishment in the United States, we will not be required to withhold U.S. federal tax if the Non-U.S. stockholder complies with applicable certification and disclosure requirements, although the distributions will be subject to U.S. federal income tax at the rates applicable to U.S. persons (special certification requirements apply to a Non-U.S. stockholder that is a foreign partnership or a foreign trust, and such entities are urged to consult their own tax advisers.)
We generally are not required to withhold any amounts with respect to certain distributions of (i) U.S. source interest income, and (ii) net short term capital gains in excess of net long term capital losses, in each case to the extent we properly reported such distributions and certain other requirements were satisfied. This exemption will not apply to our distributions paid in respect of our Non-U.S. source interest income or our dividend income. We anticipate that a portion of our distributions will be eligible for this exemption from withholding; however, we cannot determine what portion of our distributions (if any) will be eligible for this exception until after the end of our taxable year. No certainty can be provided that any of our distributions will be reported as eligible for this exception.
Actual or deemed distributions of our net capital gains to a Non-U.S. stockholder, and gains realized by a Non-U.S. stockholder upon the sale of our common stock, will not be subject to U.S. federal withholding tax and generally will not be subject to U.S. federal income tax unless the distributions or gains, as the case may be, are effectively connected with a U.S. trade or business of the Non-U.S. stockholder and, if an income tax treaty applies, are attributable to a permanent establishment maintained by the Non-U.S. stockholder in the United States, in which case the distributions or gains will be subject to U.S. federal income tax on a net basis at the rates and in the manner applicable to U.S. stockholders generally.
If we distribute our net capital gains in the form of deemed rather than actual distributions, a Non-U.S. stockholder will be entitled to a U.S. federal income tax credit or tax refund equal to the stockholder’s allocable share of the tax we pay on the capital gains deemed to have been distributed. In order to obtain the refund, the Non-U.S. stockholder must obtain a U.S. taxpayer identification number and file a U.S. federal income tax return even if the Non-U.S. stockholder would not otherwise be required to obtain a U.S. taxpayer identification number or file a U.S. federal income tax return. For a corporate Non-U.S. stockholder, distributions (both actual and deemed), and gains realized upon the sale of our common stock that are effectively connected to a U.S. trade or business may, under certain circumstances, be subject to an additional “branch profits tax” at a 30.0% rate (or at a lower rate if provided for by an applicable treaty). Accordingly, investment in the shares may not be appropriate for a Non-U.S. stockholder.
A Non-U.S. stockholder may be subject to information reporting and backup withholding of U.S. federal income tax on dividends unless the Non-U.S. stockholder provides us or the applicable withholding agent with an IRS Form W-8BEN or IRS Form W-8BEN-E (or an acceptable substitute form) or otherwise meets documentary evidence requirements for establishing that it is a Non-U.S. stockholder or otherwise establishes an exemption from backup withholding.
Legislation commonly referred to as the “Foreign Account Tax Compliance Act,” or “FATCA,” generally imposes a 30% withholding tax on payments of certain types of income to foreign financial institutions (“FFIs”) unless such FFIs either (i) enter into an agreement with the Treasury to report certain required information with respect to accounts held by U.S. persons (or held by foreign entities that have U.S. persons as substantial owners) or (ii) reside in jurisdictions that have entered into an intergovernmental agreement (“IGA”) with the United States to collect and share such information and are in compliance with the terms of such IGA and any enabling legislation or regulations. The types of income subject to the tax include U.S. source interest and dividends. The information required to be reported includes the identity and taxpayer identification number of each account holder that is a U.S. person and transaction activity within the holder’s account. In addition, subject to certain exceptions, this legislation also imposes a 30% withholding on payments to foreign entities that are not FFIs unless the foreign entity certifies that it does not have a greater than 10% U.S. owner or provides the withholding agent with identifying information on each greater than 10% U.S. owner. Depending on the status of a Non-U.S. stockholder and the status of the intermediaries through which it holds our common stock, a Non-U.S. stockholder could be subject to this 30% withholding tax with respect to distributions on our common stock and proceeds from the sale of our common stock. Under certain circumstances, a Non-U.S. stockholder might be eligible for refunds or credits of such taxes.
Non-U.S. persons should consult their own tax advisers with respect to the U.S. federal income tax and withholding tax, and state, local and foreign tax consequences of an investment in the shares.
Failure to Qualify as a RIC
If we fail to satisfy the 90% Income Test or the Diversification Tests for any taxable year, we may nevertheless continue to qualify as a RIC for such year if certain relief provisions are applicable (which may, among other things, require us to pay certain corporate-level U.S. federal taxes or to dispose of certain assets).
If we were unable to qualify for treatment as a RIC and the foregoing relief provisions are not applicable, we would be subject to tax on all of our taxable income at regular corporate rates. We would not be able to deduct distributions to stockholders, nor would they be required to be made. If we were subject to tax on all of our taxable income at regular corporate rates, then distributions we make after being subject to such tax would be taxable to our stockholders and, provided certain holding period and other requirements were met, could qualify for treatment as “qualified dividend income” eligible for the maximum 20% rate (plus a 3.8% Medicare surtax, if applicable) applicable to qualified dividends to the extent of our current and accumulated earnings and profits. Subject to certain limitations under the Code, corporate taxpayers would be eligible for a dividends-received deduction on distributions they receive. Distributions in excess of our current and accumulated earnings and profits would be treated first as a return of capital to the extent of the stockholder’s tax basis, and any remaining distributions would be treated as a capital gain. To requalify as a RIC in a subsequent taxable year, we would be required to satisfy the RIC qualification requirements for that year and dispose of any earnings and profits from any year in which we failed to qualify as a RIC. Subject to a limited exception applicable to RICs that qualified as such under Subchapter M of the Code for at least one year prior to disqualification and that requalify as a RIC no later than the second year following the nonqualifying year, we could be subject to tax on any unrealized net built-in gains in the assets held by us during the period in which we failed to qualify as a RIC that are recognized within the subsequent five years, unless we made a special election to pay corporate-level U.S. federal income tax on such built-in gain at the time of our requalification as a RIC.
REGULATION
Regulation as a Business Development Company
We have elected to be regulated as a BDC under the 1940 Act. The 1940 Act contains prohibitions and restrictions relating to transactions between BDCs and their affiliates, principal underwriters and affiliates of those affiliates or underwriters. The 1940 Act requires that a majority of the members of the board of directors of a BDC be persons other than “interested persons,” as that term is defined in the 1940 Act. In addition, the 1940 Act provides that we may not change the nature of our business so as to cease to be, or to withdraw our election as, a BDC unless approved by a majority of our outstanding voting securities.
The 1940 Act defines “a majority of the outstanding voting securities” as the lesser of (i) 67% or more of the voting securities present at a meeting if the holders of more than 50% of our outstanding voting securities are present or represented by proxy or (ii) more than 50% of our outstanding voting securities.
Qualifying Assets
Under the 1940 Act, a BDC may not acquire any asset other than assets of the type listed in Section 55(a) of the 1940 Act, which are referred to as qualifying assets, unless, at the time the acquisition is made, qualifying assets represent at least 70% of the company’s total assets. The principal categories of qualifying assets relevant to our business are any of the following:
(1)Securities purchased in transactions not involving any public offering from the issuer of such securities, which issuer (subject to certain limited exceptions) is an eligible portfolio company (as defined below), or from any person who is, or has been during the preceding 13 months, an affiliated person of an eligible portfolio company, or from any other person, subject to such rules as may be prescribed by the SEC.
(2)Securities of any eligible portfolio company that we control.
(3)Securities purchased in a private transaction from a U.S. issuer that is not an investment company or from an affiliated person of the issuer, or in transactions incident thereto, if the issuer is in bankruptcy and subject to reorganization or if the issuer, immediately prior to the purchase of its securities was unable to meet its obligations as they came due without material assistance other than conventional lending or financing arrangements.
(4)Securities of an eligible portfolio company purchased from any person in a private transaction if there is no ready market for such securities and we already own 60% of the outstanding equity of the eligible portfolio company.
(5)Securities received in exchange for or distributed on or with respect to securities described in (1) through (4) above, or pursuant to the exercise of warrants or rights relating to such securities.
(6)Cash, cash equivalents, U.S. government securities or high-quality debt securities maturing in one year or less from the time of investment.
In addition, a BDC must have been organized and have its principal place of business in the United States and must be operated for the purpose of making investments in the types of securities described in (1), (2) or (3) above.
An eligible portfolio company is defined in the 1940 Act as any issuer which:
(1)is organized under the laws of, and has its principal place of business in, the United States;
(2)is not an investment company (other than a small business investment company wholly-owned by the BDC) or a company that would be an investment company but for certain exclusions under the 1940 Act; and
(3)satisfies any of the following:
(1)does not have any class of securities that is traded on a national securities exchange or has a class of securities listed on a national securities exchange but has an aggregate market value of outstanding voting and non-voting common equity of less than $250 million;
(2)is controlled by a BDC or a group of companies including a BDC and the BDC has an affiliated person who is a director of the eligible portfolio company; or
(3)is a small and solvent company having total assets of not more than $4 million and capital and surplus of not less than $2 million.
Managerial Assistance to Portfolio Companies
As noted above, a BDC must be operated for the purpose of making investments in the type of securities described in (1), (2) or (3) above under the heading entitled “— Qualifying Assets.” In addition, BDCs must generally offer to make available to such issuer of the securities (other than small and solvent companies described above) significant managerial assistance. Making available managerial assistance means, among other things, any arrangement whereby the BDC, through its directors, officers or employees, offers to provide, and, if accepted, does so provide, significant guidance and counsel concerning the management, operations or business objectives and policies of a portfolio company. However, if a BDC purchases securities in conjunction with one or more other persons acting together, one of the other persons in the group may make available such significant managerial assistance on behalf of all investors in the group.
Temporary Investments
Pending investment in “qualifying assets,” as described above, our investments may consist of cash, cash equivalents, U.S. government securities and high-quality debt securities maturing in one year or less from time of investment therein, so that 70% of our assets are qualifying assets.
Senior Securities
Under the provisions of the 1940 Act, we are permitted, as a BDC, to issue senior securities only in amounts such that our asset coverage, as defined in the 1940 Act, equals at least 200% of all debt and/or senior stock immediately after each such issuance. However, 2018 legislation modified the 1940 Act by allowing a BDC to increase the maximum amount of leverage it may incur such that a BDC’s asset coverage ratio could be reduced from an asset coverage ratio of 200% to an asset coverage ratio of 150%, if certain requirements are met. We are permitted to increase our leverage capacity if stockholders representing at least a majority of the votes cast, when quorum is met, approve a proposal to do so. If we receive such stockholder approval, we would be permitted to increase our leverage capacity on the first day after such approval. Alternatively, we may increase the maximum amount of leverage we may incur to an asset coverage ratio of 150% if the “required majority” of our independent directors as defined in Section 57(o) of the 1940 Act approve such increase with such approval becoming effective after one year. In either case, because our common stock is not listed on a national securities exchange, we would also be required to offer to repurchase 100% of the shares of our stockholders as of the date of the requisite approval over the following year (25% in each of the following four quarters). We have not requested or obtained either such approval.
In addition, while any senior securities remain outstanding (other than senior securities representing indebtedness issued in consideration of a privately arranged loan which is not intended to be publicly distributed), we must generally include provisions in the documents governing new senior securities to prohibit any cash distribution to our stockholders or the repurchase of such securities or shares unless we meet the applicable asset coverage ratios at the time of the distribution or repurchase. We may also borrow amounts up to 5% of the value of our total assets for temporary or emergency purposes without regard to asset coverage with such borrowings not constituting senior securities for purposes of the asset coverage ratio requirements of the 1940 Act. A loan is presumed to be for temporary purposes if it is repaid within sixty days and not extended or renewed.
Common Stock
We are not generally able to issue and sell our common stock at a price below NAV per share. We may, however, sell our common stock, warrants, options or rights to acquire our common stock, at a price below the current NAV of the common stock if our board of directors determines that such sale is in our best interests and that of our stockholders, and our stockholders approve such sale. In any such case, the price at which our securities are to be issued and sold may not be less than a price which, in the determination of our board of directors, closely approximates the market value of such securities (less any distributing commission or discount). We have never sought such stockholder authorization to sell shares of our common stock below the then current NAV per share of our common stock.
Code of Ethics
We have adopted a code of ethics and Ethics pursuant to Rule 17j-1 under the 1940 Act that establishes procedures for personal investments and restricts certain personal securities transactions. Personnel subject to the code may invest in securities for their personal investment accounts, including securities that may be purchased or held by us, so long as such investments are made in accordance with the code’s requirements. The code of ethics is available on the EDGAR Database on the SEC’s website at http://www.sec.gov.
Proxy Voting Policies and Procedures
We vote proxies relating to our portfolio securities in a manner in which we believe is consistent with the best interest of our stockholders. We review on a case-by-case basis each proposal submitted to a stockholder vote to determine its impact on the portfolio securities held by us. Although we generally vote against proposals that we expect would have a negative impact on our portfolio securities, we may vote for such a proposal if there exists compelling long-term reasons to do so.
Our proxy voting decisions are made by the investment team which is responsible for monitoring each of our investments. To ensure that our vote is not the product of a conflict of interest, we require that anyone involved in the decision-making process discloses to our chief compliance officer any potential conflict regarding a proxy vote of which he or she is aware.
Stockholders may obtain information, without charge, regarding how we voted proxies with respect to our portfolio securities by making a written request for proxy voting information to: Chief Compliance Officer, 1300 Post Oak Boulevard, 8th Floor, Houston, Texas 77056.
Privacy Principles
The Adviser has established policies with respect to nonpublic personal information provided to it with respect to individuals who are investors in the Company. We have adopted the privacy policies of the Adviser as applicable to us.
We and the Adviser each recognizes the importance of maintaining the privacy of any nonpublic personal information it receives with respect to each investor. In the course of providing management services to us, the Adviser collects nonpublic personal information about investors from the Subscription Agreements and the certificates and exhibits thereto that each investor submits. We and the Adviser may also collect nonpublic personal information about each investor from conversations and correspondence between each investor and us or the Adviser, both prior to and during the course of each investor’s investment in the Company.
We and the Adviser each treat all of the nonpublic personal information it receives with respect to each investor as confidential. We and the Adviser restrict access to such information to those employees, affiliates and agents who need to know the information in order for us and the Adviser to determine whether each investor meets the regulatory requirements for an investment in the Company and, in the case of the Adviser, to provide ongoing management services to us. The Adviser maintains physical, electronic, and procedural safeguards to comply with U.S. federal standards to guard each investor’s nonpublic personal information.
The Adviser does not disclose any nonpublic personal information about any investor to any third parties, other than the Adviser’s agents, representatives and/or affiliates, or as permitted or required by law. Among other things, the law permits the Adviser to disclose such information for purposes of making investments on our behalf, complying with anti-money laundering laws, preparing tax returns and reports for each investor and determining whether each investor meets the regulatory requirements for investing in us.
Other 1940 Act Regulations
We are also prohibited under the 1940 Act from knowingly participating in certain transactions with our affiliates without the prior approval of our board of directors who are not interested persons and, in some cases, prior approval by the SEC.
We are required to provide and maintain a bond issued by a reputable fidelity insurance company to protect us against larceny and embezzlement. Furthermore, as a BDC, we are prohibited from protecting any director or officer against any liability to us or our stockholders arising from willful misfeasance, bad faith, gross negligence or reckless disregard of the duties involved in the conduct of such person’s office.
We and our Adviser are required to adopt and implement written policies and procedures reasonably designed to prevent violation of the federal securities laws, review these policies and procedures no less frequently than annually for their adequacy and the effectiveness of their implementation, and to designate a chief compliance officer to be responsible for administering the policies and procedures.
We may be periodically examined by the SEC for compliance with the 1940 Act.
Securities Exchange Act of 1934 and Sarbanes-Oxley Act Compliance
We are subject to the reporting and disclosure requirements of the Exchange Act, including the filing of quarterly, annual and current reports, proxy statements and other required items. In addition, we are subject to the Sarbanes-Oxley Act of 2002, which imposes a wide variety of regulatory requirements on publicly-held companies and their insiders. For example:
•pursuant to Rule 13a-14 of the Exchange Act, our Chief Executive Officer and Chief Financial Officer are required to certify the accuracy of the consolidated financial statements contained in our periodic reports;
•pursuant to Item 307 of Regulation S-K, our periodic reports are required to disclose our conclusions about the effectiveness of our disclosure controls and procedures;
•pursuant to Rule 13a-15 of the Exchange Act, our management is required to prepare a report regarding its assessment of our internal control over financial reporting; and
•pursuant to Item 308 of Regulation S-K and Rule 13a-15 of the Exchange Act, our periodic reports must disclose whether there were significant changes in our internal control over financial reporting or in other factors that could significantly affect these controls subsequent to the date of their evaluation, including any corrective actions with regard to significant deficiencies and material weaknesses.
The Sarbanes-Oxley Act requires us to review our current policies and procedures to determine whether we comply with the Sarbanes-Oxley Act and the regulations promulgated under such act. We will continue to monitor our compliance with all regulations that are adopted under the Sarbanes-Oxley Act and will take actions necessary to ensure that we comply with that act in the future.
Investment Adviser Regulations
Our Adviser is subject to regulation under the Investment Advisers Act of 1940, as amended (the “Advisers Act”). The Advisers Act establishes, among other things, recordkeeping and reporting requirements, disclosure requirements, limitations on transactions between the adviser’s account and an advisory client’s account, limitations on transactions between the accounts of advisory clients, and general anti-fraud prohibitions. Our Adviser may be examined by the SEC from time to time for compliance with the Advisers Act.
UNDERWRITING
Under the terms and subject to the conditions in an underwriting agreement dated the date of this prospectus, the underwriters named below, for whom RBC Capital Markets, LLC and Truist Securities, Inc. are acting as representatives, have severally agreed to purchase, and we have agreed to sell to them, severally, the number of shares indicated below: | | | | | | | | |
Underwriter | | Number of Shares |
RBC Capital Markets, LLC | | 1,045,000 |
Truist Securities, Inc. | | 976,250 |
Raymond James & Associates, Inc. | | 962,500 |
UBS Securities LLC | | 962,500 |
Keefe, Bruyette & Woods, Inc. | | 440,000 |
| Sanders Morris LLC | | 440,000 |
| B. Riley Securities, Inc. | | 275,000 |
| Citizens JMP Securities, LLC | | 275,000 |
| Clear Street LLC | | 41,250 |
| Comerica Securities, Inc. | | 27,500 |
| TCBI Securities, Inc. | | 27,500 |
| Zions Direct, Inc. | | 27,500 |
Total: | | 5,500,000 |
The underwriters and the representatives are collectively referred to as the “underwriters” and the “representatives,” respectively. The underwriters are offering the shares of common stock subject to their acceptance of the shares from us. The underwriting agreement provides that the obligations of the several underwriters to pay for and accept delivery of the shares of common stock offered by this prospectus are subject to the review of certain legal matters by their counsel and to certain other conditions. The underwriters are obligated to take and pay for all of the shares of common stock offered by this prospectus if any such shares are taken. However, the underwriters are not required to take or pay for the shares covered by the underwriters’ over-allotment option to purchase additional shares of common stock described below.
The underwriters initially propose to offer part of the shares of common stock directly to the public at the offering price listed on the cover page of this prospectus and part to certain dealers at a price that represents a concession not in excess of $0.56 per share under the public offering price. After the initial offering of the shares of common stock, the offering price and other selling terms may from time to time be varied by the representatives.
We have granted to the underwriters an option, exercisable for 30 days from the date of this prospectus, to purchase up to 825,000 additional shares of common stock at the public offering price listed on the cover page of this prospectus, less underwriting discounts and commissions. The underwriters may exercise this option solely for the purpose of covering over-allotments, if any, made in connection with the offering of the shares of common stock offered by this prospectus. To the extent the option is exercised, each underwriter will become obligated, subject to certain conditions, to purchase about the same percentage of the additional shares of common stock as the number listed next to the underwriter’s name in the preceding table bears to the total number of shares of common stock listed next to the names of all underwriters in the preceding table.
At the Company’s request, the underwriters have reserved the DSP Reserved Shares (which represent up to 7% of the shares of common stock sold in this offering) for sale at the public offering price per share to certain individuals, including our directors, officers, employees and certain other individuals identified by us, through a directed share program. We will not pay underwriting discounts and commissions on the DSP Reserved Shares sold to such persons. To the extent acquired by a director or executive officer of the Company, the DSP Reserved Shares will be subject to the lock-up agreement with the underwriters described elsewhere in this prospectus. Furthermore, as required by FINRA, DSP Reserved Shares acquired by certain other program participants may also be subject to a lock-up restriction on their ability to transfer or otherwise sell their DSP Reserved Shares. We have agreed to indemnify the underwriters against certain liabilities and expenses, including liabilities under the Securities Act, in connection with the directed share program.
The following table shows the per share and total public offering price, underwriting discounts and commissions, and proceeds before expenses to us. These amounts are shown assuming both no exercise and full exercise of the underwriters’ option to purchase up to an additional 825,000 shares of common stock and assume the sale of all of the Main Street Indicative Commitment Shares and that no shares are sold pursuant to the directed share program described elsewhere in this prospectus.
| | | | | | | | | | | | | | | | | | | | | | | | | | |
| | Total |
| | Per Share | | No Exercise | | Per Share | | Full Exercise |
Public offering price | | $15.53 | | $ | 85,415,000 | | | $15.53 | | $ | 98,227,250 | |
Underwriting discounts and commissions to be paid by us:(1) | | $0.8827 | | $ | 4,854,901 | | | $0.8891 | | $ | 5,623,636 | |
Proceeds, before expenses, to us(1) | | $14.6473 | | $ | 80,560,099 | | | $14.6409 | | $ | 92,603,614 | |
(1) For all shares sold in the offering described in this prospectus, except the Main Street Indicative Commitment Shares to be sold to Main Street or any DSP Reserved Shares sold under the directed share program for this offering, the underwriters will be entitled to receive $0.9318 per share at settlement. As a result, the per share and total sales load figures reflect that the underwriters will not receive any sales load on the Main Street Indicative Commitment Shares to be sold to Main Street.
The estimated offering expenses payable by us, exclusive of the underwriting discounts and commissions, are approximately $2.0 million. We have agreed to reimburse the underwriters up to $15,000 for legal expenses relating to clearance of this offering with FINRA and up to $15,000 for legal expenses relating to the administration of the directed share program.
The underwriters have informed us that they do not intend sales to discretionary accounts to exceed 5.0% of the total number of shares of common stock offered by them.
Our shares have been approved for listing on The New York Stock Exchange under the symbol “MSIF”.
The Company, its directors and officers and the Adviser have agreed that, without the prior written consent of the representatives on behalf of the underwriters, they will not, and will not publicly disclose an intention to, during the period ending 180 days after the date of this prospectus (the “restricted period”), subject to certain customary exceptions:
•offer, pledge, sell, contract to sell, sell any option or contract to purchase, purchase any option or contract to sell, grant any option, right or warrant to purchase, lend or otherwise transfer or dispose of, directly or indirectly, any shares of our common stock or any securities convertible into or exercisable or exchangeable for shares of our common stock;
•file any registration statement with the SEC relating to the offering of any shares of our common stock or any securities convertible into or exercisable or exchangeable for our common stock; or
•engage in any hedging or other transaction or arrangement (including, without limitation, any short sale or the purchase or sale of, or entry into, any put or call option, or combination thereof, forward, swap or any other derivative transaction or instrument, however described or defined) which is designed or intended to, or which reasonably could be expected to lead to or result in, a sale or disposition of our common stock, or any securities convertible into or exercisable or exchangeable for our common stock (whether by the undersigned or someone other than the undersigned), or transfer of any of the economic consequences of ownership, in whole or in part, directly or indirectly, of our common stock or other securities, in cash or otherwise,
whether any such transaction described above is to be settled by delivery of our common stock or such other securities, in cash or otherwise. In addition, each such person agrees that, without the prior written consent of the representatives on behalf of the underwriters, such person will not, during the restricted period, make any demand for, or exercise any right with respect to, the registration of any shares of our common stock or any security convertible into or exercisable or exchangeable for common stock.
For a discussion of the transfer restrictions on shares of our common stock outstanding at the time of this offering, see “Shares Eligible for Future Sale.”
In order to facilitate the offering of the common stock, the underwriters may engage in transactions that stabilize, maintain or otherwise affect the price of the common stock. Specifically, the underwriters may sell more shares than they are obligated to purchase under the underwriting agreement, creating a short position. A short sale is covered if the short position is no greater than the number of shares available for purchase by the underwriters under the over-allotment option. The underwriters can close out a covered short sale by exercising the over-allotment option or purchasing shares in the open market. In determining the source of shares to close out a covered short sale, the underwriters will consider, among other things, the open market price of shares compared to the price available under the over-allotment option. The underwriters may also sell shares in excess of the over-allotment option, creating a naked short position. The underwriters must close out any naked short position by purchasing shares in the open market. A naked short position is more likely to be created if the underwriters are concerned that there may be downward pressure on the price of the common stock in the open market after pricing that could adversely affect investors who purchase in this offering. The underwriters have agreed in this offering to only exercise their over-allotment option to close out their covered short positions, if any. As an additional means of facilitating this offering, the underwriters may bid for, and purchase, shares of common stock in the open market to stabilize the price of the common stock. These activities may raise or maintain the market price of the common stock above independent market levels or prevent or retard a decline in the market price of the common stock. The underwriters are not required to engage in these activities and may end any of these activities at any time.
We and the underwriters have agreed to indemnify each other against certain liabilities, including liabilities under the Securities Act.
A prospectus in electronic format may be made available on websites maintained by one or more underwriters, or selling group members, if any, participating in this offering. The representatives may agree to allocate a number of shares of common stock to underwriters for sale to their online brokerage account holders. Internet distributions will be allocated by the representatives to underwriters that may make Internet distributions on the same basis as other allocations.
Our board of directors has authorized an open-market share repurchase program of up to $65.0 million in the aggregate of shares of our common stock. Pursuant to the program, we may, from time to time, purchase shares of our common stock in the open market, subject to market conditions and other factors, for a 12-month period starting on a date determined by the Company following the consummation of this offering. We will determine the timing and amount of repurchases based on our evaluation of market conditions and other factors. The repurchase program may be suspended or discontinued by us at any time. In connection with such authorization, in connection with or shortly after the closing of this offering, we intend to enter into the Company Rule 10b5-1 Stock Repurchase Plan to facilitate the repurchase of up to the full $65.0 million in shares of common stock authorized under the share repurchase program. The repurchases of shares pursuant to the Company Rule 10b5-1 Stock Repurchase Plan will be implemented in accordance with Rule 10b5-1 and Rule 10b-18 under the Exchange Act. See “Prospectus Summary – Open-Market Share Repurchase Program and Main Street Rule 10b5-1 Stock Purchase Plan.”
In addition, Main Street intends to purchase up to $20.0 million in the aggregate of shares of our common stock in the open market, for a 12-month period starting on a date determined by Main Street following the consummation of this offering, pursuant to the terms of the Main Street Rule 10b5-1 Stock Purchase Plan that Main Street intends to enter in connection with or shortly after the closing of this offering. The purchases of shares pursuant to the Main Street Rule 10b5-1 Stock Purchase Plan will be implemented in accordance with Rule 10b5-1 and Rule 10b-18 under the Exchange Act. See “Prospectus Summary — Open-Market Share Repurchase Program and Main Street Rule 10b5-1 Stock Purchase Plan.”
Conflicts of Interest
The underwriters and their respective affiliates are full service financial institutions engaged in various activities, which may include securities trading, commercial and investment banking, financial advisory, investment management, investment research, principal investment, hedging, financing and brokerage activities. Certain of the underwriters and their respective affiliates have, from time to time, performed, and may in the future perform, various financial advisory, commercial banking and investment banking services for us and our affiliates, for which they received or will receive customary fees and expenses.
In addition, in the ordinary course of their various business activities, the underwriters and their respective affiliates may make or hold a broad array of investments and actively trade debt and equity securities (or related derivative securities) and financial instruments (including bank loans) for their own account and for the accounts of their customers and may at any time hold long and short positions in such securities and instruments. Such investment and securities activities may involve our securities and instruments. The underwriters and their respective affiliates may also make investment recommendations or publish or express independent research views in respect of such securities or instruments and may at any time hold, or recommend to clients that they acquire, long or short positions in such securities and instruments. Furthermore, in the future, affiliates of the underwriters may be lenders under other credit facilities to which we are from time to time party or under credit facilities to funds or entities whose investment adviser is our Adviser or its affiliates.
Affiliates of certain underwriters are lenders under our Credit Facilities. We may use all or a portion of the net proceeds of this offering to repay a portion of the outstanding indebtedness under our Credit Facilities. As a result, certain of the net proceeds from the sale of the common stock in this offering, not including underwriting compensation, may be paid to affiliates of certain underwriters in connection with the repayment of debt owed under our Credit Facilities. Accordingly, certain underwriters and/or their affiliates may receive more than 5% of the net proceeds of this offering, not including underwriting compensation, to the extent such proceeds are used to repay or repurchase outstanding indebtedness under our Credit Facilities.
Pricing of the Offering
Prior to this offering, there has been no public market for our common stock. The public offering price was determined by negotiations between us and the representatives. Among the factors considered in determining the public offering price were our future prospects and those of our industry in general, our financial and operating information in recent periods, including net asset value, and market prices of securities, and certain financial and operating information of companies engaged in activities similar to ours.
Selling Restrictions
Notice to Prospective Investors in Canada
This prospectus constitutes an “exempt offering document” as defined in and for the purposes of applicable Canadian securities laws. No prospectus has been filed with any securities commission or similar regulatory authority in Canada in connection with the offer and sale of the shares. No securities commission or similar regulatory authority in Canada has reviewed or in any way passed upon this prospectus or on the merits of the shares and any representation to the contrary is an offense.
Canadian investors are advised that this prospectus has been prepared in reliance on section 3A.3 of National Instrument 33-105 Underwriting Conflicts (“NI 33-105”). Pursuant to section 3A.3 of NI 33-105, the company and the underwriters in the offering are exempt from the requirement to provide Canadian investors with certain conflicts of interest disclosure pertaining to “connected issuer” and/or “related issuer” relationships as would otherwise be required pursuant to subsection 2.1(1) of NI 33-105.
Resale Restrictions
The offer and sale of the shares in Canada is being made on a private placement basis only and is exempt from the requirement that the Company prepares and files a prospectus under applicable Canadian securities laws. Any resale of Shares by a Canadian investor in this offering must be made in accordance with applicable Canadian securities laws, which may vary depending on the relevant jurisdiction, and which may require resales to be made in accordance with Canadian prospectus requirements, a statutory exemption from the prospectus requirements, in a transaction exempt from the prospectus requirements or otherwise under a discretionary exemption from the prospectus requirements granted by the applicable local Canadian securities regulatory authority. These resale restrictions may under certain circumstances apply to resales of the shares outside of Canada.
Representations of Purchasers
Each Canadian investor who purchases the shares will be deemed to have represented to the Company, the underwriters and to each dealer from whom a purchase confirmation is received, as applicable, that the investor is (i) purchasing as principal, or is deemed to be purchasing as principal in accordance with applicable Canadian securities laws; (ii) an “accredited investor” as such term is defined in section 1.1 of National Instrument 45-106 Prospectus Exemptions or, in Ontario, as such term is defined in section 73.3(1) of the Securities Act (Ontario); and (iii) a “permitted client” as such term is defined in section 1.1 of National Instrument 31103 Registration Requirements, Exemptions and Ongoing Registrant Obligations.
Taxation and Eligibility for Investment
Any discussion of taxation and related matters contained in this prospectus does not purport to be a comprehensive description of all of the tax considerations that may be relevant to a Canadian investor when deciding to purchase the shares and, in particular, does not address any Canadian tax considerations. No representation or warranty is hereby made as to the tax consequences to a resident, or deemed resident, of Canada of an investment in the shares or with respect to the eligibility of the shares for investment by such investor under relevant Canadian federal and provincial legislation and regulations.
Rights of Action for Damages or Rescission
Securities legislation in certain of the Canadian jurisdictions provides certain purchasers of securities pursuant to an offering memorandum (such as this prospectus), including where the distribution involves an “eligible foreign security” as such term is defined in Ontario Securities Commission Rule 45-501 Ontario Prospectus and Registration Exemptions and in Multilateral Instrument 45-107 Listing Representation and Statutory Rights of Action Disclosure Exemptions, as applicable, with a remedy for damages or rescission, or both, in addition to any other rights they may have at law, where the offering memorandum, or other offering document that constitutes an offering memorandum, and any amendment thereto, contains a “misrepresentation” as defined under applicable Canadian securities laws. These remedies, or notice with respect to these remedies, must be exercised or delivered, as the case may be, by the purchaser within the time limits prescribed under, and are subject to limitations and defences under, applicable Canadian securities legislation. In addition, these remedies are in addition to and without derogation from any other right or remedy available at law to the investor.
Language of Documents
Upon receipt of this document, each Canadian investor hereby confirms that it has expressly requested that all documents evidencing or relating in any way to the sale of the securities described herein (including for greater certainty any purchase confirmation or any notice) be drawn up in the English language only. Par la réception de ce document, chaque investisseur canadien confirme par les présentes qu’il a expressément exigé que tous les documents faisant foi ou se rapportant de quelque manière que ce soit à la vente des valeurs mobilières décrites aux présentes (incluant, pour plus de certitude, toute confirmation d’achat ou tout avis) soient rédigés en anglais seulement.
Principal Business Address
The principal business address of RBC Capital Markets, LLC is Brookfield Place, 200 Vesey Street, 8th Floor, New York, New York 10281. The principal business address of Truist Securities, Inc. is 3333 Peachtree Road NE, Atlanta, Georgia 30326.
CUSTODIAN, TRANSFER AND DISTRIBUTION PAYING AGENT AND REGISTRAR
Our securities are held under a custody agreements by Amegy Bank National Association, whose address is 1801 Main Street, Houston, TX 77002, and by U.S. Bank National Association, whose address is 8 Greenway Plaza, Suite 1100, Houston, TX 77046. SS&C GIDS, Inc. acts as our transfer agent, distribution paying agent and registrar. The principal business address of our transfer agent is 6201 15th Avenue, Brooklyn, New York 11219, telephone number: (877) 248-6417.
PORTFOLIO TRANSACTIONS AND BROKERAGE
Since we generally acquire and dispose of our investments in privately negotiated transactions, we infrequently use brokers in the normal course of our business. When necessary, our investment team is primarily responsible for the execution of the publicly traded securities portion of our portfolio transactions and the allocation of brokerage commissions. We do not expect to execute transactions through any particular broker or dealer but will seek to obtain the best net results for us, taking into account such factors as price (including the applicable brokerage commission or dealer spread), size of order, difficulty of execution, and operational facilities of the firm and the firm’s risk and skill in positioning blocks of securities. While we will generally seek reasonably competitive trade execution costs, we will not necessarily pay the lowest spread or commission available. Subject to applicable legal requirements, we may select a broker based partly upon brokerage or research services provided to us. In return for such services, we may pay a higher commission than other brokers would charge if we determine in good faith that such commission is reasonable in relation to the services provided.
We may pay brokerage commissions incurred in connection with open-market purchases of our publicly traded securities from time to time, including pursuant to our DRIP.
LEGAL MATTERS
Certain legal matters in connection with the securities offered hereby will be passed upon for us by Dechert LLP, Washington D.C. Certain legal matters in connection with the offering will be passed upon for the underwriters by Fried, Frank, Harris, Shriver & Jacobson LLP, New York, NY.
INDEPENDENT REGISTERED PUBLIC ACCOUNTING FIRM
The consolidated financial statements, financial highlights and senior securities table of the Company included in this prospectus and elsewhere in the registration statement have been so included in reliance upon the reports of Grant Thornton LLP, an independent registered public accounting firm, upon the authority of said firm as experts in accounting and auditing.
Grant Thornton LLP, located at principal business address 171 N. Clark Street, Chicago, Illinois 60601, serves as the Company’s independent registered public accounting firm, providing audit services.
AVAILABLE INFORMATION
We have filed with the SEC a registration statement on Form N-2, together with all amendments and related exhibits, under the Securities Act, with respect to shares of our common stock offered by this prospectus. The registration statement contains additional information about us and shares of our common stock being offered by this prospectus.
We file with or submit to the SEC annual, quarterly and current reports, proxy statements and other information meeting the informational requirements of the Exchange Act. The SEC maintains an Internet site that contains reports, proxy and information statements and other information filed electronically by us with the SEC, which are available free of charge on the SEC’s website at www.sec.gov. This information is also available free of charge by contacting us at 1300 Post Oak Boulevard, 8th Floor, Houston, Texas 77056 or by telephone at (713) 350-6000 or on our website at www.mscincomefund.com. Information contained on our website is not incorporated by reference into this prospectus and you should not consider that information to be part of this prospectus.
PRIVACY NOTICE
We are committed to protecting your privacy. This privacy notice explains the privacy policies of MSC Income Fund and its affiliated companies. This notice supersedes any other privacy notice you may have received from MSC Income Fund, and its terms apply both to our current stockholders and to former stockholders as well.
We will safeguard, according to strict standards of security and confidentiality, all information we receive about you. The only information we collect from you is your name, address, and number of shares you hold. This information is used only so that we can send you annual reports and other information about us and send you proxy statements or other information required by law.
We do not share this information with any non-affiliated third party except as described below.
•The People and Companies that Make Up MSC Income Fund. It is our policy that only our authorized employees who need to know your personal information will have access to it. Our personnel who violate our privacy policy are subject to disciplinary action.
•Service Providers. We may disclose your personal information to companies that provide services on our behalf, such as record keeping, processing your trades, and mailing you information. These companies are required to protect your information and use it solely for the purpose for which they received it.
•Courts and Government Officials. If required by law, we may disclose your personal information in accordance with a court order or at the request of government regulators. Only that information required by law, subpoena, or court order will be disclosed.
INDEX TO CONSOLIDATED FINANCIAL STATEMENTS
| | | | | |
| Interim Unaudited Financial Statements | Page |
| |
| |
| |
| |
| |
| |
| |
| |
| |
| Audited Financial Statements | |
| |
| |
| |
| |
| |
| |
| |
| |
| |
MSC INCOME FUND, INC.
Consolidated Balance Sheets
(in thousands, except shares and per share amounts)
| | | | | | | | | | | |
| September 30,
2024 | | December 31,
2023 |
| ASSETS | (Unaudited) | | |
| Investments at fair value: | | | |
Control investments (cost: $41,717 and $43,159 as of September 30, 2024 and December 31, 2023, respectively) | $ | 56,833 | | | $ | 53,644 | |
Affiliate investments (cost: $254,666 and $231,378 as of September 30, 2024 and December 31, 2023, respectively) | 315,190 | | | 291,279 | |
Non‑Control/Non‑Affiliate investments (cost: $836,194 and $763,781 as of September 30, 2024 and December 31, 2023, respectively) | 790,604 | | | 747,972 | |
Total investments (cost: $1,132,577 and $1,038,318 as of September 30, 2024 and December 31, 2023, respectively) | 1,162,627 | | | 1,092,895 | |
| Cash and cash equivalents | 48,926 | | | 30,786 | |
| | | |
| Interest and dividend receivable | 11,597 | | | 10,541 | |
| Receivable for securities sold | — | | | 171 | |
Deferred financing costs (net of accumulated amortization of $6,282 and $4,168 as of September 30, 2024 and December 31, 2023, respectively) | 1,327 | | | 3,416 | |
| Prepaids and other assets | 2,805 | | | 2,091 | |
| Total assets | $ | 1,227,282 | | | $ | 1,139,900 | |
| LIABILITIES | | | |
| Credit Facilities | $ | 406,688 | | | $ | 335,688 | |
Series A Notes due 2026 (par: $150,000 as of both September 30, 2024 and December 31, 2023) | 149,379 | | | 149,155 | |
| Accounts payable and other liabilities | 3,609 | | | 255 | |
| Payable for securities purchased | 11,655 | | | 206 | |
| Interest payable | 8,631 | | | 6,266 | |
| Dividend payable | 14,478 | | | 14,019 | |
| Management and incentive fees payable | 7,474 | | | 8,745 | |
| Deferred tax liability, net | 6,883 | | | 3,259 | |
| | | |
| | | |
| Total liabilities | 608,797 | | | 517,593 | |
| Commitments and contingencies (Note I) | | | |
NET ASSETS (1) | | | |
Common stock, $0.001 par value per share (450,000,000 shares authorized; 40,217,446 and 40,054,433 shares issued and outstanding as of September 30, 2024 and December 31, 2023, respectively) | 40 | | 40 |
| Additional paid‑in capital | 689,989 | | | 686,176 |
| | | |
| | | |
| | | |
| Total overdistributed earnings | (71,544) | | | (63,909) | |
| Total net assets | 618,485 | | | 622,307 | |
| Total liabilities and net assets | $ | 1,227,282 | | | $ | 1,139,900 | |
NET ASSET VALUE PER SHARE (1) | $ | 15.38 | | | $ | 15.54 | |
(1)As discussed in Note A.3 - Reverse Stock Split, the Company completed a two-for-one reverse stock split, effective as of December 16, 2024.
The accompanying notes are an integral part of these consolidated financial statements
MSC INCOME FUND, INC.
Consolidated Statements of Operations
(in thousands, except shares and per share amounts)
(Unaudited)
| | | | | | | | | | | | | | | | | | | | | | | |
| Three Months Ended
September 30, | | Nine Months Ended
September 30, |
| 2024 | | 2023 | | 2024 | | 2023 |
| INVESTMENT INCOME: | | | | | | | |
| Interest, fee and dividend income: | | | | | | | |
| Control investments | $ | 818 | | | $ | 804 | | | $ | 2,643 | | | $ | 2,321 | |
| Affiliate investments | 7,719 | | | 6,941 | | | 22,891 | | | 22,241 | |
| Non‑Control/Non‑Affiliate investments | 24,940 | | | 24,606 | | | 75,839 | | | 72,064 | |
| Total investment income | 33,477 | | | 32,351 | | | 101,373 | | | 96,626 | |
| EXPENSES: | | | | | | | |
| Interest | (10,374) | | | (9,403) | | | (29,470) | | | (26,599) | |
| Base management fees | (5,338) | | | (4,994) | | | (15,545) | | | (14,761) | |
| Incentive fees | (2,136) | | | (2,572) | | | (9,364) | | | (8,891) | |
| Internal administrative services expenses | (2,368) | | | (2,168) | | | (7,155) | | | (6,752) | |
| | | | | | | |
| | | | | | | |
| | | | | | | |
| | | | | | | |
| General and administrative | (1,285) | | | (1,106) | | | (3,424) | | | (3,291) | |
| Total expenses before expense waivers | (21,501) | | | (20,243) | | | (64,958) | | | (60,294) | |
| Waiver of internal administrative services expenses | 2,206 | | | 2,014 | | | 6,678 | | | 6,297 | |
| Total expenses, net of expense waivers | (19,295) | | | (18,229) | | | (58,280) | | | (53,997) | |
| NET INVESTMENT INCOME | 14,182 | | | 14,122 | | | 43,093 | | | 42,629 | |
| NET REALIZED GAIN (LOSS): | | | | | | | |
| Control investments | — | | | 546 | | | 57 | | | 2,223 | |
| Affiliate investments | — | | | (2) | | | — | | | (7,188) | |
| Non‑Control/Non‑Affiliate investments | 25,372 | | | (109) | | | 23,745 | | | (20,021) | |
| | | | | | | |
| Total net realized gain (loss) | 25,372 | | | 435 | | | 23,802 | | | (24,986) | |
| NET UNREALIZED APPRECIATION (DEPRECIATION): | | | | | | | |
| Control investments | 912 | | | (735) | | | 4,631 | | | (1,433) | |
| Affiliate investments | 182 | | | 4,780 | | | 1,166 | | | 22,468 | |
| Non‑Control/Non‑Affiliate investments | (30,843) | | | (5,247) | | | (30,453) | | | 9,380 | |
| Total net unrealized appreciation (depreciation) | (29,749) | | | (1,202) | | | (24,656) | | | 30,415 | |
| INCOME TAXES: | | | | | | | |
| Federal and state income, excise and other taxes | (1,649) | | | (431) | | | (2,525) | | | (954) | |
| Deferred taxes | (785) | | | 458 | | | (3,625) | | | (2,235) | |
| Income tax benefit (provision) | (2,434) | | | 27 | | | (6,150) | | | (3,189) | |
| NET INCREASE IN NET ASSETS RESULTING FROM OPERATIONS | $ | 7,371 | | | $ | 13,382 | | | $ | 36,089 | | | $ | 44,869 | |
NET INVESTMENT INCOME PER SHARE—BASIC AND DILUTED (1) | $ | 0.35 | | | $ | 0.35 | | | $ | 1.07 | | | $ | 1.06 | |
NET INCREASE IN NET ASSETS RESULTING FROM OPERATIONS PER SHARE—BASIC AND DILUTED (1) | $ | 0.18 | | | $ | 0.33 | | | $ | 0.90 | | | $ | 1.12 | |
WEIGHTED-AVERAGE SHARES OUTSTANDING—BASIC AND DILUTED (1) | 40,167,985 | | | 40,150,073 | | | 40,154,730 | | | 40,122,979 | |
(1)As discussed in Note A.3 - Reverse Stock Split, the Company completed a two-for-one reverse stock split, effective as of December 16, 2024.
The accompanying notes are an integral part of these consolidated financial statements
MSC INCOME FUND, INC.
Consolidated Statements of Changes in Net Assets
(in thousands, except shares)
(Unaudited)
| | | | | | | | | | | | | | | | | | | | | | | | | | | | | |
| Common Stock (1) | | Additional Paid-In Capital (1) | | Total
Overdistributed
Earnings | | Total Net
Asset Value |
| Number of
Shares | | Par
Value | | | |
| Balances as of December 31, 2022 | 40,053,000 | | $ | 40 | | | $ | 684,205 | | | $ | (74,580) | | | $ | 609,665 | |
| | | | | | | | | |
| Dividend reinvestment | 282,189 | | | 1 | | | 4,413 | | | — | | 4,414 | |
| Common stock repurchased | (259,745) | | | (1) | | | (3,984) | | | — | | (3,985) | |
| Net increase in net assets resulting from operations | — | | — | | — | | 12,231 | | | 12,231 | |
| Dividends to stockholders | — | | — | | — | | (14,026) | | | (14,026) | |
| | | | | | | | | |
| Balances as of March 31, 2023 | 40,075,444 | | $ | 40 | | | $ | 684,634 | | | $ | (76,375) | | | $ | 608,299 | |
| Issuance of common stock | 127,877 | | — | | 2,000 | | — | | 2,000 | |
| Dividend reinvestment | 304,309 | | | 1 | | | 4,759 | | — | | 4,760 | |
| Common stock repurchased | (482,784) | | | (1) | | | (6,522) | | | — | | (6,523) | |
| Net increase in net assets resulting from operations | — | | — | | — | | 19,256 | | 19,256 | |
| Dividends to stockholders | — | | — | | — | | (14,009) | | | (14,009) | |
| | | | | | | | | |
| Balances as of June 30, 2023 | 40,024,846 | | $ | 40 | | | $ | 684,871 | | | $ | (71,128) | | | $ | 613,783 | |
| Issuance of common stock | 174,271 | | | — | | | 2,750 | | | — | | | 2,750 | |
| Dividend reinvestment | 297,147 | | | 1 | | | 4,689 | | | — | | | 4,690 | |
| Common stock repurchased | (489,290) | | | (1) | | | (7,033) | | | — | | | (7,034) | |
| Net increase in net assets resulting from operations | — | | | — | | | — | | | 13,382 | | | 13,382 | |
| Dividends to stockholders | — | | | — | | | — | | | (14,002) | | | (14,002) | |
| | | | | | | | | |
| Balances as of September 30, 2023 | 40,006,974 | | $ | 40 | | | $ | 685,277 | | | $ | (71,748) | | | $ | 613,569 | |
| | | | | | | | | |
| | | | | | | | | |
| | | | | | | | | |
| | | | | | | | | |
| | | | | | | | | |
| | | | | | | | | |
| | | | | | | | | |
| | | | | | | | | |
| Balances as of December 31, 2023 | 40,054,433 | | $ | 40 | | | $ | 686,176 | | | $ | (63,909) | | | $ | 622,307 | |
| Issuance of common stock | 157,034 | | — | | | 2,500 | | | — | | | 2,500 | |
| Dividend reinvestment | 282,485 | | 1 | | | 4,492 | | | — | | | 4,493 | |
| Common stock repurchased | (437,658) | | (1) | | | (6,546) | | | — | | | (6,547) | |
| Net increase in net assets resulting from operations | — | | — | | | — | | | 10,589 | | | 10,589 | |
| Dividends to stockholders | — | | — | | | — | | | (14,821) | | | (14,821) | |
| | | | | | | | | |
| Balances as of March 31, 2024 | 40,056,294 | | $ | 40 | | | $ | 686,622 | | | $ | (68,141) | | | $ | 618,521 | |
| Issuance of common stock | 157,629 | | — | | | 2,500 | | | — | | | 2,500 | |
| Dividend reinvestment | 291,938 | | 1 | | | 4,631 | | | — | | | 4,632 | |
| Common stock repurchased | (435,190) | | (1) | | | (6,181) | | | — | | | (6,182) | |
| Net increase in net assets resulting from operations | — | | — | | | — | | | 18,129 | | | 18,129 | |
| Dividends to stockholders | — | | — | | | — | | | (14,425) | | | (14,425) | |
| | | | | | | | | |
| Balances as of June 30, 2024 | 40,070,671 | | $ | 40 | | | $ | 687,572 | | | $ | (64,437) | | | $ | 623,175 | |
| Issuance of common stock | 125,313 | | — | | | 2,000 | | | — | | | 2,000 | |
| Dividend reinvestment | 278,960 | | 1 | | | 4,452 | | | — | | | 4,453 | |
| Common stock repurchased | (257,499) | | (1) | | | (4,035) | | | — | | | (4,036) | |
| Net increase in net assets resulting from operations | — | | — | | | — | | | 7,371 | | | 7,371 | |
| Dividends to stockholders | — | | — | | | — | | | (14,478) | | | (14,478) | |
| | | | | | | | | |
| Balances as of September 30, 2024 | 40,217,446 | | $ | 40 | | | $ | 689,989 | | | $ | (71,544) | | | $ | 618,485 | |
(1)As discussed in Note A.3 - Reverse Stock Split, the Company completed a two-for-one reverse stock split, effective as of December 16, 2024.
The accompanying notes are an integral part of these consolidated financial statements
MSC INCOME FUND, INC.
Consolidated Statements of Cash Flows
(in thousands)
(Unaudited)
| | | | | | | | | | | |
| Nine Months Ended
September 30, |
| 2024 | | 2023 |
| CASH FLOWS FROM OPERATING ACTIVITIES | | | |
| Net increase in net assets resulting from operations | $ | 36,089 | | | $ | 44,869 | |
| Adjustments to reconcile net increase in net assets resulting from operations to net cash provided by (used in) operating activities: | | | |
| | | |
| Investments in portfolio companies | (253,889) | | | (156,523) | |
| Proceeds from sales and repayments of debt investments in portfolio companies | 169,961 | | | 119,927 | |
| Proceeds from sales and return of capital of equity investments in portfolio companies | 39,496 | | | 13,280 | |
| Net unrealized (appreciation) depreciation | 24,656 | | | (30,415) | |
| Net realized (gain) loss on portfolio investments | (23,802) | | | 24,986 | |
| | | |
| Amortization of deferred financing costs | 2,338 | | | 1,273 | |
| Amortization of deferred offering costs | — | | | 129 | |
| Accretion of unearned income | (5,740) | | | (5,772) | |
| Payment-in-kind interest | (5,100) | | | (3,805) | |
| Cumulative dividends | (101) | | | (129) | |
| Deferred tax provision | 3,625 | | | 2,235 | |
| Changes in other assets and liabilities: | | | |
| Interest and dividend receivable | (4,650) | | | (2,307) | |
| | | |
| Prepaid and other assets | (714) | | | (1,982) | |
| | | |
| Management and incentive fees payable | (1,271) | | | 524 | |
| | | |
| | | |
| Interest payable | 2,365 | | | 3,231 | |
| Accounts payable and other liabilities | 3,354 | | | (552) | |
| Net cash provided by (used in) operating activities | (13,383) | | | 8,969 | |
| CASH FLOWS FROM FINANCING ACTIVITIES | | | |
| Issuance of common stock | 7,000 | | | 4,750 | |
| Redemption of common stock | (16,765) | | | (17,542) | |
| Payment of offering costs | — | | | (129) | |
| Dividends paid | (29,686) | | | (26,990) | |
| Proceeds from Credit Facilities | 252,000 | | | 107,000 | |
| Repayments on Credit Facilities | (181,000) | | | (72,000) | |
| | | |
| | | |
| | | |
| Payment of deferred financing costs | (26) | | | (2,262) | |
| Net cash provided by (used in) financing activities | 31,523 | | | (7,173) | |
| Net increase in cash and cash equivalents | 18,140 | | | 1,796 | |
| CASH AND CASH EQUIVALENTS AT BEGINNING OF PERIOD | 30,786 | | | 21,312 | |
| CASH AND CASH EQUIVALENTS AT END OF PERIOD | $ | 48,926 | | | $ | 23,108 | |
| | | |
| | | |
| | | |
| | | |
| Supplemental cash flow disclosures: | | | |
| Interest paid | $ | 24,766 | | | $ | 22,106 | |
| Taxes paid | $ | 489 | | | $ | 1,960 | |
| Non-cash financing activities: | | | |
| Dividends declared and unpaid | $ | 14,478 | | | $ | 14,002 | |
| Value of shares issued pursuant to the DRIP | $ | 13,578 | | | $ | 13,864 | |
The accompanying notes are an integral part of these consolidated financial statements
MSC INCOME FUND, INC.
Consolidated Schedule of Investments
September 30, 2024
(dollars in thousands)
(Unaudited)
| | | | | | | | | | | | | | | | | | | | | | | | | | | | | | | | | | | | | | | | | | | | |
| Portfolio Company (1) (20) | | Business Description | Type of Investment (2) (3) (15) | | Investment Date (22) | Shares/Units | Total Rate | Reference Rate and Spread (25) | PIK Rate (19) | Maturity Date | Principal (4) | Cost (4) | Fair Value (18) |
| Control Investments (5) | | | | | | | | | | | | | | |
| Copper Trail Fund Investments | (12) (13) | Investment Partnership | | | | | | | | | | | | |
| | | LP Interests (CTMH, LP) | (24) | 7/17/2017 | 39.0% | | | | | | | $ | 655 | | $ | 530 | |
| | | | | | | | | | | | | | |
| GRT Rubber Technologies LLC | | Manufacturer of Engineered Rubber Products | | | | | | | | | | | | |
| | | Secured Debt | | 12/21/2018 | | 11.35% | SF+ | 6.00% | | 10/29/2026 | 1,550 | | 1,536 | | 1,550 | |
| | | Secured Debt | | 12/19/2014 | | 13.35% | SF+ | 8.00% | | 10/29/2026 | 19,944 | | 19,841 | | 19,944 | |
| | | Member Units | (8) | 12/19/2014 | 2,896 | | | | | | | 6,435 | | 21,890 | |
| | | | | | | | | | | | | 27,812 | | 43,384 | |
| Harris Preston Fund Investments | (12) (13) | Investment Partnership | | | | | | | | | | | | |
| | | LP Interests (2717 MH, L.P.) | (8) (24) | 10/1/2017 | 49.0% | | | | | | | 3,345 | | 8,819 | |
| | | | | | | | | | | | | | |
| Volusion, LLC | | Provider of Online Software-as-a-Service eCommerce Solutions | | | | | | | | | | | | |
| | | Secured Debt | | 3/31/2023 | | 10.00% | | | | 3/31/2025 | 900 | | 900 | | 900 | |
| | | Preferred Member Units | | 3/31/2023 | 2,184,683 | | | | | | | 1,901 | | 3,200 | |
| | | Preferred Member Units | | 3/31/2023 | 61,077 | | | | | | | — | | — | |
| | | Preferred Member Units | | 1/26/2015 | 2,090,001 | | | | | | | 6,000 | | — | |
| | | Common Stock | | 3/31/2023 | 772,620 | | | | | | | 1,104 | | — | |
| | | | | | | | | | | | | 9,905 | | 4,100 | |
Subtotal Control Investments (9.2% of net assets at fair value) | | | | | | | | | | | | | $ | 41,717 | | $ | 56,833 | |
| Affiliate Investments (6) | | | | | | | | | | | | | | |
| Analytical Systems Keco Holdings, LLC | | Manufacturer of Liquid and Gas Analyzers | | | | | | | | | | | | |
| | | Secured Debt | (30) | 8/16/2019 | | | | | | 8/16/2029 | $ | — | | $ | — | | $ | — | |
| | | Secured Debt | | 8/16/2019 | | 13.75% | | | | 8/16/2029 | 1,036 | | 1,024 | | 1,024 | |
| | | Preferred Member Units | | 5/20/2021 | 607 | | | | | | | 607 | | 1,430 | |
| | | Preferred Member Units | | 8/16/2019 | 800 | | | | | | | 800 | | — | |
| | | Warrants | (27) | 8/16/2019 | 105 | | | | | 8/16/2029 | | 79 | | — | |
| | | | | | | | | | | | | 2,510 | | 2,454 | |
| Barfly Ventures, LLC | (10) | Casual Restaurant Group | | | | | | | | | | | | |
| | | Member Units | | 10/26/2020 | 12 | | | | | | | 528 | | 1,787 | |
| | | | | | | | | | | | | | |
| Batjer TopCo, LLC | | HVAC Mechanical Contractor | | | | | | | | | | | | |
| | | Secured Debt | | 3/7/2022 | | 10.00% | | | | 3/7/2027 | 50 | | 49 | | 49 | |
| | | Secured Debt | | 3/7/2022 | | 10.00% | | | | 3/7/2027 | 30 | | 30 | | 30 | |
| | | Secured Debt | | 3/7/2022 | | 10.00% | | | | 3/7/2027 | 1,175 | | 1,164 | | 1,164 | |
| | | Preferred Stock | (8) | 3/7/2022 | 453 | | | | | | | 455 | | 570 | |
MSC INCOME FUND, INC.
Consolidated Schedule of Investments (Continued)
September 30, 2024
(dollars in thousands)
(Unaudited)
| | | | | | | | | | | | | | | | | | | | | | | | | | | | | | | | | | | | | | | | | | | | |
| Portfolio Company (1) (20) | | Business Description | Type of Investment (2) (3) (15) | | Investment Date (22) | Shares/Units | Total Rate | Reference Rate and Spread (25) | PIK Rate (19) | Maturity Date | Principal (4) | Cost (4) | Fair Value (18) |
| | | | | | | | | | | | | 1,698 | | 1,813 | |
| Brewer Crane Holdings, LLC | | Provider of Crane Rental and Operating Services | | | | | | | | | | | | |
| | | Secured Debt | (9) | 1/9/2018 | | 15.35% | SF+ | 10.00% | | 1/9/2025 | 1,285 | | 1,285 | | 1,285 | |
| | | Preferred Member Units | (8) | 1/9/2018 | 737 | | | | | | | 1,070 | | 1,360 | |
| | | | | | | | | | | | | 2,355 | | 2,645 | |
| Centre Technologies Holdings, LLC | | Provider of IT Hardware Services and Software Solutions | | | | | | | | | | | | |
| | | Secured Debt | (9) (30) | 1/4/2019 | | | SF+ | 10.00% | | 1/4/2028 | — | | — | | — | |
| | | Secured Debt | (9) | 1/4/2019 | | 15.35% | SF+ | 10.00% | | 1/4/2028 | 5,116 | | 5,062 | | 5,116 | |
| | | Preferred Member Units | | 1/4/2019 | 3,327 | | | | | | | 1,531 | | 2,990 | |
| | | | | | | | | | | | | 6,593 | | 8,106 | |
| Chamberlin Holding LLC | | Roofing and Waterproofing Specialty Contractor | | | | | | | | | | | | |
| | | Secured Debt | (9) (30) | 2/26/2018 | | | SF+ | 6.00% | | 2/26/2026 | — | | (32) | | — | |
| | | Secured Debt | (9) | 2/26/2018 | | 13.36% | SF+ | 8.00% | | 2/26/2026 | 3,905 | | 3,904 | | 3,905 | |
| | | Member Units | (8) | 2/26/2018 | 1,087 | | | | | | | 2,860 | | 7,630 | |
| | | Member Units | (8) (23) | 11/2/2018 | 261,786 | | | | | | | 443 | | 805 | |
| | | | | | | | | | | | | 7,175 | | 12,340 | |
| Charps, LLC | | Pipeline Maintenance and Construction | | | | | | | | | | | | |
| | | Preferred Member Units | (8) | 2/3/2017 | 457 | | | | | | | 491 | | 3,900 | |
| | | | | | | | | | | | | | |
| Clad-Rex Steel, LLC | | Specialty Manufacturer of Vinyl-Clad Metal | | | | | | | | | | | | |
| | | Secured Debt | (30) | 10/28/2022 | | | | | | 1/15/2027 | — | | — | | — | |
| | | Secured Debt | | 12/20/2016 | | 10.00% | | | | 1/15/2027 | 1,790 | | 1,783 | | 1,783 | |
| | | Secured Debt | | 12/20/2016 | | 10.00% | | | | 12/20/2036 | 246 | | 244 | | 244 | |
| | | Member Units | (8) | 12/20/2016 | 179 | | | | | | | 1,820 | | 2,210 | |
| | | Member Units | (23) | 12/20/2016 | 200 | | | | | | | 127 | | 237 | |
| | | | | | | | | | | | | 3,974 | | 4,474 | |
| Cody Pools, Inc. | | Designer of Residential and Commercial Pools | | | | | | | | | | | | |
| | | Secured Debt | (30) | 3/6/2020 | | | | | | 12/17/2026 | — | | (3) | | — | |
| | | Secured Debt | | 3/6/2020 | | 12.50% | | | | 12/17/2026 | 6,712 | | 6,698 | | 6,712 | |
| | | Preferred Member Units | (8) (23) | 3/6/2020 | 147 | | | | | | | 2,079 | | 17,490 | |
| | | | | | | | | | | | | 8,774 | | 24,202 | |
| Colonial Electric Company LLC | | Provider of Electrical Contracting Services | | | | | | | | | | | | |
| | | Secured Debt | (30) | 3/31/2021 | | | | | | 3/31/2026 | — | | — | | — | |
| | | Secured Debt | | 3/31/2021 | | 12.00% | | | | 3/31/2026 | 4,056 | | 4,025 | | 4,056 | |
| | | Preferred Member Units | (8) | 3/31/2021 | 4,320 | | | | | | | 1,920 | | 3,280 | |
| | | | | | | | | | | | | 5,945 | | 7,336 | |
MSC INCOME FUND, INC.
Consolidated Schedule of Investments (Continued)
September 30, 2024
(dollars in thousands)
(Unaudited)
| | | | | | | | | | | | | | | | | | | | | | | | | | | | | | | | | | | | | | | | | | | | |
| Portfolio Company (1) (20) | | Business Description | Type of Investment (2) (3) (15) | | Investment Date (22) | Shares/Units | Total Rate | Reference Rate and Spread (25) | PIK Rate (19) | Maturity Date | Principal (4) | Cost (4) | Fair Value (18) |
| Compass Systems & Sales, LLC | | Designer of End-to-End Material Handling Solutions | | | | | | | | | | | | |
| | | Secured Debt | (30) | 11/22/2023 | | | | | | 11/22/2028 | — | | (17) | | (17) | |
| | | Secured Debt | | 11/22/2023 | | 13.50% | | | | 11/22/2028 | 4,300 | | 4,194 | | 4,194 | |
| | | Preferred Equity | | 11/22/2023 | 1,863 | | | | | | | 1,863 | | 1,980 | |
| | | | | | | | | | | | | 6,040 | | 6,157 | |
| Datacom, LLC | | Technology and Telecommunications Provider | | | | | | | | | | | | |
| | | Secured Debt | | 3/1/2022 | | 7.50% | | | | 12/31/2025 | 40 | | 39 | | 39 | |
| | | Secured Debt | | 3/31/2021 | | 10.00% | | | | 12/31/2025 | 906 | | 881 | | 845 | |
| | | Preferred Member Units | | 3/31/2021 | 1,000 | | | | | | | 290 | | 40 | |
| | | | | | | | | | | | | 1,210 | | 924 | |
| Digital Products Holdings LLC | | Designer and Distributor of Consumer Electronics | | | | | | | | | | | | |
| | | Secured Debt | (9) | 4/1/2018 | | 15.25% | SF+ | 10.00% | | 4/27/2026 | 3,237 | | 3,220 | | 3,203 | |
| | | Preferred Member Units | (8) | 4/1/2018 | 964 | | | | | | | 2,375 | | 2,459 | |
| | | | | | | | | | | | | 5,595 | | 5,662 | |
| Direct Marketing Solutions, Inc. | | Provider of Omni-Channel Direct Marketing Services | | | | | | | | | | | | |
| | | Secured Debt | (30) | 2/13/2018 | | | | | | 2/13/2026 | — | | (2) | | — | |
| | | Secured Debt | | 12/27/2022 | | 14.00% | | | | 2/13/2026 | 4,751 | | 4,735 | | 4,751 | |
| | | Preferred Stock | | 2/13/2018 | 2,100 | | | | | | | 2,100 | | 4,820 | |
| | | | | | | | | | | | | 6,833 | | 9,571 | |
| Flame King Holdings, LLC | | Propane Tank and Accessories Distributor | | | | | | | | | | | | |
| | | Preferred Equity | (8) | 10/29/2021 | 2,340 | | | | | | | 2,600 | | 8,940 | |
| | | | | | | | | | | | | | |
| Freeport Financial Funds | (12) (13) | Investment Partnership | | | | | | | | | | | | |
| | | LP Interests (Freeport First Lien Loan Fund III LP) | (8) (24) | 7/31/2015 | 6.0% | | | | | | | 2,155 | | 1,893 | |
| | | | | | | | | | | | | | |
| Gamber-Johnson Holdings, LLC | | Manufacturer of Ruggedized Computer Mounting Systems | | | | | | | | | | | | |
| | | Secured Debt | (9) (29) (30) | 6/24/2016 | | | SF+ | 7.00% | | 1/1/2028 | — | | — | | — | |
| | | Secured Debt | (9) (29) | 12/15/2022 | | 10.00% | SF+ | 7.00% | | 1/1/2028 | 12,120 | | 11,986 | | 12,120 | |
| | | Member Units | (8) | 6/24/2016 | 2,261 | | | | | | | 4,423 | | 26,840 | |
| | | | | | | | | | | | | 16,409 | | 38,960 | |
| GFG Group, LLC | | Grower and Distributor of a Variety of Plants and Products to Other Wholesalers, Retailers and Garden Centers | | | | | | | | | | | | |
| | | Secured Debt | | 3/31/2021 | | 8.00% | | | | 3/31/2026 | 2,046 | | 2,027 | | 2,046 | |
MSC INCOME FUND, INC.
Consolidated Schedule of Investments (Continued)
September 30, 2024
(dollars in thousands)
(Unaudited)
| | | | | | | | | | | | | | | | | | | | | | | | | | | | | | | | | | | | | | | | | | | | |
| Portfolio Company (1) (20) | | Business Description | Type of Investment (2) (3) (15) | | Investment Date (22) | Shares/Units | Total Rate | Reference Rate and Spread (25) | PIK Rate (19) | Maturity Date | Principal (4) | Cost (4) | Fair Value (18) |
| | | Preferred Member Units | (8) | 3/31/2021 | 56 | | | | | | | 1,225 | | 2,640 | |
| | | | | | | | | | | | | 3,252 | | 4,686 | |
| Gulf Publishing Holdings, LLC | | Energy Industry Focused Media and Publishing | | | | | | | | | | | | |
| | | Secured Debt | (9) (14) (30) | 9/29/2017 | | | SF+ | 9.50% | | 7/1/2027 | — | | — | | — | |
| | | Secured Debt | (14) | 7/1/2022 | | 12.50% | | | 12.50% | 7/1/2027 | 600 | | 600 | | 351 | |
| | | Preferred Equity | | 7/1/2022 | 15,930 | | | | | | | 1,400 | | — | |
| | | Member Units | | 4/29/2016 | 920 | | | | | | | 920 | | — | |
| | | | | | | | | | | | | 2,920 | | 351 | |
| Harris Preston Fund Investments | (12) (13) | Investment Partnership | | | | | | | | | | | | |
| | | LP Interests (HPEP 3, L.P.) | (8) (24) | 8/9/2017 | 8.0% | | | | | | | 2,296 | | 4,472 | |
| | | | | | | | | | | | | | |
| IG Investor, LLC | | Military and Other Tactical Gear | | | | | | | | | | | | |
| | | Secured Debt | | 6/21/2023 | | 13.00% | | | | 6/21/2028 | 400 | | 378 | | 378 | |
| | | Secured Debt | | 6/21/2023 | | 13.00% | | | | 6/21/2028 | 8,986 | | 8,787 | | 8,787 | |
| | | Common Equity | | 6/21/2023 | 3,600 | | | | | | | 3,600 | | 3,720 | |
| | | | | | | | | | | | | 12,765 | | 12,885 | |
| Independent Pet Partners Intermediate Holdings, LLC | (10) | Omnichannel Retailer of Specialty Pet Products | | | | | | | | | | | | |
| | | Common Equity | | 4/7/2023 | 6,436,566 | | | | | | | 6,540 | | 7,290 | |
| | | | | | | | | | | | | | |
| Integral Energy Services | (10) | Nuclear Power Staffing Services | | | | | | | | | | | | |
| | | Secured Debt | (9) | 8/20/2021 | | 13.09% | SF+ | 7.50% | | 8/20/2026 | 15,090 | | 14,971 | | 14,739 | |
| | | Preferred Equity | (8) | 12/7/2023 | 3,725 | 10.00% | | | 10.00% | | | 290 | | 527 | |
| | | Common Stock | | 8/20/2021 | 11,647 | | | | | | | 1,584 | | 640 | |
| | | | | | | | | | | | | 16,845 | | 15,906 | |
| Kickhaefer Manufacturing Company, LLC | | Precision Metal Parts Manufacturing | | | | | | | | | | | | |
| | | Secured Debt | | 10/31/2018 | | 12.00% | | | | 10/31/2026 | 4,150 | | 4,139 | | 4,139 | |
| | | Secured Debt | | 10/31/2018 | | 9.00% | | | | 10/31/2048 | 993 | | 984 | | 984 | |
| | | Preferred Equity | | 10/31/2018 | 145 | | | | | | | 3,060 | | 3,060 | |
| | | Member Units | (8) (23) | 10/31/2018 | 200 | | | | | | | 248 | | 623 | |
| | | | | | | | | | | | | 8,431 | | 8,806 | |
| MH Corbin Holding LLC | | Manufacturer and Distributor of Traffic Safety Products | | | | | | | | | | | | |
| | | Secured Debt | | 8/31/2015 | | 14.00% | | | | 12/31/2025 | 1,310 | | 1,310 | | 345 | |
| | | Preferred Member Units | | 3/15/2019 | 16,500 | | | | | | | 1,100 | | — | |
| | | Preferred Member Units | | 9/1/2015 | 1,000 | | | | | | | 1,500 | | — | |
MSC INCOME FUND, INC.
Consolidated Schedule of Investments (Continued)
September 30, 2024
(dollars in thousands)
(Unaudited)
| | | | | | | | | | | | | | | | | | | | | | | | | | | | | | | | | | | | | | | | | | | | |
| Portfolio Company (1) (20) | | Business Description | Type of Investment (2) (3) (15) | | Investment Date (22) | Shares/Units | Total Rate | Reference Rate and Spread (25) | PIK Rate (19) | Maturity Date | Principal (4) | Cost (4) | Fair Value (18) |
| | | | | | | | | | | | | 3,910 | | 345 | |
| Mystic Logistics Holdings, LLC | | Logistics and Distribution Services Provider for Large Volume Mailers | | | | | | | | | | | | |
| | | Secured Debt | (30) | 8/18/2014 | | | | | | 1/31/2027 | — | | — | | — | |
| | | Secured Debt | | 8/18/2014 | | 10.00% | | | | 1/31/2027 | 1,436 | | 1,432 | | 1,436 | |
| | | Common Stock | (8) | 8/18/2014 | 1,468 | | | | | | | 680 | | 6,530 | |
| | | | | | | | | | | | | 2,112 | | 7,966 | |
| Nello Industries Investco, LLC | | Manufacturer of Steel Poles and Towers For Critical Infrastructure | | | | | | | | | | | | |
| | | Secured Debt | (9) | 6/4/2024 | | 11.75% | SF+ | 6.50% | | 6/4/2025 | | 3,588 | | 3,588 | |
| | | Secured Debt | | 6/4/2024 | | 13.50% | | | | 6/4/2029 | | 6,609 | | 6,609 | |
| | | Common Equity | (8) | 6/4/2024 | 91 | | | | | | | 3,030 | | 3,030 | |
| | | | | | | | | | | | | 13,227 | | 13,227 | |
| NexRev LLC | | Provider of Energy Efficiency Products & Services | | | | | | | | | | | | |
| | | Secured Debt | | 2/28/2018 | | 10.00% | | | | 2/28/2025 | 490 | | 490 | | 490 | |
| | | Secured Debt | | 2/28/2018 | | 10.00% | | | | 2/28/2025 | 2,453 | | 2,446 | | 2,453 | |
| | | Preferred Member Units | (8) | 2/28/2018 | 25,786,046 | | | | | | | 2,053 | | 2,460 | |
| | | | | | | | | | | | | 4,989 | | 5,403 | |
| NuStep, LLC | | Designer, Manufacturer and Distributor of Fitness Equipment | | | | | | | | | | | | |
| | | Secured Debt | (9) | 1/31/2017 | | 11.85% | SF+ | 6.50% | | 1/31/2025 | 900 | | 900 | | 900 | |
| | | Secured Debt | | 1/31/2017 | | 12.00% | | | | 1/31/2025 | 4,610 | | 4,609 | | 4,609 | |
| | | Preferred Member Units | | 11/2/2022 | 576 | | | | | | | 645 | | 1,440 | |
| | | Preferred Member Units | | 1/31/2017 | 114 | | | | | | | 2,808 | | 2,660 | |
| | | | | | | | | | | | | 8,962 | | 9,609 | |
| Oneliance, LLC | | Construction Cleaning Company | | | | | | | | | | | | |
| | | Preferred Stock | | 8/6/2021 | 282 | | | | | | | 282 | | 550 | |
| | | | | | | | | | | | | | |
| Orttech Holdings, LLC | | Distributor of Industrial Clutches, Brakes and Other Components | | | | | | | | | | | | |
| | | Secured Debt | (9) (30) | 7/30/2021 | | | SF+ | 11.00% | | 7/31/2026 | — | | (1) | | — | |
| | | Secured Debt | (9) | 7/30/2021 | | 16.35% | SF+ | 11.00% | | 7/31/2026 | 5,490 | | 5,449 | | 5,490 | |
| | | Preferred Stock | (8) (23) | 7/30/2021 | 2,500 | | | | | | | 2,500 | | 3,670 | |
| | | | | | | | | | | | | 7,948 | | 9,160 | |
| Pinnacle TopCo, LLC | | Manufacturer and Distributor of Garbage Can Liners, Poly Bags, Produce Bags, and Other Similar Products | | | | | | | | | | | | |
| | | Secured Debt | (30) | 12/21/2023 | | | | | | 12/31/2028 | — | | (8) | | — | |
| | | Secured Debt | | 12/21/2023 | | 13.00% | | | | 12/31/2028 | 7,260 | | 7,108 | | 7,260 | |
MSC INCOME FUND, INC.
Consolidated Schedule of Investments (Continued)
September 30, 2024
(dollars in thousands)
(Unaudited)
| | | | | | | | | | | | | | | | | | | | | | | | | | | | | | | | | | | | | | | | | | | | |
| Portfolio Company (1) (20) | | Business Description | Type of Investment (2) (3) (15) | | Investment Date (22) | Shares/Units | Total Rate | Reference Rate and Spread (25) | PIK Rate (19) | Maturity Date | Principal (4) | Cost (4) | Fair Value (18) |
| | | Preferred Equity | (8) | 12/21/2023 | 110 | | | | | | | 3,135 | | 4,340 | |
| | | | | | | | | | | | | 10,235 | | 11,600 | |
| RA Outdoors LLC | (10) | Software Solutions Provider for Outdoor Activity Management | | | | | | | | | | | | |
| | | Secured Debt | (9) | 4/8/2021 | | 11.59% | SF+ | 6.75% | 11.59% | 4/8/2026 | 1,313 | | 1,308 | | 1,190 | |
| | | Secured Debt | (9) | 4/8/2021 | | 11.59% | SF+ | 6.75% | 11.59% | 4/8/2026 | 13,731 | | 13,672 | | 12,441 | |
| | | Common Equity | | 8/12/2024 | 15,036 | | | | | 4/8/2026 | | — | | — | |
| | | | | | | | | | | | | 14,980 | | 13,631 | |
| Robbins Bros. Jewelry, Inc. | | Bridal Jewelry Retailer | | | | | | | | | | | | |
| | | Secured Debt | (14) (30) | 12/15/2021 | | | | | 10.00% | 12/15/2026 | — | | (5) | | (5) | |
| | | Secured Debt | (14) | 12/15/2021 | | 12.50% | | | 10.00% | 12/15/2026 | 3,740 | | 3,699 | | 1,713 | |
| | | Preferred Equity | | 12/15/2021 | 1,230 | | | | | | | 1,230 | | — | |
| | | | | | | | | | | | | 4,924 | | 1,708 | |
| SI East, LLC | | Rigid Industrial Packaging Manufacturing | | | | | | | | | | | | |
| | | Secured Debt | | 8/31/2018 | | 11.75% | | | | 6/16/2028 | 750 | | 744 | | 750 | |
| | | Secured Debt | (33) | 6/16/2023 | | 12.63% | | | | 6/16/2028 | 22,554 | | 22,531 | | 22,554 | |
| | | Preferred Member Units | (8) | 8/31/2018 | 55 | | | | | | | 508 | | 5,390 | |
| | | | | | | | | | | | | 23,783 | | 28,694 | |
| Student Resource Center, LLC | (10) | Higher Education Services | | | | | | | | | | | | |
| | | Secured Debt | | 9/11/2024 | | 8.50% | | | 8.50% | 12/31/2027 | 223 | | 223 | | 223 | |
| | | Secured Debt | (14) | 12/31/2022 | | 8.50% | | | 8.50% | 12/31/2027 | 5,918 | | 5,425 | | 1,826 | |
| | | Preferred Equity | | 12/31/2022 | 6,564,055 | | | | | | | — | | — | |
| | | | | | | | | | | | | 5,648 | | 2,049 | |
| Tedder Industries, LLC | | Manufacturer of Firearm Holsters and Accessories | | | | | | | | | | | | |
| | | Secured Debt | (14) (17) | 8/31/2018 | | 12.00% | | | 12.00% | 8/31/2023 | 460 | | 460 | | 432 | |
| | | Secured Debt | (14) (17) | 8/31/2018 | | 12.00% | | | 12.00% | 8/31/2023 | 3,800 | | 3,800 | | 1,164 | |
| | | Preferred Member Units | | 8/28/2023 | 1,651 | | | | | | | 165 | | — | |
| | | Preferred Member Units | | 2/1/2023 | 1,411 | | | | | | | 141 | | — | |
| | | Preferred Member Units | | 8/31/2018 | 136 | | | | | | | 2,311 | | — | |
| | | | | | | | | | | | | 6,877 | | 1,596 | |
| Trantech Radiator Topco, LLC | | Transformer Cooling Products and Services | | | | | | | | | | | | |
| | | Secured Debt | (30) | 5/31/2019 | | | | | | 5/31/2027 | — | | (1) | | — | |
| | | Secured Debt | | 5/31/2019 | | 13.50% | | | | 5/31/2027 | 1,980 | | 1,960 | | 1,980 | |
| | | Common Stock | (8) | 5/31/2019 | 154 | | | | | | | 1,164 | | 2,380 | |
| | | | | | | | | | | | | 3,123 | | 4,360 | |
| VVS Holdco LLC | | Omnichannel Retailer of Animal Health Products | | | | | | | | | | | | |
| | | Secured Debt | (9) (30) | 12/1/2021 | | | SF+ | 6.00% | | 12/1/2024 | — | | — | | — | |
MSC INCOME FUND, INC.
Consolidated Schedule of Investments (Continued)
September 30, 2024
(dollars in thousands)
(Unaudited)
| | | | | | | | | | | | | | | | | | | | | | | | | | | | | | | | | | | | | | | | | | | | |
| Portfolio Company (1) (20) | | Business Description | Type of Investment (2) (3) (15) | | Investment Date (22) | Shares/Units | Total Rate | Reference Rate and Spread (25) | PIK Rate (19) | Maturity Date | Principal (4) | Cost (4) | Fair Value (18) |
| | | Secured Debt | | 12/1/2021 | | 11.50% | | | | 12/1/2026 | 6,760 | | 6,672 | | 6,672 | |
| | | Preferred Equity | (8) (23) | 12/1/2021 | 3,060 | | | | | | | 3,060 | | 3,060 | |
| | | | | | | | | | | | | 9,732 | | 9,732 | |
Subtotal Affiliate Investments (51.0% of net assets at fair value) | | | | | | | | | | | | | $ | 254,666 | | $ | 315,190 | |
| Non-Control/Non-Affiliate Investments (7) | | | | | | | | | | | | | | |
| AAC Holdings, Inc. | (11) | Substance Abuse Treatment Service Provider | | | | | | | | | | | | |
| | | Secured Debt | | 1/31/2023 | | 18.00% | | | 18.00% | 6/25/2025 | $ | 173 | | $ | 172 | | $ | 171 | |
| | | Secured Debt | | 12/11/2020 | | 18.00% | | | 18.00% | 6/25/2025 | 5,745 | | 5,681 | | 5,687 | |
| | | Common Stock | | 12/11/2020 | 593,927 | | | | | | | 3,148 | | — | |
| | | Warrants | (27) | 12/11/2020 | 197,717 | | | | | 12/11/2025 | | — | | — | |
| | | | | | | | | | | | | 9,001 | | 5,858 | |
| Acumera, Inc. | (10) | Managed Security Service Provider | | | | | | | | | | | | |
| | | Common Equity | (8) | 7/2/2024 | 3,311 | | | | | | | — | | 30 | |
| | | | | | | | | | | | | | |
| Adams Publishing Group, LLC | (10) | Local Newspaper Operator | | | | | | | | | | | | |
| | | Secured Debt | (9) (29) | 3/11/2022 | | 11.00% | SF+ | 7.00% | 1.00% | 3/11/2027 | 943 | | 943 | | 924 | |
| | | Secured Debt | (9) (29) | 3/11/2022 | | 11.00% | SF+ | 7.00% | 1.00% | 3/11/2027 | 2,322 | | 2,318 | | 2,274 | |
| | | | | | | | | | | | | 3,261 | | 3,198 | |
| AMEREQUIP LLC | (10) | Full Services Provider Including Design, Engineering and Manufacturing of Commercial and Agricultural Equipment | | | | | | | | | | | | |
| | | Common Stock | (8) | 8/31/2022 | 11 | | | | | | | 83 | | 40 | |
| | | | | | | | | | | | | | |
| American Health Staffing Group, Inc. | (10) | Healthcare Temporary Staffing | | | | | | | | | | | | |
| | | Secured Debt | (9) (30) | 11/19/2021 | | | P+ | 5.00% | | 11/19/2026 | — | | (7) | | (7) | |
| | | Secured Debt | (9) | 11/19/2021 | | 13.00% | P+ | 5.00% | | 11/19/2026 | 7,703 | | 7,669 | | 7,703 | |
| | | | | | | | | | | | | 7,662 | | 7,696 | |
| American Nuts, LLC | (10) | Roaster, Mixer and Packager of Bulk Nuts and Seeds | | | | | | | | | | | | |
| | | Secured Debt | (9) | 3/11/2022 | | 15.23% | SF+ | 9.75% | 15.23% | 4/10/2026 | 5,425 | | 5,411 | | 4,556 | |
| | | Secured Debt | (9) (14) | 3/11/2022 | | 17.20% | SF+ | 11.75% | 17.20% | 4/10/2026 | 4,270 | | 4,244 | | 2,851 | |
| | | | | | | | | | | | | 9,655 | | 7,407 | |
| American Teleconferencing Services, Ltd. | (11) | Provider of Audio Conferencing and Video Collaboration Solutions | | | | | | | | | | | | |
| | | Secured Debt | (14) (17) | 9/17/2021 | | | | | | 4/7/2023 | 2,425 | | 2,375 | | 59 | |
| | | Secured Debt | (14) (17) | 5/19/2016 | | | | | | 6/8/2023 | 11,693 | | 11,451 | | 282 | |
| | | | | | | | | | | | | 13,826 | | 341 | |
| Ansira Partners II, LLC | (10) | Provider of Data-Driven Marketing Services | | | | | | | | | | | | |
MSC INCOME FUND, INC.
Consolidated Schedule of Investments (Continued)
September 30, 2024
(dollars in thousands)
(Unaudited)
| | | | | | | | | | | | | | | | | | | | | | | | | | | | | | | | | | | | | | | | | | | | |
| Portfolio Company (1) (20) | | Business Description | Type of Investment (2) (3) (15) | | Investment Date (22) | Shares/Units | Total Rate | Reference Rate and Spread (25) | PIK Rate (19) | Maturity Date | Principal (4) | Cost (4) | Fair Value (18) |
| | | Secured Debt | (9) | 7/1/2024 | | 11.88% | SF+ | 6.75% | | 7/1/2029 | 195 | | 148 | | 148 | |
| | | Secured Debt | (9) | 7/1/2024 | | 12.08% | SF+ | 6.75% | | 7/1/2029 | 18,049 | | 17,597 | | 17,597 | |
| | | | | | | | | | | | | 17,745 | | 17,745 | |
| ArborWorks, LLC | (10) | Vegetation Management Services | | | | | | | | | | | | |
| | | Secured Debt | | 11/6/2023 | | 15.00% | | | 15.00% | 11/6/2028 | 2,106 | | 2,106 | | 2,106 | |
| | | Secured Debt | (9) | 11/6/2023 | | 11.76% | SF+ | 6.50% | 11.76% | 11/6/2028 | 4,157 | | 4,157 | | 4,157 | |
| | | Preferred Equity | | 11/6/2023 | 17,265 | | | | | | | 7,468 | | 6,667 | |
| | | Preferred Equity | | 11/6/2023 | 17,265 | | | | | | | — | | — | |
| | | Common Equity | | 11/9/2021 | 2,070 | | | | | | | 124 | | — | |
| | | | | | | | | | | | | 13,855 | | 12,930 | |
| Archer Systems, LLC | (10) | Mass Tort Settlement Administration Solutions Provider | | | | | | | | | | | | |
| | | Common Stock | | 8/11/2022 | 62,403 | | | | | | | 62 | | 100 | |
| | | | | | | | | | | | | | |
| ATS Operating, LLC | (10) | For-Profit Thrift Retailer | | | | | | | | | | | | |
| | | Secured Debt | (9) | 1/18/2022 | | 11.59% | SF+ | 6.00% | | 1/18/2027 | 105 | | 105 | | 105 | |
| | | Secured Debt | (9) | 1/18/2022 | | 10.59% | SF+ | 5.00% | | 1/18/2027 | 925 | | 915 | | 925 | |
| | | Secured Debt | (9) | 1/18/2022 | | 12.59% | SF+ | 7.00% | | 1/18/2027 | 925 | | 915 | | 925 | |
| | | Common Stock | | 1/18/2022 | 100,000 | | | | | | | 100 | | 100 | |
| | | | | | | | | | | | | 2,035 | | 2,055 | |
| AVEX Aviation Holdings, LLC | (10) | Specialty Aircraft Dealer & MRO Provider | | | | | | | | | | | | |
| | | Secured Debt | (9) (30) | 12/23/2022 | | | SF+ | 7.25% | | 12/23/2027 | — | | (14) | | (14) | |
| | | Secured Debt | (9) | 12/23/2022 | | 12.06% | SF+ | 7.25% | | 12/23/2027 | 3,365 | | 3,287 | | 3,365 | |
| | | Common Equity | (8) | 12/15/2021 | 137 | | | | | | | 134 | | 111 | |
| | | | | | | | | | | | | 3,407 | | 3,462 | |
| Berry Aviation, Inc. | (10) | Charter Airline Services | | | | | | | | | | | | |
| | | Preferred Member Units | | 3/8/2024 | 286,109 | | | | | | | 286 | | — | |
| | | Preferred Member Units | (23) | 11/12/2019 | 122,416 | | | | | | | — | | — | |
| | | Preferred Member Units | (23) | 7/6/2018 | 1,548,387 | | | | | | | — | | — | |
| | | | | | | | | | | | | 286 | | — | |
| Bettercloud, Inc. | (10) | SaaS Provider of Workflow Management and Business Application Solutions | | | | | | | | | | | | |
| | | Secured Debt | (9) (30) | 6/30/2022 | | | SF+ | 10.25% | | 6/30/2028 | — | | (15) | | (15) | |
| | | Secured Debt | (9) | 6/30/2022 | | 15.31% | SF+ | 10.25% | 9.25% | 6/30/2028 | 9,035 | | 8,939 | | 7,544 | |
| | | | | | | | | | | | | 8,924 | | 7,529 | |
| Binswanger Enterprises, LLC | (10) | Glass Repair and Installation Service Provider | | | | | | | | | | | | |
| | | Member Units | | 3/10/2017 | 1,050,000 | | | | | | | 1,050 | | 580 | |
MSC INCOME FUND, INC.
Consolidated Schedule of Investments (Continued)
September 30, 2024
(dollars in thousands)
(Unaudited)
| | | | | | | | | | | | | | | | | | | | | | | | | | | | | | | | | | | | | | | | | | | | |
| Portfolio Company (1) (20) | | Business Description | Type of Investment (2) (3) (15) | | Investment Date (22) | Shares/Units | Total Rate | Reference Rate and Spread (25) | PIK Rate (19) | Maturity Date | Principal (4) | Cost (4) | Fair Value (18) |
| | | | | | | | | | | | | | |
| Bluestem Brands, Inc. | (11) | Multi-Channel Retailer of General Merchandise | | | | | | | | | | | | |
| | | Secured Debt | (9) | 1/9/2024 | | 13.82% | SF+ | 8.50% | 12.82% | 8/28/2025 | 204 | | 99 | | 187 | |
| | | Secured Debt | (9) | 10/19/2022 | | 15.50% | P+ | 7.50% | 15.00% | 8/28/2025 | 3,703 | | 3,703 | | 3,388 | |
| | | Secured Debt | (9) | 8/28/2020 | | 13.82% | SF+ | 8.50% | 12.82% | 8/28/2025 | 4,348 | | 3,998 | | 3,978 | |
| | | Common Stock | | 10/1/2020 | 700,446 | | | | | | | — | | — | |
| | | Warrants | (27) | 10/19/2022 | 175,110 | | | | | 10/19/2032 | | 1,111 | | — | |
| | | | | | | | | | | | | 8,911 | | 7,553 | |
| Boccella Precast Products LLC | | Manufacturer of Precast Hollow Core Concrete | | | | | | | | | | | | |
| | | Secured Debt | | 9/23/2021 | | 10.00% | | | | 2/28/2027 | 80 | | 80 | | 66 | |
| | | Member Units | (8) | 6/30/2017 | 540,000 | | | | | | | 564 | | 80 | |
| | | | | | | | | | | | | 644 | | 146 | |
| Bond Brand Loyalty ULC | (10) (13) (21) | Provider of Loyalty Marketing Services | | | | | | | | | | | | |
| | | Secured Debt | (9) (30) | 5/1/2023 | | | SF+ | 7.00% | | 5/1/2028 | — | | (13) | | (13) | |
| | | Secured Debt | (9) | 5/1/2023 | | 11.48% | SF+ | 6.00% | | 5/1/2028 | 4,010 | | 3,952 | | 4,010 | |
| | | Secured Debt | (9) | 5/1/2023 | | 13.48% | SF+ | 8.00% | | 5/1/2028 | 4,010 | | 3,952 | | 4,010 | |
| | | Preferred Equity | | 5/1/2023 | 360 | | | | | | | 360 | | 310 | |
| | | Common Equity | | 5/1/2023 | 360 | | | | | | | — | | — | |
| | | | | | | | | | | | | 8,251 | | 8,317 | |
| BP Loenbro Holdings Inc. | (10) | Specialty Industrial Maintenance Services | | | | | | | | | | | | |
| | | Secured Debt | (9) (28) | 2/1/2024 | | 11.22% | SF+ | 6.00% | | 2/1/2029 | 771 | | 748 | | 771 | |
| | | Secured Debt | (9) (30) | 2/1/2024 | | | SF+ | 6.00% | | 2/1/2029 | — | | (11) | | (11) | |
| | | Secured Debt | (9) | 2/1/2024 | | 11.35% | SF+ | 6.00% | | 2/1/2029 | 11,288 | | 11,091 | | 11,288 | |
| | | Common Equity | | 2/1/2024 | 1,000,000 | | | | | | | 1,000 | | 1,550 | |
| | | | | | | | | | | | | 12,828 | | 13,598 | |
| Brightwood Capital Fund Investments | (12) (13) | Investment Partnership | | | | | | | | | | | | |
| | | LP Interests (Brightwood Capital Fund III, LP) | (24) | 7/21/2014 | 1.0% | | | | | | | 1,974 | | 1,156 | |
| | | LP Interests (Brightwood Capital Fund IV, LP) | (8) (24) | 10/26/2016 | 1.0% | | | | | | | 8,637 | | 8,802 | |
| | | | | | | | | | | | | 10,611 | | 9,958 | |
| Buca C, LLC | | Casual Restaurant Group | | | | | | | | | | | | |
| | | Secured Debt | (14) | 8/7/2024 | | 15.00% | | | 10.00% | 11/4/2024 | 13,330 | | 13,048 | | 10,817 | |
| | | Secured Debt | (14) (30) | 6/28/2024 | | 15.00% | | | 15.00% | 4/1/2025 | 10 | | — | | — | |
| | | Secured Debt | (14) (17) | 6/30/2015 | | 15.00% | | | 15.00% | 8/31/2023 | 6,131 | | 4,078 | | — | |
| | | Preferred Member Units | | 6/30/2015 | 4 | 6.00% | | | 6.00% | | | 3,040 | | — | |
| | | | | | | | | | | | | 20,166 | | 10,817 | |
MSC INCOME FUND, INC.
Consolidated Schedule of Investments (Continued)
September 30, 2024
(dollars in thousands)
(Unaudited)
| | | | | | | | | | | | | | | | | | | | | | | | | | | | | | | | | | | | | | | | | | | | |
| Portfolio Company (1) (20) | | Business Description | Type of Investment (2) (3) (15) | | Investment Date (22) | Shares/Units | Total Rate | Reference Rate and Spread (25) | PIK Rate (19) | Maturity Date | Principal (4) | Cost (4) | Fair Value (18) |
| Burning Glass Intermediate Holding Company, Inc. | (10) | Provider of Skills-Based Labor Market Analytics | | | | | | | | | | | | |
| | | Secured Debt | (9) (30) | 6/14/2021 | | | SF+ | 5.00% | | 6/10/2026 | — | | (9) | | — | |
| | | Secured Debt | (9) | 6/14/2021 | | 9.95% | SF+ | 5.00% | | 6/10/2028 | 12,125 | | 12,006 | | 12,125 | |
| | | | | | | | | | | | | 11,997 | | 12,125 | |
| CAI Software LLC | | Provider of Specialized Enterprise Resource Planning Software | | | | | | | | | | | | |
| | | Preferred Equity | | 12/13/2021 | 454,344 | | | | | | | 454 | | 472 | |
| | | Preferred Equity | | 12/13/2021 | 126,446 | | | | | | | — | | — | |
| | | | | | | | | | | | | 454 | | 472 | |
| Career Team Holdings, LLC | | Provider of Workforce Training and Career Development Services | | | | | | | | | | | | |
| | | Secured Debt | (9) | 12/17/2021 | | 11.25% | SF+ | 6.00% | | 12/17/2026 | 75 | | 71 | | 71 | |
| | | Secured Debt | | 12/17/2021 | | 13.00% | | | | 12/17/2026 | 2,205 | | 2,176 | | 2,176 | |
| | | Common Stock | | 12/17/2021 | 50,000 | | | | | | | 500 | | 500 | |
| | | | | | | | | | | | | 2,747 | | 2,747 | |
| CaseWorthy, Inc. | (10) | SaaS Provider of Case Management Solutions | | | | | | | | | | | | |
| | | Common Equity | | 12/30/2022 | 80,000 | | | | | | | 80 | | 160 | |
| | | | | | | | | | | | | | |
| CenterPeak Holdings, LLC | | Executive Search Services | | | | | | | | | | | | |
| | | Secured Debt | (30) | 12/10/2021 | | | | | | 12/10/2026 | — | | (3) | | — | |
| | | Secured Debt | | 12/10/2021 | | 15.00% | | | | 12/10/2026 | 2,390 | | 2,361 | | 2,390 | |
| | | Preferred Equity | (8) | 12/10/2021 | 368 | | | | | | | 404 | | 1,590 | |
| | | | | | | | | | | | | 2,762 | | 3,980 | |
| Central Moloney, LLC | (10) | Manufacturer of Electricity Transformers and Related Equipment | | | | | | | | | | | | |
| | | Secured Debt | (9) | 2/9/2024 | | 11.35% | SF+ | 6.75% | | 10/20/2028 | 12,861 | | 12,639 | | 12,773 | |
| | | | | | | | | | | | | | |
| Channel Partners Intermediateco, LLC | (10) | Outsourced Consumer Services Provider | | | | | | | | | | | | |
| | | Secured Debt | (9) (28) | 2/7/2022 | | 12.02% | SF+ | 7.00% | | 2/7/2027 | 467 | | 455 | | 437 | |
| | | Secured Debt | (9) | 2/7/2022 | | 12.55% | SF+ | 7.00% | | 2/7/2027 | 3,334 | | 3,303 | | 3,125 | |
| | | Secured Debt | (9) | 6/24/2022 | | 12.55% | SF+ | 7.00% | | 2/7/2027 | 185 | | 183 | | 173 | |
| | | Secured Debt | (9) | 3/27/2023 | | 12.55% | SF+ | 7.00% | | 2/7/2027 | 446 | | 439 | | 418 | |
| | | | | | | | | | | | | 4,380 | | 4,153 | |
| Clarius BIGS, LLC | (10) | Prints & Advertising Film Financing | | | | | | | | | | | | |
| | | Secured Debt | (14) (17) | 9/23/2014 | | | | | | 1/5/2015 | 2,685 | | 2,340 | | 17 | |
| | | | | | | | | | | | | | |
| Classic H&G Holdings, LLC | | Provider of Engineered Packaging Solutions | | | | | | | | | | | | |
MSC INCOME FUND, INC.
Consolidated Schedule of Investments (Continued)
September 30, 2024
(dollars in thousands)
(Unaudited)
| | | | | | | | | | | | | | | | | | | | | | | | | | | | | | | | | | | | | | | | | | | | |
| Portfolio Company (1) (20) | | Business Description | Type of Investment (2) (3) (15) | | Investment Date (22) | Shares/Units | Total Rate | Reference Rate and Spread (25) | PIK Rate (19) | Maturity Date | Principal (4) | Cost (4) | Fair Value (18) |
| | | Preferred Member Units | (8) | 3/12/2020 | 39 | | | | | | | — | | 660 | |
| | | | | | | | | | | | | | |
| Computer Data Source, LLC | (10) | Third Party Maintenance Provider to the Data Center Ecosystem | | | | | | | | | | | | |
| | | Secured Debt | (9) (28) | 8/6/2021 | | 13.29% | SF+ | 8.00% | | 8/6/2026 | 6,250 | | 6,170 | | 6,117 | |
| | | Secured Debt | (9) (30) | 3/29/2024 | | | SF+ | 8.00% | | 8/6/2026 | — | | (49) | | (49) | |
| | | Secured Debt | (9) | 8/6/2021 | | 13.28% | SF+ | 8.00% | | 8/6/2026 | 15,146 | | 14,970 | | 14,823 | |
| | | | | | | | | | | | | 21,091 | | 20,891 | |
| Construction Supply Investments, LLC | (10) | Distribution Platform of Specialty Construction Materials to Professional Concrete and Masonry Contractors | | | | | | | | | | | | |
| | | Member Units | | 12/29/2016 | | | | | | | | — | | — | |
| | | | | | | | | | | | | | |
| Coregistics Buyer LLC | (10) (13) (21) | Contract Packaging Service Provider | | | | | | | | | | | | |
| | | Secured Debt | (9) | 6/29/2024 | | | SF+ | 6.50% | | 6/28/2029 | | 426 | | 429 | |
| | | Secured Debt | (9) | 6/29/2024 | | 11.45% | SF+ | 6.50% | | 6/28/2029 | | 2,813 | | 2,752 | |
| | | Secured Debt | (9) | 8/15/2024 | | 11.62% | SF+ | 6.50% | | 6/28/2029 | | 1,881 | | 1,835 | |
| | | Secured Debt | (9) | 6/29/2024 | | 11.70% | SF+ | 6.75% | | 6/28/2029 | | 8,449 | | 8,448 | |
| | | | | | | | | | | | | 13,569 | | 13,464 | |
| CQ Fluency, LLC | (10) | Global Language Services Provider | | | | | | | | | | | | |
| | | Secured Debt | (9) (30) | 12/27/2023 | | | SF+ | 6.75% | | 6/27/2027 | — | | (35) | | (35) | |
| | | Secured Debt | (9) (30) | 12/27/2023 | | | SF+ | 6.75% | | 6/27/2027 | — | | (35) | | (35) | |
| | | Secured Debt | (9) | 12/27/2023 | | 11.49% | SF+ | 6.75% | | 6/27/2027 | 7,313 | | 7,142 | | 7,170 | |
| | | | | | | | | | | | | 7,072 | | 7,100 | |
| Creative Foam Corporation | (10) | Manufacturer of Custom Engineered Die Cut, Formed Foam, Nonwoven, and Multi-material Component Solutions for the Automotive and Healthcare Markets | | | | | | | | | | | | |
| | | Secured Debt | (9) (30) | 6/27/2024 | | | SF+ | 5.75% | | 6/27/2029 | — | | (29) | | (29) | |
| | | Secured Debt | (9) | 6/27/2024 | | 10.35% | SF+ | 5.75% | | 6/27/2029 | 10,869 | | 10,666 | | 10,733 | |
| | | | | | | | | | | | | 10,637 | | 10,704 | |
| Dalton US Inc. | (10) | Provider of Supplemental Labor Services | | | | | | | | | | | | |
| | | Common Stock | | 8/16/2022 | 37 | | | | | | | 52 | | 60 | |
| | | | | | | | | | | | | | |
| DMA Industries, LLC | | Distributor of Aftermarket Ride Control Products | | | | | | | | | | | | |
| | | Secured Debt | | 6/18/2024 | | 12.00% | | | | 6/19/2029 | 140 | | 137 | | 137 | |
| | | Secured Debt | | 11/19/2021 | | 12.00% | | | | 6/19/2029 | 4,200 | | 4,159 | | 4,159 | |
| | | Preferred Equity | | 11/19/2021 | 1,486 | | | | | | | 1,486 | | 1,486 | |
MSC INCOME FUND, INC.
Consolidated Schedule of Investments (Continued)
September 30, 2024
(dollars in thousands)
(Unaudited)
| | | | | | | | | | | | | | | | | | | | | | | | | | | | | | | | | | | | | | | | | | | | |
| Portfolio Company (1) (20) | | Business Description | Type of Investment (2) (3) (15) | | Investment Date (22) | Shares/Units | Total Rate | Reference Rate and Spread (25) | PIK Rate (19) | Maturity Date | Principal (4) | Cost (4) | Fair Value (18) |
| | | Preferred Equity | (8) | 6/18/2024 | 767 | 15.00% | | | 15.00% | | | 781 | | 781 | |
| | | | | | | | | | | | | 6,563 | | 6,563 | |
| DTE Enterprises, LLC | (10) | Industrial Powertrain Repair and Services | | | | | | | | | | | | |
| | | Class AA Preferred Member Units (non-voting) | (8) | 4/13/2018 | | 10.00% | | | 10.00% | | | 1,316 | | 681 | |
| | | Class A Preferred Member Units | | 4/13/2018 | 776,316 | 8.00% | | | 8.00% | | | 776 | | — | |
| | | | | | | | | | | | | 2,092 | | 681 | |
| Dynamic Communities, LLC | (10) | Developer of Business Events and Online Community Groups | | | | | | | | | | | | |
| | | Secured Debt | (9) | 12/20/2022 | | 11.45% | SF+ | 6.50% | 11.45% | 12/31/2026 | 2,253 | | 2,094 | | 2,155 | |
| | | Secured Debt | (9) | 12/20/2022 | | 13.45% | SF+ | 8.50% | 13.45% | 12/31/2026 | 2,333 | | 2,100 | | 2,139 | |
| | | Preferred Equity | | 12/20/2022 | 125,000 | | | | | | | 128 | | 60 | |
| | | Preferred Equity | | 12/20/2022 | 2,376,241 | | | | | | | — | | — | |
| | | Common Equity | | 12/20/2022 | 1,250,000 | | | | | | | — | | — | |
| | | | | | | | | | | | | 4,322 | | 4,354 | |
| Elgin AcquireCo, LLC | | Manufacturer and Distributor of Engine and Chassis Components | | | | | | | | | | | | |
| | | Secured Debt | (9) (30) | 10/3/2022 | | | SF+ | 6.00% | | 10/3/2027 | — | | — | | — | |
| | | Secured Debt | | 10/3/2022 | | 12.00% | | | | 10/3/2027 | 1,181 | | 1,160 | | 1,160 | |
| | | Secured Debt | | 10/3/2022 | | 9.00% | | | | 10/3/2052 | 410 | | 406 | | 406 | |
| | | Common Stock | | 10/3/2022 | 19 | | | | | | | 374 | | 370 | |
| | | Common Stock | (23) | 10/3/2022 | 61 | | | | | | | 102 | | 196 | |
| | | | | | | | | | | | | 2,042 | | 2,132 | |
| Emerald Technologies Acquisition Co, Inc. | (11) | Design & Manufacturing | | | | | | | | | | | | |
| | | Secured Debt | (9) | 2/10/2022 | | 11.20% | SF+ | 6.25% | | 12/29/2027 | 2,359 | | 2,332 | | 1,935 | |
| | | | | | | | | | | | | | |
| Escalent, Inc. | (10) | Market Research and Consulting Firm | | | | | | | | | | | | |
| | | Secured Debt | (9) (30) | 4/7/2023 | | | SF+ | 8.00% | | 4/7/2029 | — | | (8) | | (8) | |
| | | Secured Debt | (9) | 4/7/2023 | | 12.70% | SF+ | 8.00% | | 4/7/2029 | 6,872 | | 6,716 | | 6,872 | |
| | | Common Equity | | 4/7/2023 | 170,998 | | | | | | | 174 | | 240 | |
| | | | | | | | | | | | | 6,882 | | 7,104 | |
| Event Holdco, LLC | (10) | Event and Learning Management Software for Healthcare Organizations and Systems | | | | | | | | | | | | |
| | | Secured Debt | (9) | 12/22/2021 | | 12.87% | SF+ | 8.00% | | 12/22/2026 | 308 | | 306 | | 308 | |
| | | Secured Debt | (9) | 12/22/2021 | | 12.87% | SF+ | 8.00% | 8.00% | 12/22/2026 | 3,909 | | 3,893 | | 3,909 | |
| | | | | | | | | | | | | 4,199 | | 4,217 | |
| FCC Intermediate Holdco, LLC | | Supply Chain Management Services | | | | | | | | | | | | |
MSC INCOME FUND, INC.
Consolidated Schedule of Investments (Continued)
September 30, 2024
(dollars in thousands)
(Unaudited)
| | | | | | | | | | | | | | | | | | | | | | | | | | | | | | | | | | | | | | | | | | | | |
| Portfolio Company (1) (20) | | Business Description | Type of Investment (2) (3) (15) | | Investment Date (22) | Shares/Units | Total Rate | Reference Rate and Spread (25) | PIK Rate (19) | Maturity Date | Principal (4) | Cost (4) | Fair Value (18) |
| | | Secured Debt | | 5/28/2024 | | 13.00% | | | | 5/29/2029 | 8,200 | | 7,074 | | 7,074 | |
| | | Warrants | (27) | 5/28/2024 | 3 | | | | | | 980 | | 980 | | 980 | |
| | | | | | | | | | | | | 8,054 | | 8,054 | |
| Garyline, LLC | (10) | Manufacturer of Consumer Plastic Products | | | | | | | | | | | | |
| | | Secured Debt | (9) (28) | 11/10/2023 | | 11.95% | SF+ | 6.75% | | 11/10/2028 | 1,786 | | 1,721 | | 1,755 | |
| | | Secured Debt | (9) | 11/10/2023 | | 11.95% | SF+ | 6.75% | | 11/10/2028 | 9,616 | | 9,379 | | 9,448 | |
| | | Common Equity | | 11/10/2023 | 210,084 | | | | | | | 210 | | 170 | |
| | | | | | | | | | | | | 11,310 | | 11,373 | |
| Hawk Ridge Systems, LLC | | Value-Added Reseller of Engineering Design and Manufacturing Solutions | | | | | | | | | | | | |
| | | Secured Debt | (9) | 12/2/2016 | | 11.35% | SF+ | 6.00% | | 1/15/2026 | 640 | | 639 | | 640 | |
| | | Secured Debt | | 12/2/2016 | | 12.50% | | | | 1/15/2026 | 9,744 | | 9,715 | | 9,744 | |
| | | Preferred Member Units | (8) | 12/2/2016 | 56 | | | | | | | 713 | | 4,750 | |
| | | Preferred Member Units | (23) | 12/2/2016 | 56 | | | | | | | 38 | | 250 | |
| | | | | | | | | | | | | 11,105 | | 15,384 | |
| HDC/HW Intermediate Holdings | (10) | Managed Services and Hosting Provider | | | | | | | | | | | | |
| | | Secured Debt | (9) | 3/7/2024 | | 8.75% | SF+ | 3.50% | 2.50% | 6/21/2026 | 1,353 | | 1,289 | | 1,289 | |
| | | Secured Debt | (14) | 3/7/2024 | | 2.50% | | | 2.50% | 6/21/2026 | 914 | | 401 | | 359 | |
| | | Common Equity | | 3/7/2024 | 35,971 | | | | | | | — | | — | |
| | | | | | | | | | | | | 1,690 | | 1,648 | |
| HEADLANDS OP-CO LLC | (10) | Clinical Trial Sites Operator | | | | | | | | | | | | |
| | | Secured Debt | (9) (30) | 8/1/2022 | | | SF+ | 6.50% | | 8/1/2027 | — | | (11) | | (11) | |
| | | Secured Debt | (9) | 8/1/2022 | | 11.35% | SF+ | 6.50% | | 8/1/2027 | 1,980 | | 1,954 | | 1,980 | |
| | | Secured Debt | (9) (30) | 6/3/2024 | | | SF+ | 6.50% | | 8/1/2027 | — | | (18) | | (18) | |
| | | Secured Debt | (9) | 8/1/2022 | | 11.35% | SF+ | 6.50% | | 8/1/2027 | 4,888 | | 4,832 | | 4,887 | |
| | | Secured Debt | (9) | 6/3/2024 | | 11.35% | SF+ | 6.50% | | 8/1/2027 | 2,388 | | 2,367 | | 2,388 | |
| | | | | | | | | | | | | 9,124 | | 9,226 | |
| Hornblower Sub, LLC | (10) | Marine Tourism and Transportation | | | | | | | | | | | | |
| | | Secured Debt | (9) (30) | 7/3/2024 | | | SF+ | 5.50% | | 7/3/2029 | — | | (24) | | (24) | |
| | | Secured Debt | (9) | 7/3/2024 | | 10.82% | SF+ | 5.50% | | 7/3/2029 | 15,529 | | 15,368 | | 15,368 | |
| | | | | | | | | | | | | 15,344 | | 15,344 | |
| Hybrid Promotions, LLC | (10) | Wholesaler of Licensed, Branded and Private Label Apparel | | | | | | | | | | | | |
| | | Secured Debt | (9) | 6/30/2021 | | 13.84% | SF+ | 8.25% | | 12/31/2027 | 8,000 | | 7,847 | | 8,000 | |
| | | | | | | | | | | | | | |
| IG Parent Corporation | (11) | Software Engineering | | | | | | | | | | | | |
| | | Secured Debt | (9) | 7/30/2021 | | 10.95% | SF+ | 5.75% | | 7/30/2026 | 306 | | 297 | | 306 | |
| | | Secured Debt | (9) | 7/30/2021 | | 10.70% | SF+ | 5.75% | | 7/30/2028 | 6,154 | | 6,101 | | 6,154 | |
| | | Secured Debt | (9) | 7/30/2021 | | 10.70% | SF+ | 5.75% | | 7/30/2028 | 1,927 | | 1,910 | | 1,927 | |
| | | | | | | | | | | | | 8,308 | | 8,387 | |
MSC INCOME FUND, INC.
Consolidated Schedule of Investments (Continued)
September 30, 2024
(dollars in thousands)
(Unaudited)
| | | | | | | | | | | | | | | | | | | | | | | | | | | | | | | | | | | | | | | | | | | | |
| Portfolio Company (1) (20) | | Business Description | Type of Investment (2) (3) (15) | | Investment Date (22) | Shares/Units | Total Rate | Reference Rate and Spread (25) | PIK Rate (19) | Maturity Date | Principal (4) | Cost (4) | Fair Value (18) |
| Imaging Business Machines, L.L.C. | (10) | Technology Hardware & Equipment | | | | | | | | | | | | |
| | | Secured Debt | (9) (28) | 6/8/2023 | | 12.08% | SF+ | 7.00% | | 6/30/2028 | 593 | | 593 | | 593 | |
| | | Secured Debt | (9) | 6/8/2023 | | 11.62% | SF+ | 7.00% | | 6/30/2028 | 10,306 | | 10,042 | | 10,306 | |
| | | Common Equity | | 6/8/2023 | 422 | | | | | | | 580 | | 540 | |
| | | | | | | | | | | | | 11,215 | | 11,439 | |
| Implus Footcare, LLC | (10) | Provider of Footwear and Related Accessories | | | | | | | | | | | | |
| | | Secured Debt | (9) | 6/1/2017 | | 14.01% | SF+ | 9.25% | 1.50% | 7/31/2025 | 17,043 | | 17,043 | | 15,988 | |
| | | | | | | | | | | | | | |
| Infinity X1 Holdings, LLC | | Manufacturer and Supplier of Personal Lighting Products | | | | | | | | | | | | |
| | | Secured Debt | | 3/31/2023 | | 12.00% | | | | 3/31/2028 | 3,819 | | 3,766 | | 3,766 | |
| | | Preferred Equity | (8) | 3/31/2023 | 21,840 | | | | | | | 1,092 | | 1,730 | |
| | | | | | | | | | | | | 4,858 | | 5,496 | |
| Insight Borrower Corporation | (10) | Test, Inspection, and Certification Instrument Provider | | | | | | | | | | | | |
| | | Secured Debt | (9) (30) | 7/19/2023 | | | SF+ | 6.25% | | 7/19/2028 | — | | (34) | | (34) | |
| | | Secured Debt | (9) (30) | 7/19/2023 | | | SF+ | 6.25% | | 7/19/2029 | — | | (29) | | (29) | |
| | | Secured Debt | (9) | 7/19/2023 | | 11.53% | SF+ | 6.25% | | 7/19/2029 | 8,310 | | 8,111 | | 7,880 | |
| | | Common Equity | | 7/19/2023 | 47,847 | | | | | | | 239 | | 130 | |
| | | | | | | | | | | | | 8,287 | | 7,947 | |
| Inspire Aesthetics Management, LLC | (10) | Surgical and Non-Surgical Plastic Surgery and Aesthetics Provider | | | | | | | | | | | | |
| | | Secured Debt | (9) (28) | 4/3/2023 | | 13.03% | SF+ | 8.00% | | 4/3/2028 | 676 | | 662 | | 609 | |
| | | Secured Debt | (9) | 4/3/2023 | | 13.27% | SF+ | 8.00% | | 4/3/2028 | 6,209 | | 6,093 | | 5,591 | |
| | | Secured Debt | (9) | 6/14/2023 | | 13.27% | SF+ | 8.00% | | 4/3/2028 | 1,250 | | 1,227 | | 1,126 | |
| | | Common Equity | | 4/3/2023 | 101,719 | | | | | | | 322 | | 10 | |
| | | | | | | | | | | | | 8,304 | | 7,336 | |
| Interface Security Systems, L.L.C | (10) | Commercial Security & Alarm Services | | | | | | | | | | | | |
| | | Secured Debt | (17) (28) | 12/9/2021 | | 15.06% | SF+ | 10.00% | 15.22% | 8/7/2023 | 1,998 | | 1,998 | | 1,842 | |
| | | Secured Debt | (9) (14) (17) | 8/7/2019 | | 12.35% | SF+ | 7.00% | 12.35% | 8/7/2023 | 7,334 | | 7,254 | | 11 | |
| | | Common Stock | | 12/7/2021 | 2,143 | | | | | | | — | | — | |
| | | | | | | | | | | | | 9,252 | | 1,853 | |
| Invincible Boat Company, LLC. | (10) | Manufacturer of Sport Fishing Boats | | | | | | | | | | | | |
| | | Secured Debt | (9) (28) | 8/28/2019 | | 11.29% | SF+ | 6.50% | | 8/28/2025 | 1,037 | | 1,036 | | 991 | |
| | | Secured Debt | (9) | 8/28/2019 | | 11.25% | SF+ | 6.50% | | 8/28/2025 | 16,812 | | 16,779 | | 16,070 | |
| | | | | | | | | | | | | 17,815 | | 17,061 | |
| INW Manufacturing, LLC | (11) | Manufacturer of Nutrition and Wellness Products | | | | | | | | | | | | |
| | | Secured Debt | (9) | 5/19/2021 | | 10.62% | SF+ | 5.75% | | 3/25/2027 | 6,375 | | 6,283 | | 5,355 | |
MSC INCOME FUND, INC.
Consolidated Schedule of Investments (Continued)
September 30, 2024
(dollars in thousands)
(Unaudited)
| | | | | | | | | | | | | | | | | | | | | | | | | | | | | | | | | | | | | | | | | | | | |
| Portfolio Company (1) (20) | | Business Description | Type of Investment (2) (3) (15) | | Investment Date (22) | Shares/Units | Total Rate | Reference Rate and Spread (25) | PIK Rate (19) | Maturity Date | Principal (4) | Cost (4) | Fair Value (18) |
| | | | | | | | | | | | | | |
| Iron-Main Investments, LLC | | Consumer Reporting Agency Providing Employment Background Checks and Drug Testing | | | | | | | | | | | | |
| | | Secured Debt | | 8/2/2021 | | 13.00% | | | | 1/31/2028 | 1,128 | | 1,112 | | 1,112 | |
| | | Secured Debt | | 9/1/2021 | | 13.00% | | | | 1/31/2028 | 735 | | 724 | | 724 | |
| | | Secured Debt | | 11/15/2021 | | 13.00% | | | | 1/31/2028 | 2,236 | | 2,236 | | 2,236 | |
| | | Secured Debt | | 11/15/2021 | | 13.00% | | | | 1/31/2028 | 4,406 | | 4,339 | | 4,339 | |
| | | Secured Debt | | 1/31/2023 | | 13.00% | | | | 1/31/2028 | 2,521 | | 2,431 | | 2,431 | |
| | | Preferred Equity | | 6/26/2024 | 177,800 | 25.00% | | | 25.00% | | | 178 | | 190 | |
| | | Common Stock | | 8/3/2021 | 50,753 | | | | | | | 689 | | 710 | |
| | | | | | | | | | | | | 11,709 | | 11,742 | |
| Isagenix International, LLC | (11) | Direct Marketer of Health & Wellness Products | | | | | | | | | | | | |
| | | Secured Debt | (9) | 4/13/2023 | | 11.89% | SF+ | 6.60% | 9.43% | 4/14/2028 | 2,897 | | 2,700 | | 797 | |
| | | Common Equity | | 4/13/2023 | 186,322 | | | | | | | — | | — | |
| | | | | | | | | | | | | 2,700 | | 797 | |
| Island Pump and Tank, LLC | (10) | Provider of Facility and Maintenance Services to Fuel Retailers in Northeast U.S. | | | | | | | | | | | | |
| | | Secured Debt | (9) (30) | 5/20/2024 | | | SF+ | 6.50% | | 5/17/2029 | — | | (6) | | (6) | |
| | | Secured Debt | (9) | 5/20/2024 | | 11.09% | SF+ | 5.50% | | 5/17/2029 | 1,735 | | 1,706 | | 1,686 | |
| | | Secured Debt | (9) | 5/20/2024 | | 12.09% | SF+ | 6.50% | | 5/17/2029 | 1,735 | | 1,706 | | 1,686 | |
| | | Secured Debt | (9) | 5/20/2024 | | 13.09% | SF+ | 7.50% | | 5/17/2029 | 1,735 | | 1,706 | | 1,686 | |
| | | | | | | | | | | | | 5,112 | | 5,052 | |
| ITA Holdings Group, LLC | | Air Ambulance Services | | | | | | | | | | | | |
| | | Secured Debt | (9) | 6/21/2023 | | 15.53% | SF+ | 9.00% | 1.00% | 6/21/2027 | 299 | | 294 | | 294 | |
| | | Secured Debt | (9) | 6/21/2023 | | 15.53% | SF+ | 9.00% | 1.00% | 6/21/2027 | 252 | | 248 | | 248 | |
| | | Secured Debt | (9) | 6/21/2023 | | 14.53% | SF+ | 8.00% | 1.00% | 6/21/2027 | 1,105 | | 915 | | 915 | |
| | | Secured Debt | (9) | 6/21/2023 | | 16.53% | SF+ | 10.00% | 1.00% | 6/21/2027 | 1,105 | | 915 | | 915 | |
| | | Warrants | (27) | 6/21/2023 | 48,327 | | | | | 6/21/2033 | | 523 | | 820 | |
| | | | | | | | | | | | | 2,895 | | 3,192 | |
| Jackmont Hospitality, Inc. | (10) | Franchisee of Casual Dining Restaurants | | | | | | | | | | | | |
| | | Secured Debt | (9) (26) | 10/26/2022 | | 12.86% | SF+ | 7.50% | | 11/4/2024 | 1,607 | | 1,604 | | 1,607 | |
| | | Secured Debt | (9) | 2/27/2024 | | 15.28% | SF+ | 10.00% | | 11/4/2024 | 1,251 | | 1,244 | | 1,251 | |
| | | Secured Debt | (9) | 11/8/2021 | | 12.90% | SF+ | 7.50% | | 11/4/2024 | 3,738 | | 3,738 | | 3,738 | |
| | | Preferred Equity | | 11/8/2021 | 5,653,333 | | | | | | | 216 | | 1,740 | |
| | | | | | | | | | | | | 6,802 | | 8,336 | |
| JDC Power Services, LLC | (10) | Provider of Electrical Equipment and Maintenance Services for Datacenters | | | | | | | | | | | | |
| | | Secured Debt | (9) (30) | 6/28/2024 | | | SF+ | 6.75% | | 6/28/2029 | — | | (49) | | (49) | |
| | | Secured Debt | (9) | 6/28/2024 | | 11.35% | SF+ | 6.75% | | 6/28/2029 | 17,783 | | 17,367 | | 17,076 | |
| | | | | | | | | | | | | 17,318 | | 17,027 | |
MSC INCOME FUND, INC.
Consolidated Schedule of Investments (Continued)
September 30, 2024
(dollars in thousands)
(Unaudited)
| | | | | | | | | | | | | | | | | | | | | | | | | | | | | | | | | | | | | | | | | | | | |
| Portfolio Company (1) (20) | | Business Description | Type of Investment (2) (3) (15) | | Investment Date (22) | Shares/Units | Total Rate | Reference Rate and Spread (25) | PIK Rate (19) | Maturity Date | Principal (4) | Cost (4) | Fair Value (18) |
| Joerns Healthcare, LLC | (11) | Manufacturer and Distributor of Health Care Equipment & Supplies | | | | | | | | | | | | |
| | | Secured Debt | (9) (14) (17) | 8/21/2019 | | 21.59% | SF+ | 16.00% | 21.59% | 8/21/2024 | 942 | | 942 | | — | |
| | | Secured Debt | (9) (14) (17) | 8/21/2019 | | 21.59% | SF+ | 16.00% | 21.59% | 8/21/2024 | 906 | | 906 | | — | |
| | | Secured Debt | (9) | 3/30/2024 | | 13.45% | SF+ | 8.75% | 6.00% | 3/29/2029 | 1,666 | | 1,666 | | 1,666 | |
| | | Secured Debt | (9) | 3/30/2024 | | 13.45% | SF+ | 8.75% | 13.45% | 3/29/2029 | 1,055 | | 1,055 | | 1,055 | |
| | | Common Stock | | 8/21/2019 | 392,514 | | | | | | | 3,678 | | — | |
| | | Common Stock | | 3/29/2024 | 4,535,784 | | | | | | | 166 | | 166 | |
| | | | | | | | | | | | | 8,413 | | 2,887 | |
| JorVet Holdings, LLC | | Supplier and Distributor of Veterinary Equipment and Supplies | | | | | | | | | | | | |
| | | Secured Debt | | 3/28/2022 | | 12.00% | | | | 3/28/2027 | 2,750 | | 2,723 | | 2,723 | |
| | | Preferred Equity | (8) | 3/28/2022 | 12,214 | | | | | | | 1,221 | | 1,250 | |
| | | | | | | | | | | | | 3,944 | | 3,973 | |
| JTI Electrical & Mechanical, LLC | (10) | Electrical, Mechanical and Automation Services | | | | | | | | | | | | |
| | | Secured Debt | (9) (28) | 12/22/2021 | | 13.37% | SF+ | 8.00% | | 12/22/2026 | 702 | | 695 | | 664 | |
| | | Secured Debt | (9) | 12/22/2021 | | 12.85% | SF+ | 8.00% | | 12/22/2026 | 2,980 | | 2,953 | | 2,820 | |
| | | Secured Debt | (9) | 2/1/2024 | | 12.85% | SF+ | 8.00% | | 12/22/2026 | 279 | | 272 | | 264 | |
| | | Common Equity | | 12/22/2021 | 140,351 | | | | | | | 140 | | 20 | |
| | | | | | | | | | | | | 4,060 | | 3,768 | |
| KMS, LLC | (10) | Wholesaler of Closeout and Value-priced Products | | | | | | | | | | | | |
| | | Secured Debt | (9) (14) | 10/4/2021 | | 14.50% | SF+ | 9.75% | | 10/4/2026 | 1,286 | | 1,238 | | 967 | |
| | | Secured Debt | (9) (14) | 10/4/2021 | | 14.50% | SF+ | 9.75% | | 10/4/2026 | 9,262 | | 9,175 | | 6,966 | |
| | | | | | | | | | | | | 10,413 | | 7,933 | |
| Lightbox Holdings, L.P. | (11) | Provider of Commercial Real Estate Software | | | | | | | | | | | | |
| | | Secured Debt | | 5/9/2019 | | 10.11% | SF+ | 5.00% | | 5/9/2026 | 5,720 | | 5,701 | | 5,548 | |
| | | | | | | | | | | | | | |
| LL Management, Inc. | (10) | Medical Transportation Service Provider | | | | | | | | | | | | |
| | | Secured Debt | (9) | 9/17/2024 | | 12.43% | SF+ | 7.25% | | 12/31/2025 | 601 | | 601 | | 601 | |
| | | Secured Debt | (9) | 5/2/2019 | | 12.60% | SF+ | 7.25% | | 12/31/2025 | 7,872 | | 7,798 | | 7,872 | |
| | | Secured Debt | (9) | 5/2/2019 | | 12.60% | SF+ | 7.25% | | 12/31/2025 | 5,194 | | 5,144 | | 5,194 | |
| | | Secured Debt | (9) | 2/26/2021 | | 12.60% | SF+ | 7.25% | | 12/31/2025 | 863 | | 854 | | 863 | |
| | | Secured Debt | (9) | 5/12/2022 | | 12.60% | SF+ | 7.25% | | 12/31/2025 | 8,737 | | 8,651 | | 8,737 | |
| | | | | | | | | | | | | 23,048 | | 23,267 | |
| LLFlex, LLC | (10) | Provider of Metal-Based Laminates | | | | | | | | | | | | |
| | | Secured Debt | (9) | 8/16/2021 | | 13.48% | SF+ | 8.00% | 3.00% | 8/16/2026 | 4,510 | | 4,472 | | 3,724 | |
| | | | | | | | | | | | | | |
| Logix Acquisition Company, LLC | (10) | Competitive Local Exchange Carrier | | | | | | | | | | | | |
MSC INCOME FUND, INC.
Consolidated Schedule of Investments (Continued)
September 30, 2024
(dollars in thousands)
(Unaudited)
| | | | | | | | | | | | | | | | | | | | | | | | | | | | | | | | | | | | | | | | | | | | |
| Portfolio Company (1) (20) | | Business Description | Type of Investment (2) (3) (15) | | Investment Date (22) | Shares/Units | Total Rate | Reference Rate and Spread (25) | PIK Rate (19) | Maturity Date | Principal (4) | Cost (4) | Fair Value (18) |
| | | Secured Debt | (9) | 1/8/2018 | | 13.25% | P+ | 4.75% | | 12/22/2024 | 11,552 | | 11,486 | | 8,578 | |
| | | | | | | | | | | | | | |
| Mako Steel, LP | (10) | Self-Storage Design & Construction | | | | | | | | | | | | |
| | | Secured Debt | (9) (30) | 3/15/2021 | | | SF+ | 7.50% | | 3/15/2026 | — | | (24) | | — | |
| | | Secured Debt | (9) | 3/28/2024 | | 12.59% | SF+ | 7.50% | | 3/15/2026 | 21,222 | | 21,014 | | 21,222 | |
| | | | | | | | | | | | | 20,990 | | 21,222 | |
| Metalforming Holdings, LLC | | Distributor of Sheet Metal Folding and Metal Forming Equipment | | | | | | | | | | | | |
| | | Secured Debt | (30) | 10/19/2022 | | | | | | 10/19/2025 | — | | — | | — | |
| | | Secured Debt | | 10/19/2022 | | 10.75% | | | | 10/19/2027 | 1,663 | | 1,633 | | 1,633 | |
| | | Preferred Equity | (8) | 10/19/2022 | 434,331 | 8.00% | | | 8.00% | | | 434 | | 460 | |
| | | Common Stock | | 10/19/2022 | 112,865 | | | | | | | 113 | | 290 | |
| | | | | | | | | | | | | 2,180 | | 2,383 | |
| Microbe Formulas, LLC | (10) | Nutritional Supplements Provider | | | | | | | | | | | | |
| | | Secured Debt | (9) (30) | 4/4/2022 | | | SF+ | 6.00% | | 4/3/2028 | — | | (5) | | (5) | |
| | | Secured Debt | (9) | 4/4/2022 | | 10.95% | SF+ | 6.00% | | 4/3/2028 | 2,497 | | 2,466 | | 2,497 | |
| | | | | | | | | | | | | 2,461 | | 2,492 | |
| Mills Fleet Farm Group, LLC | (10) | Omnichannel Retailer of Work, Farm and Lifestyle Merchandise | | | | | | | | | | | | |
| | | Secured Debt | (9) | 10/24/2018 | | 12.56% | SF+ | 7.00% | | 12/31/2026 | 18,152 | | 17,935 | | 16,242 | |
| | | | | | | | | | | | | | |
| Mini Melts of America, LLC | (10) | Manufacturer and Distributor of Branded Premium Beaded Ice Cream | | | | | | | | | | | | |
| | | Secured Debt | (9) (28) | 11/30/2023 | | 11.37% | SF+ | 6.25% | | 11/30/2028 | 975 | | 951 | | 975 | |
| | | Secured Debt | (9) (26) | 11/30/2023 | | 11.33% | SF+ | 6.25% | | 11/30/2028 | 860 | | 842 | | 860 | |
| | | Secured Debt | (9) | 11/30/2023 | | 10.31% | SF+ | 5.25% | | 11/30/2028 | 3,209 | | 3,144 | | 3,209 | |
| | | Secured Debt | (9) | 11/30/2023 | | 12.31% | SF+ | 7.25% | | 11/30/2028 | 3,209 | | 3,142 | | 3,209 | |
| | | Common Equity | | 11/30/2023 | 300,000 | | | | | | | 300 | | 300 | |
| | | | | | | | | | | | | 8,379 | | 8,553 | |
| MoneyThumb Acquisition, LLC | | Provider of Software-as-a-Service Financial File Conversion and Reconciliation | | | | | | | | | | | | |
| | | Secured Debt | | 8/19/2024 | | 14.00% | | | | 8/19/2029 | 2,400 | | 2,186 | | 2,186 | |
| | | Preferred Member Units | (8) | 8/19/2024 | 40,821 | 12.00% | | | 12.00% | | | 414 | | 414 | |
| | | Warrants | (27) | 8/19/2024 | 14,842 | | | | | | | 148 | | 148 | |
| | | | | | | | | | | | | 2,748 | | 2,748 | |
| MonitorUS Holding, LLC | (10) (13) (21) | SaaS Provider of Media Intelligence Services | | | | | | | | | | | | |
| | | Secured Debt | | 5/24/2022 | | 14.00% | | | 4.00% | 5/24/2027 | 1,155 | | 1,143 | | 1,181 | |
| | | Secured Debt | | 5/24/2022 | | 14.00% | | | 4.00% | 5/24/2027 | 3,002 | | 2,970 | | 3,319 | |
| | | Secured Debt | | 5/24/2022 | | 14.00% | | | 4.00% | 5/24/2027 | 5,109 | | 5,057 | | 5,109 | |
MSC INCOME FUND, INC.
Consolidated Schedule of Investments (Continued)
September 30, 2024
(dollars in thousands)
(Unaudited)
| | | | | | | | | | | | | | | | | | | | | | | | | | | | | | | | | | | | | | | | | | | | |
| Portfolio Company (1) (20) | | Business Description | Type of Investment (2) (3) (15) | | Investment Date (22) | Shares/Units | Total Rate | Reference Rate and Spread (25) | PIK Rate (19) | Maturity Date | Principal (4) | Cost (4) | Fair Value (18) |
| | | Unsecured Debt | | 11/14/2023 | | 8.00% | | | 8.00% | 3/31/2025 | 32 | | 32 | | 32 | |
| | | Unsecured Debt | | 3/15/2024 | | 8.00% | | | 8.00% | 6/30/2025 | 16 | | 16 | | 16 | |
| | | Unsecured Debt | | 9/25/2024 | | 8.00% | | | 8.00% | 12/21/2025 | 30 | | 30 | | 30 | |
| | | Common Stock | | 8/30/2022 | 12,798,820 | | | | | | | 256 | | 211 | |
| | | | | | | | | | | | | 9,504 | | 9,898 | |
| NinjaTrader, LLC | (10) | Operator of Futures Trading Platform | | | | | | | | | | | | |
| | | Secured Debt | (9) (30) | 12/18/2019 | | | SF+ | 6.50% | | 12/18/2026 | — | | (3) | | (3) | |
| | | Secured Debt | (9) | 12/18/2019 | | 11.98% | SF+ | 6.50% | | 12/18/2026 | 14,651 | | 14,521 | | 14,651 | |
| | | | | | | | | | | | | 14,518 | | 14,648 | |
| Obra Capital, Inc. | (10) | Provider of Asset Management Services Specialized in Insurance-Linked Strategies | | | | | | | | | | | | |
| | | Secured Debt | (9) (30) | 6/21/2024 | | | SF+ | 7.50% | | 12/21/2028 | — | | (14) | | (14) | |
| | | Secured Debt | (9) | 6/21/2024 | | 12.53% | SF+ | 7.50% | | 6/21/2029 | 11,979 | | 11,643 | | 11,514 | |
| | | | | | | | | | | | | 11,629 | | 11,500 | |
| OnPoint | (10) | Environmental & Facilities Services | | | | | | | | | | | | |
| | | Secured Debt | (9) | 4/1/2024 | | 11.60% | SF+ | 7.00% | | 11/16/2027 | 2,910 | | 2,886 | | 2,886 | |
| | | | | | | | | | | | | | |
| Peaches Holding Corporation | | Wholesale Provider of Consumer Packaging Solutions | | | | | | | | | | | | |
| | | Common Equity | | 5/22/2024 | 806 | | | | | | | 1,805 | | 1,805 | |
| | | | | | | | | | | | | | |
| Power System Solutions | (10) | Backup Power Generation | | | | | | | | | | | | |
| | | Secured Debt | (9) (30) | 6/7/2023 | | | SF+ | 6.50% | | 6/7/2028 | — | | (29) | | (29) | |
| | | Secured Debt | (9) | 6/7/2023 | | 11.35% | SF+ | 6.50% | | 6/7/2028 | 2,646 | | 2,583 | | 2,646 | |
| | | Secured Debt | (9) | 6/7/2023 | | 11.60% | SF+ | 6.50% | | 6/7/2028 | 7,879 | | 7,705 | | 7,879 | |
| | | Common Equity | | 6/7/2023 | 532 | | | | | | | 532 | | 1,360 | |
| | | | | | | | | | | | | 10,791 | | 11,856 | |
| PrimeFlight Aviation Services | (10) | Air Freight & Logistics | | | | | | | | | | | | |
| | | Secured Debt | (9) | 5/1/2023 | | 10.58% | SF+ | 5.50% | | 5/1/2029 | 5,925 | | 5,757 | | 5,925 | |
| | | Secured Debt | (9) | 9/7/2023 | | 10.10% | SF+ | 5.50% | | 5/1/2029 | 566 | | 548 | | 566 | |
| | | Secured Debt | (9) | 1/30/2024 | | 10.10% | SF+ | 5.50% | | 5/1/2029 | 569 | | 556 | | 569 | |
| | | Secured Debt | (9) | 6/28/2024 | | 9.85% | SF+ | 5.25% | | 5/1/2029 | 646 | | 637 | | 646 | |
| | | | | | | | | | | | | 7,498 | | 7,706 | |
| PTL US Bidco, Inc | (10) (13) (21) | Manufacturers of Equipment, Including Drilling Rigs and Equipment, and Providers of Supplies and Services to Companies Involved in the Drilling, Evaluation and Completion of Oil and Gas Wells | | | | | | | | | | | | |
| | | Secured Debt | (9) (28) | 8/19/2022 | | 12.19% | SF+ | 6.75% | | 8/19/2027 | 448 | | 441 | | 442 | |
| | | Secured Debt | (9) | 8/19/2022 | | 12.13% | SF+ | 6.75% | | 8/19/2027 | 1,422 | | 1,404 | | 1,403 | |
MSC INCOME FUND, INC.
Consolidated Schedule of Investments (Continued)
September 30, 2024
(dollars in thousands)
(Unaudited)
| | | | | | | | | | | | | | | | | | | | | | | | | | | | | | | | | | | | | | | | | | | | |
| Portfolio Company (1) (20) | | Business Description | Type of Investment (2) (3) (15) | | Investment Date (22) | Shares/Units | Total Rate | Reference Rate and Spread (25) | PIK Rate (19) | Maturity Date | Principal (4) | Cost (4) | Fair Value (18) |
| | | | | | | | | | | | | 1,845 | | 1,845 | |
| Purge Rite, LLC | (10) | HVAC Flushing and Filtration Services | | | | | | | | | | | | |
| | | Secured Debt | (9) (30) | 10/2/2023 | | | SF+ | 8.00% | | 10/2/2028 | — | | (16) | | (16) | |
| | | Secured Debt | (9) | 10/2/2023 | | 13.64% | SF+ | 8.00% | | 10/2/2028 | 3,906 | | 3,828 | | 3,906 | |
| | | Preferred Equity | | 10/2/2023 | 13,021 | | | | | | | 1,289 | | 1,289 | |
| | | Common Equity | | 4/1/2024 | 13,021 | | | | | | | 13 | | 520 | |
| | | | | | | | | | | | | 5,114 | | 5,699 | |
| Richardson Sales Solutions | (10) | Business Services | | | | | | | | | | | | |
| | | Secured Debt | (9) (28) | 8/24/2023 | | 11.92% | SF+ | 6.75% | | 8/24/2028 | 1,333 | | 1,288 | | 1,313 | |
| | | Secured Debt | (9) | 8/24/2023 | | 12.03% | SF+ | 6.75% | | 8/24/2028 | 10,354 | | 10,109 | | 10,194 | |
| | | Secured Debt | (9) | 9/10/2024 | | 11.86% | SF+ | 6.75% | | 8/24/2028 | 5,097 | | 4,997 | | 5,018 | |
| | | | | | | | | | | | | 16,394 | | 16,525 | |
| Roof Opco, LLC | (10) | Residential Re-Roofing/Repair | | | | | | | | | | | | |
| | | Secured Debt | (9) (30) | 8/27/2021 | | | SF+ | 8.00% | | 8/27/2026 | — | | (7) | | — | |
| | | Secured Debt | (9) | 8/27/2021 | | 12.59% | SF+ | 7.00% | | 8/27/2026 | 4,223 | | 4,158 | | 4,057 | |
| | | Secured Debt | (9) | 8/27/2021 | | 14.59% | SF+ | 9.00% | | 8/27/2026 | 4,223 | | 4,158 | | 4,016 | |
| | | | | | | | | | | | | 8,309 | | 8,073 | |
| Rug Doctor, LLC. | (10) | Carpet Cleaning Products and Machinery | | | | | | | | | | | | |
| | | Secured Debt | (9) | 7/16/2021 | | 12.79% | SF+ | 8.00% | 2.00% | 11/16/2025 | 6,509 | | 6,496 | | 6,509 | |
| | | Secured Debt | (9) | 7/16/2021 | | 12.79% | SF+ | 8.00% | 2.00% | 11/16/2025 | 8,465 | | 8,446 | | 8,465 | |
| | | | | | | | | | | | | 14,942 | | 14,974 | |
| Slick Innovations, LLC | | Text Message Marketing Platform | | | | | | | | | | | | |
| | | Secured Debt | | 9/13/2018 | | 14.00% | | | | 12/22/2027 | 4,200 | | 4,087 | | 4,200 | |
| | | Common Stock | (8) | 9/13/2018 | 17,500 | | | | | | | — | | 540 | |
| | | | | | | | | | | | | 4,087 | | 4,740 | |
| South Coast Terminals Holdings, LLC | (10) | Specialty Toll Chemical Manufacturer | | | | | | | | | | | | |
| | | Secured Debt | (9) (30) | 8/8/2024 | | | SF+ | 5.25% | | 8/8/2029 | — | | — | | — | |
| | | Secured Debt | (9) | 8/8/2024 | | 10.20% | SF+ | 5.25% | | 8/8/2029 | 4,388 | | 4,355 | | 4,355 | |
| | | Common Equity | | 12/10/2021 | 61 | | | | | | | 61 | | 59 | |
| | | | | | | | | | | | | 4,416 | | 4,414 | |
| SPAU Holdings, LLC | (10) | Digital Photo Product Provider | | | | | | | | | | | | |
| | | Secured Debt | (9) (28) | 7/1/2022 | | 12.46% | SF+ | 7.50% | | 7/1/2027 | 780 | | 769 | | 780 | |
| | | Secured Debt | (9) | 7/1/2022 | | 12.45% | SF+ | 7.50% | | 7/1/2027 | 4,888 | | 4,834 | | 4,888 | |
| | | Common Stock | | 7/1/2022 | 200,000 | | | | | | | 200 | | 190 | |
| | | | | | | | | | | | | 5,803 | | 5,858 | |
| Tex Tech Tennis, LLC | (10) | Sporting Goods & Textiles | | | | | | | | | | | | |
| | | Preferred Equity | (23) | 7/7/2021 | 1,000,000 | | | | | | | 1,000 | | 2,410 | |
| | | | | | | | | | | | | | |
| The Affiliati Network, LLC | | Performance Marketing Solutions | | | | | | | | | | | | |
MSC INCOME FUND, INC.
Consolidated Schedule of Investments (Continued)
September 30, 2024
(dollars in thousands)
(Unaudited)
| | | | | | | | | | | | | | | | | | | | | | | | | | | | | | | | | | | | | | | | | | | | |
| Portfolio Company (1) (20) | | Business Description | Type of Investment (2) (3) (15) | | Investment Date (22) | Shares/Units | Total Rate | Reference Rate and Spread (25) | PIK Rate (19) | Maturity Date | Principal (4) | Cost (4) | Fair Value (18) |
| | | Secured Debt | (30) | 8/9/2021 | | | | | | 8/9/2026 | — | | (2) | | (2) | |
| | | Secured Debt | | 8/9/2021 | | 10.00% | | | | 8/9/2026 | 1,400 | | 1,388 | | 1,372 | |
| | | Preferred Stock | (8) | 9/1/2023 | 65,427 | | | | | | | 65 | | 65 | |
| | | Preferred Stock | (8) | 8/9/2021 | 320,000 | | | | | | | 1,600 | | 1,600 | |
| | | | | | | | | | | | | 3,051 | | 3,035 | |
| Titan Meter Midco Corp. | (10) | Value Added Distributor of a Variety of Metering and Measurement Products and Solutions to the Energy Industry | | | | | | | | | | | | |
| | | Secured Debt | (9) (30) | 3/11/2024 | | | SF+ | 6.50% | | 3/11/2029 | — | | (43) | | (43) | |
| | | Secured Debt | (9) | 3/11/2024 | | 11.10% | SF+ | 6.50% | | 3/11/2029 | 13,082 | | 12,676 | | 12,844 | |
| | | Preferred Equity | | 3/11/2024 | 468,750 | 8.00% | | | 8.00% | | | 469 | | 469 | |
| | | | | | | | | | | | | 13,102 | | 13,270 | |
| U.S. TelePacific Corp. | (11) | Provider of Communications and Managed Services | | | | | | | | | | | | |
| | | Secured Debt | (9) (14) | 6/1/2023 | | 12.50% | SF+ | 7.15% | 6.00% | 5/2/2027 | 6,755 | | 2,458 | | 2,702 | |
| | | Secured Debt | (14) | 6/1/2023 | | | | | | 5/2/2027 | 692 | | 15 | | — | |
| | | | | | | | | | | | | 2,473 | | 2,702 | |
| UPS Intermediate, LLC | (10) | Provider of Maintenance, Repair, and Overhaul Services for Industrial Equipment Serving the Refining, Chemical, Midstream, Renewables, Power, and Utilities End Markets | | | | | | | | | | | | |
| | | Secured Debt | (9) | 7/29/2024 | | 11.51% | SF+ | 6.25% | | 7/27/2029 | 19,539 | | 19,147 | | 19,147 | |
| | | Common Equity | | 7/29/2024 | 412,371 | | | | | | | 412 | | 412 | |
| | | | | | | | | | | | | 19,559 | | 19,559 | |
| Urgent DSO LLC | | General and Emergency Dentistry Practice | | | | | | | | | | | | |
| | | Secured Debt | | 2/16/2024 | | 13.50% | | | | 2/16/2029 | 2,200 | | 2,142 | | 2,142 | |
| | | Preferred Equity | (8) | 2/16/2024 | 1,000 | 9.00% | | | 9.00% | | | 1,057 | | 1,057 | |
| | | | | | | | | | | | | 3,199 | | 3,199 | |
| UserZoom Technologies, Inc. | (10) | Provider of User Experience Research Automation Software | | | | | | | | | | | | |
| | | Secured Debt | (9) | 1/11/2023 | | 12.75% | SF+ | 7.50% | | 4/5/2029 | 3,000 | | 2,934 | | 3,000 | |
| | | | | | | | | | | | | | |
| Vistar Media, Inc. | (10) | Operator of Digital Out-of-Home Advertising Platform | | | | | | | | | | | | |
| | | Preferred Stock | | 4/3/2019 | 70,207 | | | | | | | 767 | | 3,180 | |
| | | | | | | | | | | | | | |
| Vitesse Systems | (10) | Component Manufacturing and Machining Platform | | | | | | | | | | | | |
| | | Secured Debt | (9) (32) | 12/22/2023 | | 12.47% | | | | 12/22/2028 | 1,705 | | 1,666 | | 1,705 | |
| | | Secured Debt | (9) | 12/22/2023 | | 11.96% | SF+ | 7.00% | | 12/22/2028 | 12,406 | | 12,146 | | 12,406 | |
MSC INCOME FUND, INC.
Consolidated Schedule of Investments (Continued)
September 30, 2024
(dollars in thousands)
(Unaudited)
| | | | | | | | | | | | | | | | | | | | | | | | | | | | | | | | | | | | | | | | | | | | |
| Portfolio Company (1) (20) | | Business Description | Type of Investment (2) (3) (15) | | Investment Date (22) | Shares/Units | Total Rate | Reference Rate and Spread (25) | PIK Rate (19) | Maturity Date | Principal (4) | Cost (4) | Fair Value (18) |
| | | | | | | | | | | | | 13,812 | | 14,111 | |
| VORTEQ Coil Finishers, LLC | (10) | Specialty Coating of Aluminum and Light-Gauge Steel | | | | | | | | | | | | |
| | | Common Equity | (8) | 11/30/2021 | 769,231 | | | | | | | 769 | | 1,910 | |
| | | | | | | | | | | | | | |
| Wall Street Prep, Inc. | (10) | Financial Training Services | | | | | | | | | | | | |
| | | Secured Debt | (9) (30) | 7/19/2021 | | | SF+ | 7.00% | | 7/19/2026 | — | | (4) | | (4) | |
| | | Secured Debt | (9) | 7/19/2021 | | 12.48% | SF+ | 7.00% | | 7/19/2026 | 3,733 | | 3,702 | | 3,733 | |
| | | Common Stock | | 7/19/2021 | 500,000 | | | | | | | 500 | | 1,160 | |
| | | | | | | | | | | | | 4,198 | | 4,889 | |
| Watterson Brands, LLC | (10) | Facility Management Services | | | | | | | | | | | | |
| | | Secured Debt | | 12/17/2021 | | 12.00% | | | 4.00% | 12/17/2026 | 306 | | 303 | | 290 | |
| | | Secured Debt | | 12/17/2021 | | 12.00% | | | 4.00% | 12/17/2026 | 53 | | 48 | | 50 | |
| | | Secured Debt | | 12/17/2021 | | 12.00% | | | 4.00% | 12/17/2026 | 2,177 | | 2,162 | | 2,059 | |
| | | Secured Debt | | 12/17/2021 | | 12.00% | | | 4.00% | 12/17/2026 | 1,965 | | 1,951 | | 1,858 | |
| | | | | | | | | | | | | 4,464 | | 4,257 | |
| West Star Aviation Acquisition, LLC | (10) | Aircraft, Aircraft Engine and Engine Parts | | | | | | | | | | | | |
| | | Secured Debt | (9) (26) | 3/1/2022 | | 9.60% | SF+ | 5.00% | | 3/1/2028 | 662 | | 652 | | 662 | |
| | | Secured Debt | (9) | 3/1/2022 | | 9.60% | SF+ | 5.00% | | 3/1/2028 | 2,925 | | 2,888 | | 2,925 | |
| | | Secured Debt | (9) | 11/3/2023 | | 9.60% | SF+ | 5.00% | | 3/1/2028 | 1,456 | | 1,430 | | 1,456 | |
| | | Common Stock | (8) | 3/1/2022 | 200,000 | | | | | | | 200 | | 590 | |
| | | | | | | | | | | | | 5,170 | | 5,633 | |
| Winter Services LLC | (10) | Provider of Snow Removal and Ice Management Services | | | | | | | | | | | | |
| | | Secured Debt | (9) | 11/19/2021 | | 13.59% | SF+ | 8.00% | | 11/19/2026 | 833 | | 778 | | 800 | |
| | | Secured Debt | (9) | 11/19/2021 | | 13.59% | SF+ | 8.00% | | 11/19/2026 | 2,343 | | 2,305 | | 2,248 | |
| | | Secured Debt | (9) | 1/16/2024 | | 12.59% | SF+ | 7.00% | | 11/19/2026 | 9,050 | | 8,892 | | 8,684 | |
| | | Secured Debt | (9) | 1/16/2024 | | 14.59% | SF+ | 9.00% | | 11/19/2026 | 9,050 | | 8,892 | | 8,684 | |
| | | | | | | | | | | | | 20,867 | | 20,416 | |
| World Micro Holdings, LLC | | Supply Chain Management | | | | | | | | | | | | |
| | | Secured Debt | | 12/12/2022 | | 13.00% | | | | 12/12/2027 | 1,606 | | 1,586 | | 1,586 | |
| | | Preferred Equity | (8) | 12/12/2022 | 530 | | | | | | | 530 | | 530 | |
| | | | | | | | | | | | | 2,116 | | 2,116 | |
| Xenon Arc, Inc. | (10) | Tech-enabled Distribution Services to Chemicals and Food Ingredients Primary Producers | | | | | | | | | | | | |
| | | Secured Debt | (9) | 12/17/2021 | | 10.16% | SF+ | 5.25% | | 12/20/2028 | 1,179 | | 1,159 | | 1,179 | |
| | | Secured Debt | (9) | 12/17/2021 | | 10.63% | SF+ | 5.25% | | 12/20/2028 | 2,334 | | 2,309 | | 2,334 | |
| | | | | | | | | | | | | 3,468 | | 3,513 | |
| YS Garments, LLC | (11) | Designer and Provider of Branded Activewear | | | | | | | | | | | | |
| | | Secured Debt | (9) | 8/22/2018 | | 12.89% | SF+ | 7.50% | | 8/9/2026 | 5,153 | | 5,087 | | 4,699 | |
MSC INCOME FUND, INC.
Consolidated Schedule of Investments (Continued)
September 30, 2024
(dollars in thousands)
(Unaudited)
| | | | | | | | | | | | | | | | | | | | | | | | | | | | | | | | | | | | | | | | | | | | |
| Portfolio Company (1) (20) | | Business Description | Type of Investment (2) (3) (15) | | Investment Date (22) | Shares/Units | Total Rate | Reference Rate and Spread (25) | PIK Rate (19) | Maturity Date | Principal (4) | Cost (4) | Fair Value (18) |
| | | | | | | | | | | | | | |
| Zips Car Wash, LLC | (10) | Express Car Wash Operator | | | | | | | | | | | | |
| | | Secured Debt | (9) (26) | 2/11/2022 | | 12.46% | SF+ | 7.25% | 1.50% | 12/31/2024 | 2,360 | | 2,360 | | 2,219 | |
| | | Secured Debt | (9) (26) | 2/11/2022 | | 12.46% | SF+ | 7.25% | 1.50% | 12/31/2024 | 591 | | 591 | | 555 | |
| | | | | | | | | | | | | 2,951 | | 2,774 | |
| ZRG Partners, LLC | (10) | Talent Advisory Services Provider | | | | | | | | | | | | |
| | | Secured Debt | (9) (30) | 6/14/2024 | | | SF+ | 6.00% | | 6/14/2029 | — | | (29) | | (29) | |
| | | Secured Debt | (9) | 6/14/2024 | | | SF+ | 6.00% | | 6/14/2029 | 630 | | 598 | | 613 | |
| | | Secured Debt | (9) | 6/14/2024 | | 11.26% | SF+ | 6.00% | | 6/14/2029 | 995 | | 977 | | 969 | |
| | | Secured Debt | (9) | 6/14/2024 | | 11.30% | SF+ | 6.00% | | 6/14/2029 | 7,133 | | 7,000 | | 6,944 | |
| | | | | | | | | | | | | 8,546 | | 8,497 | |
Subtotal Non-Control/Non-Affiliate Investments (127.8% of net assets at fair value) | | | | | | | | | | | | | $ | 836,194 | | $ | 790,604 | |
Total Portfolio Investments, September 30, 2024 (188.0% of net assets at fair value) | | | | | | | | | | | | | $ | 1,132,577 | | $ | 1,162,627 | |
| | | | | | | | | | | | | | |
| Money market funds (included in cash and cash equivalents) | | | | | | | | | | | | | | |
| First American Treasury Obligations Fund Class Z | (16) | | | | | | | | | | | | $ | 10,798 | | $ | 10,798 | |
| Fidelity Government Portfolio Fund Class III | (34) | | | | | | | | | | | | 20,397 | | 20,397 | |
| Total money market funds | | | | | | | | | | | | | $ | 31,195 | | $ | 31,195 | |
_____________________________
(1)All investments are Lower Middle Market portfolio investments, unless otherwise noted. See Note C — Fair Value Hierarchy for Investments — Portfolio Composition for a description of Lower Middle Market portfolio investments. All of the Company’s investments, unless otherwise noted, are encumbered as security for one of the Company’s Credit Facilities.
(2)Debt investments are income producing, unless otherwise noted by footnote (14), as described below. Equity and warrants are non-income producing, unless otherwise noted by footnote (8), as described below.
(3)See Note C — Fair Value Hierarchy for Investments — Portfolio Composition and Schedule 12-14 for a summary of geographic location of portfolio companies.
(4)Principal is net of repayments. Cost is net of repayments and accumulated unearned income. Negative cost is the result of the capitalized discount being greater than the principal amount outstanding on the loan.
(5)Control investments are defined by the 1940 Act as investments in which more than 25% of the voting securities are owned or where the ability to nominate greater than 50% of the board representation is maintained.
(6)Affiliate investments are defined by the 1940 Act as investments in which between 5% and 25% (inclusive) of the voting securities are owned and the investments are not classified as Control investments.
(7)Non-Control/Non-Affiliate investments are defined by the 1940 Act as investments that are neither Control investments nor Affiliate investments.
(8)Income producing through dividends or distributions.
(9)Index based floating interest rate is subject to contractual minimum interest rate. As noted in this schedule, 96% of the loans (based on the par amount) contain Term SOFR (“SOFR”) floors which range between 0.75% and 5.25%, with a weighted-average floor of 1.25%.
MSC INCOME FUND, INC.
Consolidated Schedule of Investments (Continued)
September 30, 2024
(dollars in thousands)
(Unaudited)
(10)Private Loan portfolio investment. See Note C—Fair Value Hierarchy for Investments—Portfolio Composition for a description of Private Loan portfolio investments.
(11)Middle Market portfolio investment. See Note C—Fair Value Hierarchy for Investments—Portfolio Composition for a description of Middle Market portfolio investments.
(12)Other Portfolio investment. See Note C—Fair Value Hierarchy for Investments—Portfolio Composition for a description of Other Portfolio investments.
(13)Investment is not a qualifying asset as defined under Section 55(a) of the 1940 Act. Qualifying assets must represent at least 70% of total assets at the time of acquisition of any additional non-qualifying assets.
(14)Non-accrual and non-income producing debt investment.
(15)All of the Company’s portfolio investments are generally subject to restrictions on resale as “restricted securities.”
(16)Effective yield as of September 30, 2024 was approximately 4.97% on the First American Treasury Obligations Fund Class Z.
(17)Maturity date is under on-going negotiations with the portfolio company and other lenders, if applicable.
(18)Investment fair value was determined using significant unobservable inputs, unless otherwise noted. See Note C—Fair Value Hierarchy for Investments—Portfolio Composition for further discussion. Negative fair value is the result of the capitalized discount on the loan or the unfunded commitment being valued below par.
(19)Investments may have a portion, or all, of their income received from Paid-in-Kind (“PIK”) interest or dividends. PIK interest income and cumulative dividend income represent income not paid currently in cash. The difference between the Total Rate and PIK Rate represents the cash rate as of September 30, 2024.
(20)All portfolio company headquarters are based in the United States, unless otherwise noted.
(21)Portfolio company headquarters are located outside of the United States.
(22)Investment date represents the date of initial investment in the security position.
(23)Shares/Units represent ownership in a related Real Estate or HoldCo entity.
(24)Investment is not unitized. Presentation is made in percent of fully diluted ownership unless otherwise indicated.
(25)A majority of the variable rate loans in the Company’s Investment Portfolio (defined below) bear interest at a rate that may be determined by reference to either SOFR (“SF”) or an alternate base rate (commonly based on the Federal Funds Rate or the Prime rate (“P”)), which typically resets every one, three, or six months at the borrower’s option. SOFR based contracts may include a credit spread adjustment (the “Adjustment”) that is charged in addition to the stated spread. The Adjustment is applied when the SOFR rate, plus the Adjustment, exceeds the stated floor rate, as applicable. As of September 30, 2024, SOFR based contracts in the portfolio had Adjustments ranging from 0.10% to 0.43%.
(26)Each new draw or funding on the facility has a different floating rate reset date. The rate presented represents a weighted-average rate for borrowings under the facility, as of September 30, 2024.
(27)Warrants are presented in equivalent shares/units with a strike price of $0.01 per share/unit.
(28)RLOC facility permits the borrower to make an interest rate election regarding the base rate on each draw under the facility. The rate presented represents a weighted-average rate for borrowings under the facility, as of September 30, 2024.
(29)Index based floating interest rate is subject to contractual maximum base rate of 3.00%.
(30)The position is unfunded and no interest income is being earned as of September 30, 2024. The position may earn a nominal unused facility fee on committed amounts.
(31)Warrants are presented in equivalent shares/units with a strike price of $1.00 per share/unit.
(32)RLOC facility permits the borrower to make an interest rate election regarding the base rate on each draw under the facility. As of September 30, 2024, the facility had contracts running under the terms SF+7.00% (Floor 1.00%) and P+6.00% (Floor 2.00%). The rate presented represents a weighted-average rate for borrowings under the facility, as of September 30, 2024.
MSC INCOME FUND, INC.
Consolidated Schedule of Investments (Continued)
September 30, 2024
(dollars in thousands)
(Unaudited)
(33)The Company has entered into an intercreditor agreement that entitles the Company to the “last out” tranche of the first lien secured loans, whereby the “first out” tranche will receive priority as to the “last out” tranche with respect to payments of principal, interest, and any other amounts due thereunder. Therefore, the Company receives a higher interest rate than the contractual stated interest rate of 11.75% per the credit agreement and the Consolidated Schedule of Investments above reflects such higher rate.
(34)Effective yield as of September 30, 2024 was approximately 4.58% on the Fidelity Government Portfolio Fund Class III.
MSC INCOME FUND, INC.
Consolidated Schedule of Investments
December 31, 2023
(dollars in thousands)
| | | | | | | | | | | | | | | | | | | | | | | | | | | | | | | | | | | | | | | | | | | | |
| Portfolio Company (1) (20) | | Business Description | Type of Investment (2) (3) (15) | | Investment Date (22) | Shares/Units | Total Rate | Reference Rate and Spread (25) | PIK Rate (19) | Maturity Date | Principal (4) | Cost (4) | Fair Value (18) |
| Control Investments (5) | | | | | | | | | | | | | | |
| Copper Trail Fund Investments | (12) (13) | Investment Partnership | | | | | | | | | | | | |
| | | LP Interests (CTMH, LP) | (8) (24) | 7/17/2017 | 38.8% | | | | | | | $ | 693 | | $ | 568 | |
| | | | | | | | | | | | | | |
| GRT Rubber Technologies LLC | | Manufacturer of Engineered Rubber Products | | | | | | | | | | | | |
| | | Secured Debt | | 12/21/2018 | | 11.48% | SF+ | 6.00% | | 10/29/2026 | 1,182 | | 1,173 | | 1,182 | |
| | | Secured Debt | | 12/19/2014 | | 13.48% | SF+ | 8.00% | | 10/29/2026 | 19,944 | | 19,803 | | 19,944 | |
| | | Member Units | | 12/19/2014 | 2,896 | | | | | | | 6,435 | | 21,890 | |
| | | | | | | | | | | | | 27,411 | | 43,016 | |
| Harris Preston Fund Investments | (12) (13) | Investment Partnership | | | | | | | | | | | | |
| | | LP Interests (2717 MH, L.P.) | (8) (24) | 10/1/2017 | 49.3% | | | | | | | 3,345 | | 6,050 | |
| | | | | | | | | | | | | | |
| Volusion, LLC | | Provider of Online Software-as-a-Service eCommerce Solutions | | | | | | | | | | | | |
| | | Secured Debt | | 3/31/2023 | | 10.00% | | | | 3/31/2025 | 900 | | 900 | | 900 | |
| | | Preferred Member Units | | 3/31/2023 | 2,184,683 | | | | | | | 3,706 | | 3,110 | |
| | | Preferred Member Units | | 3/31/2023 | 61,077 | | | | | | | — | | — | |
| | | Preferred Member Units | | 1/26/2015 | 2,090,001 | | | | | | | 6,000 | | — | |
| | | Common Stock | | 3/31/2023 | 772,620 | | | | | | | 1,104 | | — | |
| | | | | | | | | | | | | 11,710 | | 4,010 | |
Subtotal Control Investments (8.6% of net assets at fair value) | | | | | | | | | | | | | $ | 43,159 | | $ | 53,644 | |
| Affiliate Investments (6) | | | | | | | | | | | | | | |
| Analytical Systems Keco Holdings, LLC | | Manufacturer of Liquid and Gas Analyzers | | | | | | | | | | | | |
| | | Secured Debt | (9) | 8/16/2019 | | 15.38% | SF+ | 10.00% | | 8/16/2024 | $ | 55 | | $ | 54 | | $ | 54 | |
| | | Secured Debt | (9) | 8/16/2019 | | 15.38% | SF+ | 10.00% | | 8/16/2024 | 1,031 | | 1,020 | | 1,020 | |
| | | Preferred Member Units | | 5/20/2021 | 607 | | | | | | | 607 | | 1,210 | |
| | | Preferred Member Units | | 8/16/2019 | 800 | 14.13% | | | | | | 800 | | — | |
| | | Warrants | (27) | 8/16/2019 | 105 | | | | | 8/16/2029 | | 79 | | — | |
| | | | | | | | | | | | | 2,560 | | 2,284 | |
| Barfly Ventures, LLC | (10) | Casual Restaurant Group | | | | | | | | | | | | |
| | | Member Units | | 10/26/2020 | 12 | | | | | | | 528 | | 1,380 | |
| | | | | | | | | | | | | | |
| Batjer TopCo, LLC | | HVAC Mechanical Contractor | | | | | | | | | | | | |
| | | Secured Debt | (37) | 3/7/2022 | | | | | | 3/7/2027 | — | | (1) | | — | |
| | | Secured Debt | | 3/7/2022 | | 10.00% | | | | 3/7/2027 | 30 | | 30 | | 30 | |
| | | Secured Debt | | 3/7/2022 | | 10.00% | | | | 3/7/2027 | 1,175 | | 1,160 | | 1,175 | |
| | | Preferred Stock | (8) | 3/7/2022 | 453 | | | | | | | 455 | | 680 | |
| | | | | | | | | | | | | 1,644 | | 1,885 | |
MSC INCOME FUND, INC.
Consolidated Schedule of Investments (Continued)
December 31, 2023
(dollars in thousands)
| | | | | | | | | | | | | | | | | | | | | | | | | | | | | | | | | | | | | | | | | | | | |
| Portfolio Company (1) (20) | | Business Description | Type of Investment (2) (3) (15) | | Investment Date (22) | Shares/Units | Total Rate | Reference Rate and Spread (25) | PIK Rate (19) | Maturity Date | Principal (4) | Cost (4) | Fair Value (18) |
| Brewer Crane Holdings, LLC | | Provider of Crane Rental and Operating Services | | | | | | | | | | | | |
| | | Secured Debt | (9) | 1/9/2018 | | 15.46% | L+ | 10.00% | | 1/9/2025 | 1,375 | | 1,375 | | 1,374 | |
| | | Preferred Member Units | (8) | 1/9/2018 | 737 | | | | | | | 1,070 | | 1,400 | |
| | | | | | | | | | | | | 2,445 | | 2,774 | |
| Centre Technologies Holdings, LLC | | Provider of IT Hardware Services and Software Solutions | | | | | | | | | | | | |
| | | Secured Debt | (9) (37) | 1/4/2019 | | | SF+ | 9.00% | | 1/4/2026 | — | | — | | — | |
| | | Secured Debt | (9) | 1/4/2019 | | 14.48% | SF+ | 9.00% | | 1/4/2026 | 4,394 | | 4,364 | | 4,394 | |
| | | Preferred Member Units | | 1/4/2019 | 3,327 | | | | | | | 1,531 | | 2,760 | |
| | | | | | | | | | | | | 5,895 | | 7,154 | |
| Chamberlin Holding LLC | | Roofing and Waterproofing Specialty Contractor | | | | | | | | | | | | |
| | | Secured Debt | (9) (37) | 2/26/2018 | | | SF+ | 6.00% | | 2/26/2026 | — | | (49) | | — | |
| | | Secured Debt | (9) | 2/26/2018 | | 13.49% | SF+ | 8.00% | | 2/26/2026 | 3,905 | | 3,903 | | 3,905 | |
| | | Member Units | (8) | 2/26/2018 | 1,087 | | | | | | | 2,860 | | 7,330 | |
| | | Member Units | (8) (23) | 11/2/2018 | 261,786 | | | | | | | 443 | | 715 | |
| | | | | | | | | | | | | 7,157 | | 11,950 | |
| Charps, LLC | | Pipeline Maintenance and Construction | | | | | | | | | | | | |
| | | Preferred Member Units | (8) | 2/3/2017 | 457 | | | | | | | 491 | | 3,920 | |
| | | | | | | | | | | | | | |
| Clad-Rex Steel, LLC | | Specialty Manufacturer of Vinyl-Clad Metal | | | | | | | | | | | | |
| | | Secured Debt | | 12/20/2016 | | 11.50% | | | | 1/15/2024 | 2,140 | | 2,140 | | 2,103 | |
| | | Secured Debt | | 12/20/2016 | | 10.00% | | | | 12/20/2036 | 253 | | 251 | | 251 | |
| | | Member Units | (8) | 12/20/2016 | 179 | | | | | | | 1,820 | | 1,300 | |
| | | Member Units | (23) | 12/20/2016 | 200 | | | | | | | 127 | | 282 | |
| | | | | | | | | | | | | 4,338 | | 3,936 | |
| Cody Pools, Inc. | | Designer of Residential and Commercial Pools | | | | | | | | | | | | |
| | | Secured Debt | (37) | 3/6/2020 | | | | | | 12/17/2026 | — | | (2) | | — | |
| | | Secured Debt | | 3/6/2020 | | 12.50% | | | | 12/17/2026 | 7,111 | | 7,089 | | 7,111 | |
| | | Preferred Member Units | (8) (23) | 3/6/2020 | 147 | | | | | | | 2,079 | | 18,120 | |
| | | | | | | | | | | | | 9,166 | | 25,231 | |
| Colonial Electric Company LLC | | Provider of Electrical Contracting Services | | | | | | | | | | | | |
| | | Secured Debt | (37) | 3/31/2021 | | | | | | 3/31/2026 | — | | — | | — | |
| | | Secured Debt | | 3/31/2021 | | 12.00% | | | | 3/31/2026 | 5,513 | | 5,448 | | 5,407 | |
| | | Preferred Member Units | | 6/27/2023 | 240 | | | | | | | 240 | | 600 | |
| | | Preferred Member Units | | 3/31/2021 | 4,320 | | | | | | | 1,920 | | 1,920 | |
| | | | | | | | | | | | | 7,608 | | 7,927 | |
| Compass Systems & Sales, LLC | | Designer of End-to-End Material Handling Solutions | | | | | | | | | | | | |
MSC INCOME FUND, INC.
Consolidated Schedule of Investments (Continued)
December 31, 2023
(dollars in thousands)
| | | | | | | | | | | | | | | | | | | | | | | | | | | | | | | | | | | | | | | | | | | | |
| Portfolio Company (1) (20) | | Business Description | Type of Investment (2) (3) (15) | | Investment Date (22) | Shares/Units | Total Rate | Reference Rate and Spread (25) | PIK Rate (19) | Maturity Date | Principal (4) | Cost (4) | Fair Value (18) |
| | | Secured Debt | (37) | 11/22/2023 | | | | | | 11/22/2028 | — | | — | | — | |
| | | Secured Debt | | 11/22/2023 | | 13.50% | | | | 11/22/2028 | 4,300 | | 4,175 | | 4,175 | |
| | | Preferred Equity | | 11/22/2023 | 1,863 | | | | | | | 1,863 | | 1,863 | |
| | | | | | | | | | | | | 6,038 | | 6,038 | |
| Datacom, LLC | | Technology and Telecommunications Provider | | | | | | | | | | | | |
| | | Secured Debt | | 3/1/2022 | | 7.50% | | | | 12/31/2025 | 50 | | 49 | | 49 | |
| | | Secured Debt | | 3/31/2021 | | 10.00% | | | | 12/31/2025 | 928 | | 887 | | 844 | |
| | | Preferred Member Units | | 3/31/2021 | 1,000 | | | | | | | 290 | | 10 | |
| | | | | | | | | | | | | 1,226 | | 903 | |
| Digital Products Holdings LLC | | Designer and Distributor of Consumer Electronics | | | | | | | | | | | | |
| | | Secured Debt | (9) | 4/1/2018 | | 15.38% | SF+ | 10.00% | | 4/27/2026 | 3,718 | | 3,689 | | 3,673 | |
| | | Preferred Member Units | (8) | 4/1/2018 | 964 | | | | | | | 2,375 | | 2,459 | |
| | | | | | | | | | | | | 6,064 | | 6,132 | |
| Direct Marketing Solutions, Inc. | | Provider of Omni-Channel Direct Marketing Services | | | | | | | | | | | | |
| | | Secured Debt | | 2/13/2018 | | 14.00% | | | | 2/13/2026 | 217 | | 213 | | 217 | |
| | | Secured Debt | | 12/27/2022 | | 14.00% | | | | 2/13/2026 | 5,002 | | 4,974 | | 5,002 | |
| | | Preferred Stock | (8) | 2/13/2018 | 2,100 | | | | | | | 2,100 | | 5,180 | |
| | | | | | | | | | | | | 7,287 | | 10,399 | |
| Flame King Holdings, LLC | | Propane Tank and Accessories Distributor | | | | | | | | | | | | |
| | | Preferred Equity | (8) | 10/29/2021 | 2,340 | | | | | | | 2,600 | | 6,970 | |
| | | | | | | | | | | | | | |
| Freeport Financial Funds | (12) (13) | Investment Partnership | | | | | | | | | | | | |
| | | LP Interests (Freeport First Lien Loan Fund III LP) | (8) (24) | 7/31/2015 | 6.0% | | | | | | | 4,160 | | 3,705 | |
| | | | | | | | | | | | | | |
| Gamber-Johnson Holdings, LLC | | Manufacturer of Ruggedized Computer Mounting Systems | | | | | | | | | | | | |
| | | Secured Debt | (9) (36) (37) | 6/24/2016 | | | SF+ | 7.50% | | 1/1/2028 | — | | — | | — | |
| | | Secured Debt | (9) (36) | 12/15/2022 | | 10.50% | SF+ | 7.50% | | 1/1/2028 | 13,520 | | 13,336 | | 13,520 | |
| | | Member Units | (8) | 6/24/2016 | 2,261 | | | | | | | 4,423 | | 24,180 | |
| | | | | | | | | | | | | 17,759 | | 37,700 | |
| GFG Group, LLC | | Grower and Distributor of a Variety of Plants and Products to Other Wholesalers, Retailers and Garden Centers | | | | | | | | | | | | |
| | | Secured Debt | | 3/31/2021 | | 8.00% | | | | 3/31/2026 | 2,336 | | 2,304 | | 2,336 | |
| | | Preferred Member Units | (8) | 3/31/2021 | 56 | | | | | | | 1,225 | | 2,870 | |
| | | | | | | | | | | | | 3,529 | | 5,206 | |
MSC INCOME FUND, INC.
Consolidated Schedule of Investments (Continued)
December 31, 2023
(dollars in thousands)
| | | | | | | | | | | | | | | | | | | | | | | | | | | | | | | | | | | | | | | | | | | | |
| Portfolio Company (1) (20) | | Business Description | Type of Investment (2) (3) (15) | | Investment Date (22) | Shares/Units | Total Rate | Reference Rate and Spread (25) | PIK Rate (19) | Maturity Date | Principal (4) | Cost (4) | Fair Value (18) |
| Gulf Publishing Holdings, LLC | | Energy Industry Focused Media and Publishing | | | | | | | | | | | | |
| | | Secured Debt | (9) (37) | 9/29/2017 | | | SF+ | 9.50% | | 7/1/2027 | — | | — | | — | |
| | | Secured Debt | | 7/1/2022 | | 12.50% | | | | 7/1/2027 | 600 | | 600 | | 571 | |
| | | Preferred Equity | | 7/1/2022 | 15,930 | | | | | | | 1,400 | | 620 | |
| | | Member Units | | 4/29/2016 | 920 | | | | | | | 920 | | — | |
| | | | | | | | | | | | | 2,920 | | 1,191 | |
| Harris Preston Fund Investments | (12) (13) | Investment Partnership | | | | | | | | | | | | |
| | | LP Interests (HPEP 3, L.P.) | (24) | 8/9/2017 | 8.2% | | | | | | | 2,296 | | 4,225 | |
| | | | | | | | | | | | | | |
| IG Investor, LLC | | Military and Other Tactical Gear | | | | | | | | | | | | |
| | | Secured Debt | (37) | 6/21/2023 | | | | | | 6/21/2028 | — | | (27) | | (27) | |
| | | Secured Debt | | 6/21/2023 | | 13.00% | | | | 6/21/2028 | 9,316 | | 9,069 | | 9,069 | |
| | | Common Equity | | 6/21/2023 | 3,600 | | | | | | | 3,600 | | 3,600 | |
| | | | | | | | | | | | | 12,642 | | 12,642 | |
| Independent Pet Partners Intermediate Holdings, LLC | (10) | Omnichannel Retailer of Specialty Pet Products | | | | | | | | | | | | |
| | | Common Equity | | 4/7/2023 | 6,436,566 | | | | | | | 6,540 | | 6,320 | |
| | | | | | | | | | | | | | |
| Integral Energy Services | (10) | Nuclear Power Staffing Services | | | | | | | | | | | | |
| | | Secured Debt | (9) | 8/20/2021 | | 13.16% | SF+ | 7.50% | | 8/20/2026 | 16,925 | | 16,737 | | 16,232 | |
| | | Preferred Equity | | 12/7/2023 | 3,725 | 10.00% | | | 10.00% | | | 265 | | 350 | |
| | | Common Stock | | 8/20/2021 | 11,647 | | | | | | | 1,584 | | 190 | |
| | | | | | | | | | | | | 18,586 | | 16,772 | |
| Kickhaefer Manufacturing Company, LLC | | Precision Metal Parts Manufacturing | | | | | | | | | | | | |
| | | Secured Debt | | 10/31/2018 | | 12.00% | | | | 10/31/2026 | 4,950 | | 4,933 | | 4,933 | |
| | | Secured Debt | | 10/31/2018 | | 9.00% | | | | 10/31/2048 | 960 | | 951 | | 951 | |
| | | Preferred Equity | | 10/31/2018 | 145 | | | | | | | 3,060 | | 2,420 | |
| | | Member Units | (23) | 10/31/2018 | 200 | | | | | | | 248 | | 683 | |
| | | | | | | | | | | | | 9,192 | | 8,987 | |
| MH Corbin Holding LLC | | Manufacturer and Distributor of Traffic Safety Products | | | | | | | | | | | | |
| | | Secured Debt | (17) | 8/31/2015 | | 13.00% | | | | 12/31/2022 | 1,350 | | 1,350 | | 1,256 | |
| | | Preferred Member Units | | 3/15/2019 | 16,500 | | | | | | | 1,100 | | 80 | |
| | | Preferred Member Units | | 9/1/2015 | 1,000 | | | | | | | 1,500 | | — | |
| | | | | | | | | | | | | 3,950 | | 1,336 | |
| Mystic Logistics Holdings, LLC | | Logistics and Distribution Services Provider for Large Volume Mailers | | | | | | | | | | | | |
| | | Secured Debt | (37) | 8/18/2014 | | | | | | 1/31/2024 | — | | — | | — | |
| | | Secured Debt | | 8/18/2014 | | 10.00% | | | | 1/31/2024 | 1,436 | | 1,436 | | 1,436 | |
MSC INCOME FUND, INC.
Consolidated Schedule of Investments (Continued)
December 31, 2023
(dollars in thousands)
| | | | | | | | | | | | | | | | | | | | | | | | | | | | | | | | | | | | | | | | | | | | |
| Portfolio Company (1) (20) | | Business Description | Type of Investment (2) (3) (15) | | Investment Date (22) | Shares/Units | Total Rate | Reference Rate and Spread (25) | PIK Rate (19) | Maturity Date | Principal (4) | Cost (4) | Fair Value (18) |
| | | Common Stock | (8) | 8/18/2014 | 1,468 | | | | | | | 680 | | 6,598 | |
| | | | | | | | | | | | | 2,116 | | 8,034 | |
| NexRev LLC | | Provider of Energy Efficiency Products & Services | | | | | | | | | | | | |
| | | Secured Debt | (37) | 2/28/2018 | | | | | | 2/28/2025 | — | | — | | — | |
| | | Secured Debt | | 2/28/2018 | | 10.00% | | | | 2/28/2025 | 2,453 | | 2,435 | | 2,435 | |
| | | Preferred Member Units | (8) | 2/28/2018 | 25,786,046 | | | | | | | 2,053 | | 1,590 | |
| | | | | | | | | | | | | 4,488 | | 4,025 | |
| NuStep, LLC | | Designer, Manufacturer and Distributor of Fitness Equipment | | | | | | | | | | | | |
| | | Secured Debt | (9) | 1/31/2017 | | 11.98% | SF+ | 6.50% | | 1/31/2025 | 900 | | 899 | | 899 | |
| | | Secured Debt | | 1/31/2017 | | 12.00% | | | | 1/31/2025 | 4,610 | | 4,606 | | 4,606 | |
| | | Preferred Member Units | | 11/2/2022 | 515 | | | | | | | 515 | | 1,290 | |
| | | Preferred Member Units | | 1/31/2017 | 102 | | | | | | | 2,550 | | 2,310 | |
| | | | | | | | | | | | | 8,570 | | 9,105 | |
| Oneliance, LLC | | Construction Cleaning Company | | | | | | | | | | | | |
| | | Secured Debt | (9) | 8/6/2021 | | 16.48% | SF+ | 11.00% | | 8/6/2026 | 1,360 | | 1,346 | | 1,339 | |
| | | Preferred Stock | | 8/6/2021 | 282 | | | | | | | 282 | | 282 | |
| | | | | | | | | | | | | 1,628 | | 1,621 | |
| Orttech Holdings, LLC | | Distributor of Industrial Clutches, Brakes and Other Components | | | | | | | | | | | | |
| | | Secured Debt | (9) (37) | 7/30/2021 | | | SF+ | 11.00% | | 7/31/2026 | — | | (2) | | — | |
| | | Secured Debt | (9) | 7/30/2021 | | 16.48% | SF+ | 11.00% | | 7/31/2026 | 5,510 | | 5,452 | | 5,510 | |
| | | Preferred Stock | (8) (23) | 7/30/2021 | 2,500 | | | | | | | 2,500 | | 4,260 | |
| | | | | | | | | | | | | 7,950 | | 9,770 | |
| Pinnacle TopCo, LLC | | Manufacturer and Distributor of Garbage Can Liners, Poly Bags, Produce Bags, and Other Similar Products | | | | | | | | | | | | |
| | | Secured Debt | | 12/21/2023 | | 8.00% | | | | 12/31/2028 | 115 | | 105 | | 105 | |
| | | Secured Debt | | 12/21/2023 | | 13.00% | | | | 12/31/2028 | 7,660 | | 7,472 | | 7,472 | |
| | | Preferred Equity | | 12/21/2023 | 110 | | | | | | | 3,135 | | 3,135 | |
| | | | | | | | | | | | | 10,712 | | 10,712 | |
| Robbins Bros. Jewelry, Inc. | | Bridal Jewelry Retailer | | | | | | | | | | | | |
| | | Secured Debt | (37) | 12/15/2021 | | | | | | 12/15/2026 | — | | (6) | | (6) | |
| | | Secured Debt | | 12/15/2021 | | 12.50% | | | | 12/15/2026 | 3,790 | | 3,745 | | 3,421 | |
| | | Preferred Equity | | 12/15/2021 | 1,230 | | | | | | | 1,230 | | — | |
| | | | | | | | | | | | | 4,969 | | 3,415 | |
| SI East, LLC | | Rigid Industrial Packaging Manufacturing | | | | | | | | | | | | |
| | | Secured Debt | | 8/31/2018 | | 11.25% | | | | 6/16/2028 | 375 | | 370 | | 375 | |
| | | Secured Debt | | 6/16/2023 | | 12.47% | | | | 6/16/2028 | 18,179 | | 18,019 | | 18,179 | |
| | | Preferred Member Units | (8) | 8/31/2018 | 55 | | | | | | | 508 | | 6,390 | |
MSC INCOME FUND, INC.
Consolidated Schedule of Investments (Continued)
December 31, 2023
(dollars in thousands)
| | | | | | | | | | | | | | | | | | | | | | | | | | | | | | | | | | | | | | | | | | | | |
| Portfolio Company (1) (20) | | Business Description | Type of Investment (2) (3) (15) | | Investment Date (22) | Shares/Units | Total Rate | Reference Rate and Spread (25) | PIK Rate (19) | Maturity Date | Principal (4) | Cost (4) | Fair Value (18) |
| | | | | | | | | | | | | 18,897 | | 24,944 | |
| Student Resource Center, LLC | (10) | Higher Education Services | | | | | | | | | | | | |
| | | Secured Debt | (14) | 12/31/2022 | | 8.50% | | | 8.50% | 12/31/2027 | 5,918 | | 5,426 | | 3,543 | |
| | | Preferred Equity | | 12/31/2022 | 6,564,055 | | | | | | | — | | — | |
| | | | | | | | | | | | | 5,426 | | 3,543 | |
| Tedder Industries, LLC | | Manufacturer of Firearm Holsters and Accessories | | | | | | | | | | | | |
| | | Secured Debt | (17) | 8/31/2018 | | 12.00% | | | | 8/31/2023 | 460 | | 460 | | 432 | |
| | | Secured Debt | (17) | 8/31/2018 | | 12.00% | | | | 8/31/2023 | 3,800 | | 3,800 | | 3,565 | |
| | | Preferred Member Units | | 8/28/2023 | 1,651 | | | | | | | 165 | | — | |
| | | Preferred Member Units | | 2/1/2023 | 1,411 | | | | | | | 141 | | — | |
| | | Preferred Member Units | | 8/31/2018 | 136 | | | | | | | 2,311 | | — | |
| | | | | | | | | | | | | 6,877 | | 3,997 | |
| Trantech Radiator Topco, LLC | | Transformer Cooling Products and Services | | | | | | | | | | | | |
| | | Secured Debt | (37) | 5/31/2019 | | | | | | 5/31/2024 | — | | (1) | | — | |
| | | Secured Debt | | 5/31/2019 | | 12.00% | | | | 5/31/2024 | 1,980 | | 1,975 | | 1,980 | |
| | | Common Stock | (8) | 5/31/2019 | 154 | | | | | | | 1,164 | | 3,180 | |
| | | | | | | | | | | | | 3,138 | | 5,160 | |
| VVS Holdco LLC | | Omnichannel Retailer of Animal Health Products | | | | | | | | | | | | |
| | | Secured Debt | (9) (17) (37) | 12/1/2021 | | | SF+ | 6.00% | | 12/1/2023 | — | | — | | — | |
| | | Secured Debt | | 12/1/2021 | | 11.50% | | | | 12/1/2026 | 7,050 | | 6,926 | | 6,926 | |
| | | Preferred Equity | (8) (23) | 12/1/2021 | 3,060 | | | | | | | 3,060 | | 3,060 | |
| | | | | | | | | | | | | 9,986 | | 9,986 | |
Subtotal Affiliate Investments (46.8% of net assets at fair value) | | | | | | | | | | | | | $ | 231,378 | | $ | 291,279 | |
| Non-Control/Non-Affiliate Investments (7) | | | | | | | | | | | | | | |
| AAC Holdings, Inc. | (11) | Substance Abuse Treatment Service Provider | | | | | | | | | | | | |
| | | Secured Debt | | 1/31/2023 | | 18.00% | | | 18.00% | 6/25/2025 | $ | 151 | | $ | 149 | | $ | 149 | |
| | | Secured Debt | | 12/11/2020 | | 18.00% | | | 18.00% | 6/25/2025 | 5,014 | | 4,888 | | 4,958 | |
| | | Common Stock | | 12/11/2020 | 593,927 | | | | | | | 3,148 | | — | |
| | | Warrants | (27) | 12/11/2020 | 197,717 | | | | | 12/11/2025 | | — | | — | |
| | | | | | | | | | | | | 8,185 | | 5,107 | |
| AB Centers Acquisition Corporation | (10) | Applied Behavior Analysis Therapy Provider | | | | | | | | | | | | |
| | | Secured Debt | (9) (37) | 9/6/2022 | | | P+ | 5.00% | | 9/6/2028 | — | | (20) | | — | |
| | | Secured Debt | (9) | 9/6/2022 | | 11.43% | SF+ | 6.00% | | 9/6/2028 | 1,081 | | 1,066 | | 1,081 | |
| | | Secured Debt | (9) | 9/6/2022 | | 11.43% | SF+ | 6.00% | | 9/6/2028 | 2,304 | | 2,219 | | 2,304 | |
| | | Secured Debt | (9) | 6/21/2023 | | 11.43% | SF+ | 6.00% | | 9/6/2028 | 772 | | 743 | | 772 | |
| | | | | | | | | | | | | 4,008 | | 4,157 | |
| Acumera, Inc. | (10) | Managed Security Service Provider | | | | | | | | | | | | |
| | | Secured Debt | (9) (37) | 6/7/2023 | | | SF+ | 7.50% | | 6/7/2028 | — | | (8) | | (8) | |
| | | Secured Debt | (9) | 6/7/2023 | | 12.98% | SF+ | 7.50% | | 6/7/2028 | 11,922 | | 11,825 | | 11,922 | |
MSC INCOME FUND, INC.
Consolidated Schedule of Investments (Continued)
December 31, 2023
(dollars in thousands)
| | | | | | | | | | | | | | | | | | | | | | | | | | | | | | | | | | | | | | | | | | | | |
| Portfolio Company (1) (20) | | Business Description | Type of Investment (2) (3) (15) | | Investment Date (22) | Shares/Units | Total Rate | Reference Rate and Spread (25) | PIK Rate (19) | Maturity Date | Principal (4) | Cost (4) | Fair Value (18) |
| | | Warrants | (40) | 6/7/2023 | 14,953 | | | | | 5/19/2028 | | — | | 90 | |
| | | | | | | | | | | | | 11,817 | | 12,004 | |
| Adams Publishing Group, LLC | (10) | Local Newspaper Operator | | | | | | | | | | | | |
| | | Secured Debt | (9) (36) | 3/11/2022 | | 11.00% | SF+ | 7.00% | 1.00% | 3/11/2027 | 936 | | 936 | | 917 | |
| | | Secured Debt | (9) (36) | 3/11/2022 | | 11.00% | SF+ | 7.00% | 1.00% | 3/11/2027 | 2,531 | | 2,527 | | 2,481 | |
| | | | | | | | | | | | | 3,463 | | 3,398 | |
| ADS Tactical, Inc. | (11) | Value-Added Logistics and Supply Chain Provider to the Defense Industry | | | | | | | | | | | | |
| | | Secured Debt | (9) | 3/29/2021 | | 11.22% | SF+ | 5.75% | | 3/19/2026 | 4,250 | | 4,210 | | 4,214 | |
| | | | | | | | | | | | | | |
| AMEREQUIP LLC | (10) | Full Services Provider Including Design, Engineering and Manufacturing of Commercial and Agricultural Equipment | | | | | | | | | | | | |
| | | Secured Debt | (9) (37) | 8/31/2022 | | | SF+ | 7.40% | | 8/31/2027 | — | | — | | — | |
| | | Secured Debt | (9) | 8/31/2022 | | 12.76% | SF+ | 7.40% | | 8/31/2027 | 1,538 | | 1,538 | | 1,538 | |
| | | Common Stock | (8) | 8/31/2022 | 11 | | | | | | | 83 | | 100 | |
| | | | | | | | | | | | | 1,621 | | 1,638 | |
| American Health Staffing Group, Inc. | (10) | Healthcare Temporary Staffing | | | | | | | | | | | | |
| | | Secured Debt | (9) (37) | 11/19/2021 | | | P+ | 5.00% | | 11/19/2026 | — | | (10) | | (10) | |
| | | Secured Debt | (9) | 11/19/2021 | | 13.50% | P+ | 5.00% | | 11/19/2026 | 8,188 | | 8,140 | | 8,188 | |
| | | | | | | | | | | | | 8,130 | | 8,178 | |
| American Nuts, LLC | (10) | Roaster, Mixer and Packager of Bulk Nuts and Seeds | | | | | | | | | | | | |
| | | Secured Debt | (9) | 3/11/2022 | | 15.29% | SF+ | 9.75% | 15.29% | 4/10/2026 | 4,833 | | 4,812 | | 4,102 | |
| | | Secured Debt | (9) | 3/11/2022 | | 15.29% | SF+ | 9.75% | 15.29% | 4/10/2026 | — | | — | | — | |
| | | Secured Debt | (9) (14) | 3/11/2022 | | 17.29% | SF+ | 11.75% | 17.29% | 4/10/2026 | 4,270 | | 4,244 | | 2,522 | |
| | | Secured Debt | (9) (14) | 3/11/2022 | | 17.29% | SF+ | 11.75% | 17.29% | 4/10/2026 | — | | — | | — | |
| | | | | | | | | | | | | 9,056 | | 6,624 | |
| American Teleconferencing Services, Ltd. | (11) | Provider of Audio Conferencing and Video Collaboration Solutions | | | | | | | | | | | | |
| | | Secured Debt | (14) (17) | 9/17/2021 | | | | | | 4/7/2023 | 2,425 | | 2,375 | | 109 | |
| | | Secured Debt | (14) (17) | 5/19/2016 | | | | | | 6/8/2023 | 11,693 | | 11,451 | | 526 | |
| | | | | | | | | | | | | 13,826 | | 635 | |
| ArborWorks, LLC | (10) | Vegetation Management Services | | | | | | | | | | | | |
| | | Secured Debt | | 11/6/2023 | | 15.00% | | | 15.00% | 11/6/2028 | 1,007 | | 1,007 | | 1,007 | |
| | | Secured Debt | (9) | 11/6/2023 | | 12.04% | SF+ | 6.50% | 12.04% | 11/6/2028 | 3,765 | | 3,765 | | 3,765 | |
| | | Preferred Equity | | 11/6/2023 | 17,265 | | | | | | | 7,468 | | 7,468 | |
| | | Preferred Equity | | 11/6/2023 | 17,265 | | | | | | | — | | — | |
| | | Common Equity | | 11/9/2021 | 2,070 | | | | | | | 124 | | — | |
| | | | | | | | | | | | | 12,364 | | 12,240 | |
MSC INCOME FUND, INC.
Consolidated Schedule of Investments (Continued)
December 31, 2023
(dollars in thousands)
| | | | | | | | | | | | | | | | | | | | | | | | | | | | | | | | | | | | | | | | | | | | |
| Portfolio Company (1) (20) | | Business Description | Type of Investment (2) (3) (15) | | Investment Date (22) | Shares/Units | Total Rate | Reference Rate and Spread (25) | PIK Rate (19) | Maturity Date | Principal (4) | Cost (4) | Fair Value (18) |
| Archer Systems, LLC | (10) | Mass Tort Settlement Administration Solutions Provider | | | | | | | | | | | | |
| | | Common Stock | | 8/11/2022 | 62,402 | | | | | | | 62 | | 100 | |
| | | | | | | | | | | | | | |
| ATS Operating, LLC | (10) | For-Profit Thrift Retailer | | | | | | | | | | | | |
| | | Secured Debt | (9) | 1/18/2022 | | 12.16% | SF+ | 6.50% | | 1/18/2027 | 50 | | 50 | | 50 | |
| | | Secured Debt | (9) | 1/18/2022 | | 11.16% | SF+ | 5.50% | | 1/18/2027 | 925 | | 911 | | 925 | |
| | | Secured Debt | (9) | 1/18/2022 | | 13.16% | SF+ | 7.50% | | 1/18/2027 | 925 | | 911 | | 925 | |
| | | Common Stock | | 1/18/2022 | 100,000 | | | | | | | 100 | | 90 | |
| | | | | | | | | | | | | 1,972 | | 1,990 | |
| AVEX Aviation Holdings, LLC | (10) | Specialty Aircraft Dealer & MRO Provider | | | | | | | | | | | | |
| | | Secured Debt | (9) (37) | 12/23/2022 | | | SF+ | 7.25% | | 12/23/2027 | — | | (17) | | (5) | |
| | | Secured Debt | (9) | 12/23/2022 | | 12.76% | SF+ | 7.25% | | 12/23/2027 | 3,417 | | 3,321 | | 3,344 | |
| | | Common Equity | (8) | 12/15/2021 | 137 | | | | | | | 134 | | 124 | |
| | | | | | | | | | | | | 3,438 | | 3,463 | |
| Berry Aviation, Inc. | (10) | Charter Airline Services | | | | | | | | | | | | |
| | | Preferred Member Units | (23) | 11/12/2019 | 122,416 | | | | | | | — | | 200 | |
| | | Preferred Member Units | (8) (23) | 7/6/2018 | 1,548,387 | | | | | | | — | | 2,560 | |
| | | | | | | | | | | | | — | | 2,760 | |
| Bettercloud, Inc. | (10) | SaaS Provider of Workflow Management and Business Application Solutions | | | | | | | | | | | | |
| | | Secured Debt | (9) (37) | 6/30/2022 | | | SF+ | 7.25% | | 6/30/2028 | — | | (18) | | (18) | |
| | | Secured Debt | (9) | 6/30/2022 | | 12.64% | SF+ | 7.25% | 6.25% | 6/30/2028 | 8,535 | | 8,419 | | 7,998 | |
| | | | | | | | | | | | | 8,401 | | 7,980 | |
| Binswanger Enterprises, LLC | (10) | Glass Repair and Installation Service Provider | | | | | | | | | | | | |
| | | Member Units | | 3/10/2017 | 1,050,000 | | | | | | | 1,050 | | 120 | |
| | | | | | | | | | | | | | |
| Bluestem Brands, Inc. | (11) | Multi-Channel Retailer of General Merchandise | | | | | | | | | | | | |
| | | Secured Debt | (9) | 10/19/2022 | | 16.00% | P+ | 7.50% | 15.00% | 8/28/2025 | 2,035 | | 2,035 | | 1,907 | |
| | | Secured Debt | (9) | 8/28/2020 | | 13.96% | SF+ | 8.50% | 12.96% | 8/28/2025 | 3,941 | | 3,305 | | 3,695 | |
| | | Common Stock | | 10/1/2020 | 700,446 | | | | | | | — | | 533 | |
| | | Warrants | (27) | 10/19/2022 | 175,110 | | | | | 10/19/2032 | | 1,111 | | 129 | |
| | | | | | | | | | | | | 6,451 | | 6,264 | |
| Boccella Precast Products LLC | | Manufacturer of Precast Hollow Core Concrete | | | | | | | | | | | | |
| | | Secured Debt | | 9/23/2021 | | 10.00% | | | | 2/28/2027 | 80 | | 80 | | 80 | |
| | | Member Units | | 6/30/2017 | 540,000 | | | | | | | 564 | | 498 | |
| | | | | | | | | | | | | 644 | | 578 | |
| Bond Brand Loyalty ULC | (10) (13) (21) | Provider of Loyalty Marketing Services | | | | | | | | | | | | |
| | | Secured Debt | (9) (37) | 5/1/2023 | | | SF+ | 7.00% | | 5/1/2028 | — | | (16) | | (16) | |
| | | Secured Debt | (9) | 5/1/2023 | | 11.54% | SF+ | 6.00% | | 5/1/2028 | 4,040 | | 3,970 | | 4,040 | |
MSC INCOME FUND, INC.
Consolidated Schedule of Investments (Continued)
December 31, 2023
(dollars in thousands)
| | | | | | | | | | | | | | | | | | | | | | | | | | | | | | | | | | | | | | | | | | | | |
| Portfolio Company (1) (20) | | Business Description | Type of Investment (2) (3) (15) | | Investment Date (22) | Shares/Units | Total Rate | Reference Rate and Spread (25) | PIK Rate (19) | Maturity Date | Principal (4) | Cost (4) | Fair Value (18) |
| | | Secured Debt | (9) | 5/1/2023 | | 13.54% | SF+ | 8.00% | | 5/1/2028 | 4,040 | | 3,970 | | 4,040 | |
| | | Preferred Equity | | 5/1/2023 | 360 | | | | | | | 360 | | 310 | |
| | | Common Equity | | 5/1/2023 | 360 | | | | | | | — | | — | |
| | | | | | | | | | | | | 8,284 | | 8,374 | |
| Brightwood Capital Fund Investments | (12) (13) | Investment Partnership | | | | | | | | | | | | |
| | | LP Interests (Brightwood Capital Fund III, LP) | (24) | 7/21/2014 | 0.5% | | | | | | | 2,270 | | 1,360 | |
| | | LP Interests (Brightwood Capital Fund IV, LP) | (8) (24) | 10/26/2016 | 1.2% | | | | | | | 8,737 | | 8,716 | |
| | | | | | | | | | | | | 11,007 | | 10,076 | |
| Buca C, LLC | | Casual Restaurant Group | | | | | | | | | | | | |
| | | Secured Debt | (17) | 6/30/2015 | | 12.00% | | | | 8/31/2023 | 11,490 | | 11,490 | | 8,218 | |
| | | Preferred Member Units | | 6/30/2015 | 4 | 6.00% | | | 6.00% | | | 3,040 | | — | |
| | | | | | | | | | | | | 14,530 | | 8,218 | |
| Burning Glass Intermediate Holding Company, Inc. | (10) | Provider of Skills-Based Labor Market Analytics | | | | | | | | | | | | |
| | | Secured Debt | (9) | 6/14/2021 | | 10.46% | SF+ | 5.00% | | 6/10/2026 | 310 | | 296 | | 310 | |
| | | Secured Debt | (9) | 6/14/2021 | | 10.46% | SF+ | 5.00% | | 6/10/2028 | 13,121 | | 12,970 | | 13,121 | |
| | | | | | | | | | | | | 13,266 | | 13,431 | |
| CAI Software LLC | | Provider of Specialized Enterprise Resource Planning Software | | | | | | | | | | | | |
| | | Preferred Equity | | 12/13/2021 | 379,338 | | | | | | | 379 | | 379 | |
| | | Preferred Equity | | 12/13/2021 | 126,446 | | | | | | | — | | — | |
| | | | | | | | | | | | | 379 | | 379 | |
| Career Team Holdings, LLC | | Provider of Workforce Training and Career Development Services | | | | | | | | | | | | |
| | | Secured Debt | (9) | 12/17/2021 | | 11.38% | SF+ | 6.00% | | 12/17/2026 | 100 | | 96 | | 96 | |
| | | Secured Debt | | 12/17/2021 | | 13.00% | | | | 12/17/2026 | 2,225 | | 2,185 | | 2,185 | |
| | | Common Stock | | 12/17/2021 | 50,000 | | | | | | | 500 | | 500 | |
| | | | | | | | | | | | | 2,781 | | 2,781 | |
| CaseWorthy, Inc. | (10) | SaaS Provider of Case Management Solutions | | | | | | | | | | | | |
| | | Secured Debt | (9) (37) | 5/18/2022 | | | SF+ | 6.00% | | 5/18/2027 | — | | (3) | | (3) | |
| | | Secured Debt | (9) | 5/18/2022 | | 11.61% | SF+ | 6.00% | | 5/18/2027 | 2,581 | | 2,561 | | 2,581 | |
| | | Secured Debt | (9) | 5/18/2022 | | 11.61% | SF+ | 6.00% | | 5/18/2027 | 1,985 | | 1,971 | | 1,985 | |
| | | Common Equity | | 12/30/2022 | 80,000 | | | | | | | 80 | | 80 | |
| | | | | | | | | | | | | 4,609 | | 4,643 | |
| Channel Partners Intermediateco, LLC | (10) | Outsourced Consumer Services Provider | | | | | | | | | | | | |
| | | Secured Debt | (9) (44) | 2/7/2022 | | 12.60% | SF+ | 7.00% | | 2/7/2027 | 190 | | 175 | | 183 | |
| | | Secured Debt | (9) | 2/7/2022 | | 12.66% | SF+ | 7.00% | | 2/7/2027 | 3,360 | | 3,317 | | 3,224 | |
| | | Secured Debt | (9) | 6/24/2022 | | 12.66% | SF+ | 7.00% | | 2/7/2027 | 186 | | 184 | | 179 | |
| | | Secured Debt | (9) | 3/27/2023 | | 12.66% | SF+ | 7.00% | | 2/7/2027 | 450 | | 440 | | 432 | |
MSC INCOME FUND, INC.
Consolidated Schedule of Investments (Continued)
December 31, 2023
(dollars in thousands)
| | | | | | | | | | | | | | | | | | | | | | | | | | | | | | | | | | | | | | | | | | | | |
| Portfolio Company (1) (20) | | Business Description | Type of Investment (2) (3) (15) | | Investment Date (22) | Shares/Units | Total Rate | Reference Rate and Spread (25) | PIK Rate (19) | Maturity Date | Principal (4) | Cost (4) | Fair Value (18) |
| | | | | | | | | | | | | 4,116 | | 4,018 | |
| Clarius BIGS, LLC | (10) | Prints & Advertising Film Financing | | | | | | | | | | | | |
| | | Secured Debt | (14) (17) | 9/23/2014 | | | | | | 1/5/2015 | 2,694 | | 2,350 | | 16 | |
| | | | | | | | | | | | | | |
| Classic H&G Holdings, LLC | | Provider of Engineered Packaging Solutions | | | | | | | | | | | | |
| | | Secured Debt | (9) | 3/12/2020 | | 11.69% | SF+ | 6.00% | | 3/12/2025 | 1,140 | | 1,133 | | 1,140 | |
| | | Secured Debt | | 3/12/2020 | | 8.00% | | | | 3/12/2025 | 4,819 | | 4,781 | | 4,819 | |
| | | Preferred Member Units | (8) | 3/12/2020 | 39 | | | | | | | 1,440 | | 4,000 | |
| | | | | | | | | | | | | 7,354 | | 9,959 | |
| Computer Data Source, LLC | (10) | Third Party Maintenance Provider to the Data Center Ecosystem | | | | | | | | | | | | |
| | | Secured Debt | (9) (30) | 8/6/2021 | | 13.52% | SF+ | 8.00% | | 8/6/2026 | 4,167 | | 4,123 | | 4,040 | |
| | | Secured Debt | (9) | 8/6/2021 | | 13.52% | SF+ | 8.00% | | 8/6/2026 | 15,260 | | 15,098 | | 14,797 | |
| | | | | | | | | | | | | 19,221 | | 18,837 | |
| Construction Supply Investments, LLC | (10) | Distribution Platform of Specialty Construction Materials to Professional Concrete and Masonry Contractors | | | | | | | | | | | | |
| | | Member Units | | 12/29/2016 | 861,618 | | | | | | | 3,335 | | 23,135 | |
| | | | | | | | | | | | | | |
| CQ Fluency, LLC | (10) | Global Language Services Provider | | | | | | | | | | | | |
| | | Secured Debt | (9) (37) | 12/27/2023 | | | SF+ | 7.00% | | 6/27/2027 | — | | (44) | | (44) | |
| | | Secured Debt | (9) (37) | 12/27/2023 | | | SF+ | 7.00% | | 6/27/2027 | — | | (44) | | (44) | |
| | | Secured Debt | (9) | 12/27/2023 | | 12.45% | SF+ | 7.00% | | 6/27/2027 | 7,500 | | 7,280 | | 7,280 | |
| | | | | | | | | | | | | 7,192 | | 7,192 | |
| Dalton US Inc. | (10) | Provider of Supplemental Labor Services | | | | | | | | | | | | |
| | | Common Stock | | 8/16/2022 | 37 | | | | | | | 52 | | 60 | |
| | | | | | | | | | | | | | |
| DMA Industries, LLC | | Distributor of Aftermarket Ride Control Products | | | | | | | | | | | | |
| | | Secured Debt | | 11/19/2021 | | 12.00% | | | | 11/19/2026 | 4,700 | | 4,642 | | 4,700 | |
| | | Preferred Equity | | 11/19/2021 | 1,486 | | | | | | | 1,486 | | 1,920 | |
| | | | | | | | | | | | | 6,128 | | 6,620 | |
| DTE Enterprises, LLC | (10) | Industrial Powertrain Repair and Services | | | | | | | | | | | | |
| | | Class AA Preferred Member Units (non-voting) | (8) | 4/13/2018 | | 10.00% | | | 10.00% | | | 1,284 | | 1,283 | |
| | | Class A Preferred Member Units | | 4/13/2018 | 776,316 | 8.00% | | | 8.00% | | | 776 | | 260 | |
| | | | | | | | | | | | | 2,060 | | 1,543 | |
MSC INCOME FUND, INC.
Consolidated Schedule of Investments (Continued)
December 31, 2023
(dollars in thousands)
| | | | | | | | | | | | | | | | | | | | | | | | | | | | | | | | | | | | | | | | | | | | |
| Portfolio Company (1) (20) | | Business Description | Type of Investment (2) (3) (15) | | Investment Date (22) | Shares/Units | Total Rate | Reference Rate and Spread (25) | PIK Rate (19) | Maturity Date | Principal (4) | Cost (4) | Fair Value (18) |
| Dynamic Communities, LLC | (10) | Developer of Business Events and Online Community Groups | | | | | | | | | | | | |
| | | Secured Debt | (9) | 12/20/2022 | | 10.45% | SF+ | 5.00% | 10.45% | 12/31/2026 | 2,070 | | 1,912 | | 1,912 | |
| | | Secured Debt | (9) | 12/20/2022 | | 12.45% | SF+ | 7.00% | 12.45% | 12/31/2026 | 2,113 | | 1,879 | | 1,859 | |
| | | Preferred Equity | | 12/20/2022 | 125,000 | | | | | | | 128 | | 60 | |
| | | Preferred Equity | | 12/20/2022 | 2,376,241 | | | | | | | — | | — | |
| | | Common Equity | | 12/20/2022 | 1,250,000 | | | | | | | — | | — | |
| | | | | | | | | | | | | 3,919 | | 3,831 | |
| Elgin AcquireCo, LLC | | Manufacturer and Distributor of Engine and Chassis Components | | | | | | | | | | | | |
| | | Secured Debt | (9) (37) | 10/3/2022 | | | SF+ | 6.00% | | 10/3/2027 | — | | — | | — | |
| | | Secured Debt | | 10/3/2022 | | 12.00% | | | | 10/3/2027 | 1,227 | | 1,200 | | 1,200 | |
| | | Secured Debt | | 10/3/2022 | | 9.00% | | | | 10/3/2052 | 412 | | 409 | | 409 | |
| | | Common Stock | | 10/3/2022 | 19 | | | | | | | 374 | | 390 | |
| | | Common Stock | (23) | 10/3/2022 | 61 | | | | | | | 102 | | 109 | |
| | | | | | | | | | | | | 2,085 | | 2,108 | |
| Emerald Technologies Acquisition Co, Inc. | (11) | Design & Manufacturing | | | | | | | | | | | | |
| | | Secured Debt | (9) | 2/10/2022 | | 11.79% | SF+ | 6.25% | | 12/29/2027 | 2,391 | | 2,357 | | 2,175 | |
| | | | | | | | | | | | | | |
| Engineering Research & Consulting, LLC | (10) | Provider of Engineering & Consulting Services to US Department of Defense | | | | | | | | | | | | |
| | | Secured Debt | (9) (37) | 5/23/2022 | | | P+ | 5.50% | | 5/23/2027 | — | | (11) | | — | |
| | | Secured Debt | (9) | 5/23/2022 | | 11.98% | SF+ | 6.50% | | 5/23/2028 | 5,095 | | 5,023 | | 5,095 | |
| | | | | | | | | | | | | 5,012 | | 5,095 | |
| Escalent, Inc. | (10) | Market Research and Consulting Firm | | | | | | | | | | | | |
| | | Secured Debt | (9) (37) | 4/7/2023 | | | SF+ | 8.00% | | 4/7/2029 | — | | (9) | | (9) | |
| | | Secured Debt | (9) | 4/7/2023 | | 13.45% | SF+ | 8.00% | | 4/7/2029 | 6,924 | | 6,742 | | 6,924 | |
| | | Common Equity | | 4/7/2023 | 170,998 | | | | | | | 174 | | 190 | |
| | | | | | | | | | | | | 6,907 | | 7,105 | |
| Event Holdco, LLC | (10) | Event and Learning Management Software for Healthcare Organizations and Systems | | | | | | | | | | | | |
| | | Secured Debt | (9) | 12/22/2021 | | 12.61% | SF+ | 7.00% | | 12/22/2026 | 308 | | 306 | | 302 | |
| | | Secured Debt | (9) | 12/22/2021 | | 12.61% | SF+ | 7.00% | | 12/22/2026 | 3,681 | | 3,659 | | 3,614 | |
| | | | | | | | | | | | | 3,965 | | 3,916 | |
| Garyline, LLC | (10) | Manufacturer of Consumer Plastic Products | | | | | | | | | | | | |
| | | Secured Debt | (9) (37) | 11/10/2023 | | | SF+ | 6.75% | | 11/10/2028 | — | | (76) | | (76) | |
| | | Secured Debt | (9) | 11/10/2023 | | 12.22% | SF+ | 6.75% | | 11/10/2028 | 9,664 | | 9,384 | | 9,384 | |
| | | Common Equity | | 11/10/2023 | 210,084 | | | | | | | 210 | | 210 | |
| | | | | | | | | | | | | 9,518 | | 9,518 | |
| Hawk Ridge Systems, LLC | | Value-Added Reseller of Engineering Design and Manufacturing Solutions | | | | | | | | | | | | |
MSC INCOME FUND, INC.
Consolidated Schedule of Investments (Continued)
December 31, 2023
(dollars in thousands)
| | | | | | | | | | | | | | | | | | | | | | | | | | | | | | | | | | | | | | | | | | | | |
| Portfolio Company (1) (20) | | Business Description | Type of Investment (2) (3) (15) | | Investment Date (22) | Shares/Units | Total Rate | Reference Rate and Spread (25) | PIK Rate (19) | Maturity Date | Principal (4) | Cost (4) | Fair Value (18) |
| | | Secured Debt | (9) | 12/2/2016 | | 11.65% | SF+ | 6.00% | | 1/15/2026 | 494 | | 492 | | 494 | |
| | | Secured Debt | | 12/2/2016 | | 12.50% | | | | 1/15/2026 | 9,744 | | 9,697 | | 9,744 | |
| | | Preferred Member Units | | 12/2/2016 | 56 | | | | | | | 713 | | 4,370 | |
| | | Preferred Member Units | (23) | 12/2/2016 | 56 | | | | | | | 38 | | 230 | |
| | | | | | | | | | | | | 10,940 | | 14,838 | |
| HDC/HW Intermediate Holdings | (10) | Managed Services and Hosting Provider | | | | | | | | | | | | |
| | | Secured Debt | (9) (17) | 12/21/2018 | | 14.34% | SF+ | 9.50% | 14.34% | 12/21/2023 | 205 | | 205 | | 186 | |
| | | Secured Debt | (9) (17) | 12/21/2018 | | 14.34% | SF+ | 9.50% | 14.34% | 12/21/2023 | 2,036 | | 2,036 | | 1,849 | |
| | | | | | | | | | | | | 2,241 | | 2,035 | |
| HEADLANDS OP-CO LLC | (10) | Clinical Trial Sites Operator | | | | | | | | | | | | |
| | | Secured Debt | (9) (37) | 8/1/2022 | | | SF+ | 6.50% | | 8/1/2027 | — | | (14) | | (14) | |
| | | Secured Debt | (9) | 8/1/2022 | | 11.86% | SF+ | 6.50% | | 8/1/2027 | 1,995 | | 1,962 | | 1,995 | |
| | | Secured Debt | (9) | 8/1/2022 | | 11.86% | SF+ | 6.50% | | 8/1/2027 | 4,925 | | 4,854 | | 4,925 | |
| | | | | | | | | | | | | 6,802 | | 6,906 | |
| Hybrid Promotions, LLC | (10) | Wholesaler of Licensed, Branded and Private Label Apparel | | | | | | | | | | | | |
| | | Secured Debt | (9) | 6/30/2021 | | 15.91% | SF+ | 8.25% | 2.00% | 6/30/2026 | 7,964 | | 7,813 | | 7,313 | |
| | | | | | | | | | | | | | |
| IG Parent Corporation | (11) | Software Engineering | | | | | | | | | | | | |
| | | Secured Debt | (9) (37) | 7/30/2021 | | | SF+ | 5.75% | | 7/30/2026 | — | | (13) | | — | |
| | | Secured Debt | (9) | 7/30/2021 | | 10.96% | SF+ | 5.50% | | 7/30/2028 | 6,266 | | 6,200 | | 6,266 | |
| | | Secured Debt | (9) | 7/30/2021 | | 10.96% | SF+ | 5.50% | | 7/30/2028 | 1,942 | | 1,921 | | 1,942 | |
| | | | | | | | | | | | | 8,108 | | 8,208 | |
| Imaging Business Machines, L.L.C. | (10) | Technology Hardware & Equipment | | | | | | | | | | | | |
| | | Secured Debt | (9) (29) | 6/8/2023 | | 12.41% | SF+ | 7.00% | | 6/30/2028 | 791 | | 791 | | 786 | |
| | | Secured Debt | (9) | 6/8/2023 | | 12.45% | SF+ | 7.00% | | 6/30/2028 | 10,384 | | 10,068 | | 10,318 | |
| | | Common Equity | | 6/8/2023 | 422 | | | | | | | 580 | | 550 | |
| | | | | | | | | | | | | 11,439 | | 11,654 | |
| Implus Footcare, LLC | (10) | Provider of Footwear and Related Accessories | | | | | | | | | | | | |
| | | Secured Debt | (9) | 6/1/2017 | | 14.25% | SF+ | 7.75% | 1.00% | 7/31/2024 | 17,012 | | 17,010 | | 15,816 | |
| | | | | | | | | | | | | | |
| Industrial Services Acquisition, LLC | (10) | Industrial Cleaning Services | | | | | | | | | | | | |
| | | Secured Debt | (9) (32) | 8/13/2021 | | 12.22% | SF+ | 6.75% | | 8/13/2026 | 752 | | 734 | | 752 | |
| | | Secured Debt | (9) | 8/13/2021 | | 12.22% | SF+ | 6.75% | | 8/13/2026 | 11,436 | | 11,330 | | 11,436 | |
| | | Preferred Member Units | (8) (23) | 1/31/2018 | 336 | 10.00% | | | 10.00% | | | 321 | | 415 | |
| | | Preferred Member Units | (8) (23) | 5/17/2019 | 187 | 20.00% | | | 20.00% | | | 240 | | 279 | |
| | | Member Units | (23) | 6/17/2016 | 2,100 | | | | | | | 2,100 | | 1,610 | |
| | | | | | | | | | | | | 14,725 | | 14,492 | |
| Infinity X1 Holdings, LLC | | Manufacturer and Supplier of Personal Lighting Products | | | | | | | | | | | | |
MSC INCOME FUND, INC.
Consolidated Schedule of Investments (Continued)
December 31, 2023
(dollars in thousands)
| | | | | | | | | | | | | | | | | | | | | | | | | | | | | | | | | | | | | | | | | | | | |
| Portfolio Company (1) (20) | | Business Description | Type of Investment (2) (3) (15) | | Investment Date (22) | Shares/Units | Total Rate | Reference Rate and Spread (25) | PIK Rate (19) | Maturity Date | Principal (4) | Cost (4) | Fair Value (18) |
| | | Secured Debt | | 3/31/2023 | | 13.00% | | | | 3/31/2028 | 4,388 | | 4,314 | | 4,314 | |
| | | Preferred Equity | | 3/31/2023 | 20,000 | | | | | | | 1,000 | | 1,000 | |
| | | | | | | | | | | | | 5,314 | | 5,314 | |
| Infolinks Media Buyco, LLC | (10) | Exclusive Placement Provider to the Advertising Ecosystem | | | | | | | | | | | | |
| | | Secured Debt | (9) | 11/1/2021 | | 11.21% | SF+ | 5.75% | | 11/1/2026 | 1,881 | | 1,829 | | 1,881 | |
| | | Secured Debt | (9) | 11/1/2021 | | 11.21% | SF+ | 5.75% | | 11/1/2026 | 9,690 | | 9,579 | | 9,690 | |
| | | | | | | | | | | | | 11,408 | | 11,571 | |
| Insight Borrower Corporation | (10) | Test, Inspection, and Certification Instrument Provider | | | | | | | | | | | | |
| | | Secured Debt | (9) (37) | 7/19/2023 | | | SF+ | 6.25% | | 7/19/2028 | — | | (40) | | (40) | |
| | | Secured Debt | (9) (37) | 7/19/2023 | | | SF+ | 6.25% | | 7/19/2029 | — | | (33) | | (33) | |
| | | Secured Debt | (9) | 7/19/2023 | | 11.65% | SF+ | 6.25% | | 7/19/2029 | 8,373 | | 8,143 | | 8,287 | |
| | | Common Equity | | 7/19/2023 | 47,847 | | | | | | | 239 | | 239 | |
| | | | | | | | | | | | | 8,309 | | 8,453 | |
| Inspire Aesthetics Management, LLC | (10) | Surgical and Non-Surgical Plastic Surgery and Aesthetics Provider | | | | | | | | | | | | |
| | | Secured Debt | (9) (31) | 4/3/2023 | | 13.53% | SF+ | 8.00% | | 4/3/2028 | 676 | | 659 | | 664 | |
| | | Secured Debt | (9) | 4/3/2023 | | 13.55% | SF+ | 8.00% | | 4/3/2028 | 6,256 | | 6,115 | | 6,144 | |
| | | Secured Debt | (9) | 6/14/2023 | | 13.55% | SF+ | 8.00% | | 4/3/2028 | 1,260 | | 1,231 | | 1,237 | |
| | | Common Equity | | 4/3/2023 | 101,719 | | | | | | | 322 | | 190 | |
| | | | | | | | | | | | | 8,327 | | 8,235 | |
| Interface Security Systems, L.L.C | (10) | Commercial Security & Alarm Services | | | | | | | | | | | | |
| | | Secured Debt | (17) (28) | 12/9/2021 | | 15.48% | SF+ | 10.00% | | 8/7/2023 | 1,835 | | 1,835 | | 1,781 | |
| | | Secured Debt | (9) (14) (17) | 8/7/2019 | | 12.46% | SF+ | 7.00% | 12.46% | 8/7/2023 | 7,334 | | 7,254 | | 433 | |
| | | Common Stock | | 12/7/2021 | 2,143 | | | | | | | — | | — | |
| | | | | | | | | | | | | 9,089 | | 2,214 | |
| Intermedia Holdings, Inc. | (11) | Unified Communications as a Service | | | | | | | | | | | | |
| | | Secured Debt | (9) | 8/3/2018 | | 11.47% | SF+ | 6.00% | | 7/19/2025 | 5,544 | | 5,539 | | 5,370 | |
| | | | | | | | | | | | | | |
| Invincible Boat Company, LLC. | (10) | Manufacturer of Sport Fishing Boats | | | | | | | | | | | | |
| | | Secured Debt | (9) | 8/28/2019 | | 12.00% | SF+ | 6.50% | | 8/28/2025 | 519 | | 516 | | 509 | |
| | | Secured Debt | (9) | 8/28/2019 | | 12.00% | SF+ | 6.50% | | 8/28/2025 | 16,812 | | 16,751 | | 16,515 | |
| | | | | | | | | | | | | 17,267 | | 17,024 | |
| INW Manufacturing, LLC | (11) | Manufacturer of Nutrition and Wellness Products | | | | | | | | | | | | |
| | | Secured Debt | (9) | 5/19/2021 | | 11.36% | SF+ | 5.75% | | 3/25/2027 | 6,656 | | 6,537 | | 5,325 | |
| | | | | | | | | | | | | | |
| Iron-Main Investments, LLC | | Consumer Reporting Agency Providing Employment Background Checks and Drug Testing | | | | | | | | | | | | |
MSC INCOME FUND, INC.
Consolidated Schedule of Investments (Continued)
December 31, 2023
(dollars in thousands)
| | | | | | | | | | | | | | | | | | | | | | | | | | | | | | | | | | | | | | | | | | | | |
| Portfolio Company (1) (20) | | Business Description | Type of Investment (2) (3) (15) | | Investment Date (22) | Shares/Units | Total Rate | Reference Rate and Spread (25) | PIK Rate (19) | Maturity Date | Principal (4) | Cost (4) | Fair Value (18) |
| | | Secured Debt | | 8/2/2021 | | 13.50% | | | | 1/31/2028 | 1,128 | | 1,108 | | 1,108 | |
| | | Secured Debt | | 9/1/2021 | | 13.50% | | | | 1/31/2028 | 735 | | 722 | | 722 | |
| | | Secured Debt | | 11/15/2021 | | 13.50% | | | | 1/31/2028 | 2,236 | | 2,236 | | 2,236 | |
| | | Secured Debt | | 11/15/2021 | | 13.50% | | | | 1/31/2028 | 4,906 | | 4,815 | | 4,815 | |
| | | Secured Debt | | 1/31/2023 | | 13.50% | | | | 1/31/2028 | 2,641 | | 2,525 | | 2,525 | |
| | | Common Stock | | 8/3/2021 | 50,753 | | | | | | | 689 | | 670 | |
| | | | | | | | | | | | | 12,095 | | 12,076 | |
| Isagenix International, LLC | (11) | Direct Marketer of Health & Wellness Products | | | | | | | | | | | | |
| | | Secured Debt | (9) | 4/13/2023 | | 11.04% | SF+ | 5.50% | 8.54% | 4/14/2028 | 2,615 | | 2,374 | | 2,301 | |
| | | Common Equity | | 4/13/2023 | 186,322 | | | | | | | — | | — | |
| | | | | | | | | | | | | 2,374 | | 2,301 | |
| ITA Holdings Group, LLC | | Air Ambulance Services | | | | | | | | | | | | |
| | | Secured Debt | (9) | 6/21/2023 | | 16.59% | SF+ | 9.00% | 2.00% | 6/21/2027 | 207 | | 201 | | 201 | |
| | | Secured Debt | (9) | 6/21/2023 | | 16.59% | SF+ | 9.00% | 2.00% | 6/21/2027 | 178 | | 174 | | 174 | |
| | | Secured Debt | (9) | 6/21/2023 | | 15.59% | SF+ | 8.00% | 2.00% | 6/21/2027 | 1,084 | | 842 | | 842 | |
| | | Secured Debt | (9) | 6/21/2023 | | 17.59% | SF+ | 10.00% | 2.00% | 6/21/2027 | 1,091 | | 848 | | 848 | |
| | | Warrants | (27) | 6/21/2023 | 48,327 | | | | | 6/21/2033 | | 523 | | 523 | |
| | | | | | | | | | | | | 2,588 | | 2,588 | |
| Jackmont Hospitality, Inc. | (10) | Franchisee of Casual Dining Restaurants | | | | | | | | | | | | |
| | | Secured Debt | (9) (26) | 10/26/2022 | | 12.46% | SF+ | 7.00% | | 11/4/2024 | 1,675 | | 1,649 | | 1,675 | |
| | | Secured Debt | (9) | 11/8/2021 | | 12.46% | SF+ | 7.00% | | 11/4/2024 | 3,948 | | 3,948 | | 3,948 | |
| | | Preferred Equity | | 11/8/2021 | 5,653,333 | | | | | | | 216 | | 2,190 | |
| | | | | | | | | | | | | 5,813 | | 7,813 | |
| Joerns Healthcare, LLC | (11) | Manufacturer and Distributor of Health Care Equipment & Supplies | | | | | | | | | | | | |
| | | Secured Debt | (9) (14) | 11/15/2021 | | 23.63% | SF+ | 18.00% | 23.63% | 1/31/2024 | 2,048 | | 2,048 | | 1,747 | |
| | | Secured Debt | (9) (14) | 8/21/2019 | | 21.63% | SF+ | 16.00% | 21.63% | 8/21/2024 | 1,708 | | 1,701 | | 121 | |
| | | Secured Debt | (9) (14) | 8/21/2019 | | 21.63% | SF+ | 16.00% | 21.63% | 8/21/2024 | 1,643 | | 1,635 | | 117 | |
| | | Common Stock | | 8/21/2019 | 392,514 | | | | | | | 3,678 | | — | |
| | | | | | | | | | | | | 9,062 | | 1,985 | |
| Johnson Downie Opco, LLC | | Executive Search Services | | | | | | | | | | | | |
| | | Secured Debt | (37) | 12/10/2021 | | | | | | 12/10/2026 | — | | (4) | | — | |
| | | Secured Debt | | 12/10/2021 | | 15.00% | | | | 12/10/2026 | 2,690 | | 2,645 | | 2,690 | |
| | | Preferred Equity | | 12/10/2021 | 368 | | | | | | | 404 | | 1,070 | |
| | | | | | | | | | | | | 3,045 | | 3,760 | |
| JorVet Holdings, LLC | | Supplier and Distributor of Veterinary Equipment and Supplies | | | | | | | | | | | | |
| | | Secured Debt | | 3/28/2022 | | 12.00% | | | | 3/28/2027 | 2,850 | | 2,814 | | 2,814 | |
| | | Preferred Equity | (8) | 3/28/2022 | 11,934 | | | | | | | 1,193 | | 1,193 | |
| | | | | | | | | | | | | 4,007 | | 4,007 | |
| JTI Electrical & Mechanical, LLC | (10) | Electrical, Mechanical and Automation Services | | | | | | | | | | | | |
| | | Secured Debt | (9) (41) | 12/22/2021 | | 11.64% | SF+ | 6.00% | | 12/22/2026 | 261 | | 253 | | 261 | |
| | | Secured Debt | (9) | 12/22/2021 | | 11.61% | SF+ | 6.00% | | 12/22/2026 | 3,000 | | 2,963 | | 3,000 | |
MSC INCOME FUND, INC.
Consolidated Schedule of Investments (Continued)
December 31, 2023
(dollars in thousands)
| | | | | | | | | | | | | | | | | | | | | | | | | | | | | | | | | | | | | | | | | | | | |
| Portfolio Company (1) (20) | | Business Description | Type of Investment (2) (3) (15) | | Investment Date (22) | Shares/Units | Total Rate | Reference Rate and Spread (25) | PIK Rate (19) | Maturity Date | Principal (4) | Cost (4) | Fair Value (18) |
| | | Common Equity | | 12/22/2021 | 140,351 | | | | | | | 140 | | 140 | |
| | | | | | | | | | | | | 3,356 | | 3,401 | |
| KMS, LLC | (10) | Wholesaler of Closeout and Value-priced Products | | | | | | | | | | | | |
| | | Secured Debt | (9) | 10/4/2021 | | 14.75% | SF+ | 9.25% | | 10/4/2026 | 1,292 | | 1,235 | | 1,180 | |
| | | Secured Debt | (9) | 10/4/2021 | | 14.75% | SF+ | 9.25% | | 10/4/2026 | 9,310 | | 9,205 | | 8,475 | |
| | | | | | | | | | | | | 10,440 | | 9,655 | |
| Lightbox Holdings, L.P. | (11) | Provider of Commercial Real Estate Software | | | | | | | | | | | | |
| | | Secured Debt | | 5/9/2019 | | 10.62% | SF+ | 5.00% | | 5/9/2026 | 5,765 | | 5,736 | | 5,592 | |
| | | | | | | | | | | | | | |
| LL Management, Inc. | (10) | Medical Transportation Service Provider | | | | | | | | | | | | |
| | | Secured Debt | (9) | 5/2/2019 | | 12.71% | SF+ | 7.25% | | 9/25/2024 | 7,960 | | 7,933 | | 7,960 | |
| | | Secured Debt | (9) | 5/2/2019 | | 12.71% | SF+ | 7.25% | | 9/25/2024 | 5,246 | | 5,228 | | 5,246 | |
| | | Secured Debt | (9) | 11/20/2020 | | 12.71% | SF+ | 7.25% | | 9/25/2024 | — | | — | | — | |
| | | Secured Debt | (9) | 2/26/2021 | | 12.71% | SF+ | 7.25% | | 9/25/2024 | 871 | | 868 | | 871 | |
| | | Secured Debt | (9) | 5/12/2022 | | 12.71% | SF+ | 7.25% | | 9/25/2024 | 8,822 | | 8,781 | | 8,822 | |
| | | | | | | | | | | | | 22,810 | | 22,899 | |
| LLFlex, LLC | (10) | Provider of Metal-Based Laminates | | | | | | | | | | | | |
| | | Secured Debt | (9) | 8/16/2021 | | 15.54% | SF+ | 9.00% | 1.00% | 8/16/2026 | 4,920 | | 4,861 | | 4,417 | |
| | | | | | | | | | | | | | |
| Logix Acquisition Company, LLC | (10) | Competitive Local Exchange Carrier | | | | | | | | | | | | |
| | | Secured Debt | (9) | 1/8/2018 | | 13.25% | P+ | 4.75% | | 12/22/2024 | 11,552 | | 11,285 | | 9,069 | |
| | | | | | | | | | | | | | |
| Mako Steel, LP | (10) | Self-Storage Design & Construction | | | | | | | | | | | | |
| | | Secured Debt | (9) (37) | 3/15/2021 | | | SF+ | 6.75% | | 3/15/2026 | — | | (36) | | — | |
| | | Secured Debt | (9) | 3/15/2021 | | 12.28% | SF+ | 6.75% | | 3/15/2026 | 16,721 | | 16,568 | | 16,721 | |
| | | | | | | | | | | | | 16,532 | | 16,721 | |
| MB2 Dental Solutions, LLC | (11) | Dental Partnership Organization | | | | | | | | | | | | |
| | | Secured Debt | (9) | 1/28/2021 | | 11.46% | SF+ | 6.00% | | 1/29/2027 | 2,803 | | 2,771 | | 2,803 | |
| | | Secured Debt | (9) | 1/28/2021 | | 11.46% | SF+ | 6.00% | | 1/29/2027 | 3,925 | | 3,880 | | 3,925 | |
| | | Secured Debt | (9) | 1/28/2021 | | 11.46% | SF+ | 6.00% | | 1/29/2027 | 3,464 | | 3,424 | | 3,464 | |
| | | Secured Debt | (9) | 1/28/2021 | | 11.46% | SF+ | 6.00% | | 1/29/2027 | 7,796 | | 7,725 | | 7,796 | |
| | | | | | | | | | | | | 17,800 | | 17,988 | |
| Metalforming Holdings, LLC | | Distributor of Sheet Metal Folding and Metal Forming Equipment | | | | | | | | | | | | |
| | | Secured Debt | (37) | 10/19/2022 | | | | | | 10/19/2024 | — | | — | | — | |
| | | Secured Debt | | 10/19/2022 | | 12.75% | | | | 10/19/2027 | 1,748 | | 1,707 | | 1,707 | |
| | | Preferred Equity | (8) | 10/19/2022 | 434,331 | 8.00% | | | 8.00% | | | 443 | | 443 | |
| | | Common Stock | | 10/19/2022 | 112,865 | | | | | | | 113 | | 110 | |
| | | | | | | | | | | | | 2,263 | | 2,260 | |
MSC INCOME FUND, INC.
Consolidated Schedule of Investments (Continued)
December 31, 2023
(dollars in thousands)
| | | | | | | | | | | | | | | | | | | | | | | | | | | | | | | | | | | | | | | | | | | | |
| Portfolio Company (1) (20) | | Business Description | Type of Investment (2) (3) (15) | | Investment Date (22) | Shares/Units | Total Rate | Reference Rate and Spread (25) | PIK Rate (19) | Maturity Date | Principal (4) | Cost (4) | Fair Value (18) |
| Microbe Formulas, LLC | (10) | Nutritional Supplements Provider | | | | | | | | | | | | |
| | | Secured Debt | (9) (37) | 4/4/2022 | | | SF+ | 6.25% | | 4/3/2028 | — | | (6) | | (6) | |
| | | Secured Debt | (9) | 4/4/2022 | | 11.46% | SF+ | 6.00% | | 4/3/2028 | 2,671 | | 2,632 | | 2,671 | |
| | | | | | | | | | | | | 2,626 | | 2,665 | |
| Mills Fleet Farm Group, LLC | (10) | Omnichannel Retailer of Work, Farm and Lifestyle Merchandise | | | | | | | | | | | | |
| | | Secured Debt | (9) | 10/24/2018 | | 12.52% | SF+ | 7.00% | | 12/31/2026 | 18,152 | | 17,863 | | 17,524 | |
| | | | | | | | | | | | | | |
| Mini Melts of America, LLC | (10) | Manufacturer and Distributor of Branded Premium Beaded Ice Cream | | | | | | | | | | | | |
| | | Secured Debt | (9) (37) | 11/30/2023 | | | SF+ | 6.25% | | 11/30/2028 | — | | (28) | | (28) | |
| | | Secured Debt | (9) (37) | 11/30/2023 | | | SF+ | 6.25% | | 11/30/2028 | — | | (10) | | (10) | |
| | | Secured Debt | (9) | 11/30/2023 | | 10.64% | SF+ | 5.25% | | 11/30/2028 | 3,225 | | 3,149 | | 3,149 | |
| | | Secured Debt | (9) | 11/30/2023 | | 12.64% | SF+ | 7.25% | | 11/30/2028 | 3,225 | | 3,146 | | 3,146 | |
| | | Common Equity | | 11/30/2023 | 300,000 | | | | | | | 300 | | 300 | |
| | | | | | | | | | | | | 6,557 | | 6,557 | |
| MonitorUS Holding, LLC | (10) (13) (21) | SaaS Provider of Media Intelligence Services | | | | | | | | | | | | |
| | | Secured Debt | | 5/24/2022 | | 14.00% | | | 4.00% | 5/24/2027 | 1,120 | | 1,106 | | 1,133 | |
| | | Secured Debt | | 5/24/2022 | | 14.00% | | | 4.00% | 5/24/2027 | 2,912 | | 2,870 | | 3,184 | |
| | | Secured Debt | | 5/24/2022 | | 14.00% | | | 4.00% | 5/24/2027 | 4,957 | | 4,890 | | 4,957 | |
| | | Common Stock | | 8/30/2022 | 12,798,820 | | | | | | | 256 | | 197 | |
| | | | | | | | | | | | | 9,122 | | 9,471 | |
| NinjaTrader, LLC | (10) | Operator of Futures Trading Platform | | | | | | | | | | | | |
| | | Secured Debt | (9) (37) | 12/18/2019 | | | SF+ | 7.00% | | 12/18/2026 | — | | (4) | | (3) | |
| | | Secured Debt | (9) (37) | 12/18/2019 | | | SF+ | 7.00% | | 12/18/2026 | — | | (12) | | (12) | |
| | | Secured Debt | (9) | 12/18/2019 | | 12.54% | SF+ | 7.00% | | 12/18/2026 | 10,991 | | 10,888 | | 10,991 | |
| | | Secured Debt | (9) | 12/18/2023 | | 12.52% | SF+ | 7.00% | | 12/18/2026 | 3,878 | | 3,807 | | 3,878 | |
| | | | | | | | | | | | | 14,679 | | 14,854 | |
| Obra Capital, Inc. (f/k/a Vida Capital, Inc.) | (11) | Alternative Asset Manager | | | | | | | | | | | | |
| | | Secured Debt | | 10/10/2019 | | 11.47% | SF+ | 6.00% | | 10/1/2026 | 7,043 | | 6,711 | | 6,039 | |
| | | | | | | | | | | | | | |
| Paragon Healthcare, Inc. | (10) | Infusion Therapy Treatment Provider | | | | | | | | | | | | |
| | | Secured Debt | (9) (37) | 1/19/2022 | | | SF+ | 5.75% | | 1/19/2027 | — | | (11) | | — | |
| | | Secured Debt | (9) (43) | 1/19/2022 | | 11.24% | SF+ | 5.75% | | 1/19/2027 | 423 | | 414 | | 421 | |
| | | Secured Debt | (9) | 1/19/2022 | | 11.25% | SF+ | 5.75% | | 1/19/2027 | 2,456 | | 2,412 | | 2,442 | |
| | | | | | | | | | | | | 2,815 | | 2,863 | |
| Power System Solutions | (10) | Backup Power Generation | | | | | | | | | | | | |
| | | Secured Debt | (9) (37) | 6/7/2023 | | | SF+ | 6.75% | | 6/7/2028 | — | | (35) | | (35) | |
| | | Secured Debt | (9) (37) | 6/7/2023 | | | SF+ | 6.75% | | 6/7/2028 | — | | (35) | | (35) | |
| | | Secured Debt | (9) | 6/7/2023 | | 12.12% | SF+ | 6.75% | | 6/7/2028 | 7,939 | | 7,729 | | 7,939 | |
| | | Common Equity | | 6/7/2023 | 532 | | | | | | | 532 | | 500 | |
MSC INCOME FUND, INC.
Consolidated Schedule of Investments (Continued)
December 31, 2023
(dollars in thousands)
| | | | | | | | | | | | | | | | | | | | | | | | | | | | | | | | | | | | | | | | | | | | |
| Portfolio Company (1) (20) | | Business Description | Type of Investment (2) (3) (15) | | Investment Date (22) | Shares/Units | Total Rate | Reference Rate and Spread (25) | PIK Rate (19) | Maturity Date | Principal (4) | Cost (4) | Fair Value (18) |
| | | | | | | | | | | | | 8,191 | | 8,369 | |
| PrimeFlight Aviation Services | (10) | Air Freight & Logistics | | | | | | | | | | | | |
| | | Secured Debt | (9) | 5/1/2023 | | 12.28% | SF+ | 6.85% | | 5/1/2029 | 5,970 | | 5,813 | | 5,970 | |
| | | Secured Debt | (9) | 9/7/2023 | | 12.20% | SF+ | 6.85% | | 5/1/2029 | 570 | | 553 | | 570 | |
| | | | | | | | | | | | | 6,366 | | 6,540 | |
| PTL US Bidco, Inc | (10) (13) (21) | Manufacturers of Equipment, Including Drilling Rigs and Equipment, and Providers of Supplies and Services to Companies Involved In the Drilling, Evaluation and Completion of Oil and Gas Wells | | | | | | | | | | | | |
| | | Secured Debt | (9) (45) | 8/19/2022 | | 12.80% | SF+ | 7.25% | | 8/19/2027 | 198 | | 189 | | 196 | |
| | | Secured Debt | (9) | 8/19/2022 | | 12.88% | SF+ | 7.25% | | 8/19/2027 | 1,734 | | 1,707 | | 1,720 | |
| | | | | | | | | | | | | 1,896 | | 1,916 | |
| Purge Rite, LLC | (10) | HVAC Flushing and Filtration Services | | | | | | | | | | | | |
| | | Secured Debt | (9) (37) | 10/2/2023 | | | SF+ | 8.00% | | 10/2/2028 | — | | (19) | | (19) | |
| | | Secured Debt | (9) | 10/2/2023 | | 13.70% | SF+ | 8.00% | | 10/2/2028 | 3,906 | | 3,813 | | 3,813 | |
| | | Preferred Equity | | 10/2/2023 | 1,302,083 | | | | | | | 1,302 | | 1,302 | |
| | | | | | | | | | | | | 5,096 | | 5,096 | |
| RA Outdoors LLC | (10) | Software Solutions Provider for Outdoor Activity Management | | | | | | | | | | | | |
| | | Secured Debt | (9) (32) | 4/8/2021 | | 12.22% | SF+ | 6.75% | | 4/8/2026 | 796 | | 789 | | 745 | |
| | | Secured Debt | (9) | 4/8/2021 | | 12.21% | SF+ | 6.75% | | 4/8/2026 | 12,917 | | 12,829 | | 12,089 | |
| | | | | | | | | | | | | 13,618 | | 12,834 | |
| Research Now Group, Inc. and Survey Sampling International, LLC | (11) | Provider of Outsourced Online Surveying | | | | | | | | | | | | |
| | | Secured Debt | (9) | 12/29/2017 | | 11.14% | SF+ | 5.50% | | 12/20/2024 | 9,691 | | 9,691 | | 7,237 | |
| | | | | | | | | | | | | | |
| Richardson Sales Solutions | (10) | Business Services | | | | | | | | | | | | |
| | | Secured Debt | (9) (34) | 8/24/2023 | | 18.47% | SF+ | 6.50% | | 8/24/2028 | 833 | | 781 | | 818 | |
| | | Secured Debt | (9) | 8/24/2023 | | 11.88% | SF+ | 6.50% | | 8/24/2028 | 10,553 | | 10,261 | | 10,362 | |
| | | | | | | | | | | | | 11,042 | | 11,180 | |
| Roof Opco, LLC | (10) | Residential Re-Roofing/Repair | | | | | | | | | | | | |
| | | Secured Debt | (9) (37) | 8/27/2021 | | | SF+ | 6.50% | | 8/27/2026 | — | | (10) | | — | |
| | | Secured Debt | (9) | 8/27/2021 | | 12.16% | SF+ | 6.50% | | 8/27/2026 | 4,219 | | 4,150 | | 4,142 | |
| | | Secured Debt | (9) | 8/27/2021 | | 14.16% | SF+ | 8.50% | | 8/27/2026 | 4,219 | | 4,150 | | 4,082 | |
| | | | | | | | | | | | | 8,290 | | 8,224 | |
| Rug Doctor, LLC. | (10) | Carpet Cleaning Products and Machinery | | | | | | | | | | | | |
| | | Secured Debt | (9) | 7/16/2021 | | 13.54% | SF+ | 6.00% | 2.00% | 11/16/2025 | 6,410 | | 6,389 | | 6,383 | |
| | | Secured Debt | (9) | 7/16/2021 | | 13.54% | SF+ | 6.00% | 2.00% | 11/16/2025 | 9,022 | | 8,991 | | 8,984 | |
| | | | | | | | | | | | | 15,380 | | 15,367 | |
| Slick Innovations, LLC | | Text Message Marketing Platform | | | | | | | | | | | | |
| | | Secured Debt | | 9/13/2018 | | 14.00% | | | | 12/22/2027 | 2,860 | | 2,777 | | 2,860 | |
| | | Common Stock | | 9/13/2018 | 17,500 | | | | | | | 114 | | 600 | |
MSC INCOME FUND, INC.
Consolidated Schedule of Investments (Continued)
December 31, 2023
(dollars in thousands)
| | | | | | | | | | | | | | | | | | | | | | | | | | | | | | | | | | | | | | | | | | | | |
| Portfolio Company (1) (20) | | Business Description | Type of Investment (2) (3) (15) | | Investment Date (22) | Shares/Units | Total Rate | Reference Rate and Spread (25) | PIK Rate (19) | Maturity Date | Principal (4) | Cost (4) | Fair Value (18) |
| | | | | | | | | | | | | 2,891 | | 3,460 | |
| South Coast Terminals Holdings, LLC | (10) | Specialty Toll Chemical Manufacturer | | | | | | | | | | | | |
| | | Secured Debt | (9) | 12/10/2021 | | 11.46% | SF+ | 6.00% | | 12/13/2026 | 38 | | 34 | | 34 | |
| | | Secured Debt | (9) | 12/10/2021 | | 11.70% | SF+ | 6.00% | | 12/13/2026 | 2,979 | | 2,943 | | 2,979 | |
| | | Common Equity | | 12/10/2021 | 60,606 | | | | | | | 61 | | 59 | |
| | | | | | | | | | | | | 3,038 | | 3,072 | |
| SPAU Holdings, LLC | (10) | Digital Photo Product Provider | | | | | | | | | | | | |
| | | Secured Debt | (9) (37) | 7/1/2022 | | | SF+ | 8.00% | | 7/1/2027 | — | | (14) | | — | |
| | | Secured Debt | (9) | 7/1/2022 | | 13.72% | SF+ | 8.00% | | 7/1/2027 | 4,925 | | 4,857 | | 4,925 | |
| | | Common Stock | | 7/1/2022 | 200,000 | | | | | | | 200 | | 160 | |
| | | | | | | | | | | | | 5,043 | | 5,085 | |
| Tex Tech Tennis, LLC | (10) | Sporting Goods & Textiles | | | | | | | | | | | | |
| | | Preferred Equity | (23) | 7/7/2021 | 1,000,000 | | | | | | | 1,000 | | 2,840 | |
| | | | | | | | | | | | | | |
| The Affiliati Network, LLC | | Performance Marketing Solutions | | | | | | | | | | | | |
| | | Secured Debt | | 8/9/2021 | | 13.00% | | | | 8/9/2026 | 40 | | 37 | | 37 | |
| | | Secured Debt | | 8/9/2021 | | 13.00% | | | | 8/9/2026 | 1,880 | | 1,858 | | 1,841 | |
| | | Preferred Stock | | 9/1/2023 | 43,027 | | | | | | | 43 | | 43 | |
| | | Preferred Stock | (8) | 8/9/2021 | 320,000 | | | | | | | 1,600 | | 1,600 | |
| | | | | | | | | | | | | 3,538 | | 3,521 | |
| U.S. TelePacific Corp. | (11) | Provider of Communications and Managed Services | | | | | | | | | | | | |
| | | Secured Debt | (9) (14) | 6/1/2023 | | 12.53% | SF+ | 7.15% | 6.00% | 5/2/2027 | 6,802 | | 2,623 | | 2,438 | |
| | | Secured Debt | (14) | 6/1/2023 | | | | | | 5/2/2027 | 692 | | 15 | | — | |
| | | | | | | | | | | | | 2,638 | | 2,438 | |
| USA DeBusk LLC | (10) | Provider of Industrial Cleaning Services | | | | | | | | | | | | |
| | | Secured Debt | (9) | 10/22/2019 | | 11.46% | SF+ | 6.00% | | 9/8/2026 | 12,405 | | 12,308 | | 12,405 | |
| | | Secured Debt | (9) | 7/19/2023 | | 11.96% | SF+ | 6.50% | | 9/8/2026 | 4,825 | | 4,742 | | 4,825 | |
| | | Secured Debt | (9) | 11/21/2023 | | 11.96% | SF+ | 6.50% | | 9/8/2026 | 2,515 | | 2,468 | | 2,515 | |
| | | | | | | | | | | | | 19,518 | | 19,745 | |
| UserZoom Technologies, Inc. | (10) | Provider of User Experience Research Automation Software | | | | | | | | | | | | |
| | | Secured Debt | (9) | 1/11/2023 | | 12.99% | SF+ | 7.50% | | 4/5/2029 | 3,000 | | 2,923 | | 3,000 | |
| | | | | | | | | | | | | | |
| Vistar Media, Inc. | (10) | Operator of Digital Out-of-Home Advertising Platform | | | | | | | | | | | | |
| | | Preferred Stock | | 4/3/2019 | 70,207 | | | | | | | 767 | | 2,180 | |
| | | | | | | | | | | | | | |
| Vitesse Systems | (10) | Component Manufacturing and Machining Platform | | | | | | | | | | | | |
| | | Secured Debt | (9) | 12/22/2023 | | 12.63% | SF+ | 7.00% | | 12/22/2028 | 12,500 | | 12,193 | | 12,193 | |
MSC INCOME FUND, INC.
Consolidated Schedule of Investments (Continued)
December 31, 2023
(dollars in thousands)
| | | | | | | | | | | | | | | | | | | | | | | | | | | | | | | | | | | | | | | | | | | | |
| Portfolio Company (1) (20) | | Business Description | Type of Investment (2) (3) (15) | | Investment Date (22) | Shares/Units | Total Rate | Reference Rate and Spread (25) | PIK Rate (19) | Maturity Date | Principal (4) | Cost (4) | Fair Value (18) |
| | | | | | | | | | | | | | |
| VORTEQ Coil Finishers, LLC | (10) | Specialty Coating of Aluminum and Light-Gauge Steel | | | | | | | | | | | | |
| | | Common Equity | (8) | 11/30/2021 | 769,231 | | | | | | | 769 | | 1,911 | |
| | | | | | | | | | | | | | |
| Wall Street Prep, Inc. | (10) | Financial Training Services | | | | | | | | | | | | |
| | | Secured Debt | (9) (37) | 7/19/2021 | | | SF+ | 7.00% | | 7/19/2026 | — | | (5) | | (5) | |
| | | Secured Debt | (9) | 7/19/2021 | | 12.54% | SF+ | 7.00% | | 7/19/2026 | 4,654 | | 4,600 | | 4,654 | |
| | | Common Stock | | 7/19/2021 | 500,000 | | | | | | | 500 | | 910 | |
| | | | | | | | | | | | | 5,095 | | 5,559 | |
| Watterson Brands, LLC | (10) | Facility Management Services | | | | | | | | | | | | |
| | | Secured Debt | (9) (41) | 12/17/2021 | | 11.50% | SF+ | 6.00% | | 12/17/2026 | 253 | | 249 | | 253 | |
| | | Secured Debt | (9) | 12/17/2021 | | 11.50% | SF+ | 6.00% | | 12/17/2026 | 53 | | 47 | | 53 | |
| | | Secured Debt | (9) | 12/17/2021 | | 11.50% | SF+ | 6.00% | | 12/17/2026 | 2,166 | | 2,146 | | 2,166 | |
| | | Secured Debt | (9) | 12/17/2021 | | 11.50% | SF+ | 6.00% | | 12/17/2026 | 1,955 | | 1,936 | | 1,955 | |
| | | | | | | | | | | | | 4,378 | | 4,427 | |
| West Star Aviation Acquisition, LLC | (10) | Aircraft, Aircraft Engine and Engine Parts | | | | | | | | | | | | |
| | | Secured Debt | (9) (42) | 3/1/2022 | | 11.34% | SF+ | 6.00% | | 3/1/2028 | 665 | | 654 | | 665 | |
| | | Secured Debt | (9) | 3/1/2022 | | 11.35% | SF+ | 6.00% | | 3/1/2028 | 2,948 | | 2,907 | | 2,947 | |
| | | Secured Debt | (9) | 11/3/2023 | | 11.35% | SF+ | 6.00% | | 3/1/2028 | 1,467 | | 1,438 | | 1,467 | |
| | | Common Stock | | 3/1/2022 | 200,000 | | | | | | | 200 | | 390 | |
| | | | | | | | | | | | | 5,199 | | 5,469 | |
| Winter Services LLC | (10) | Provider of Snow Removal and Ice Management Services | | | | | | | | | | | | |
| | | Secured Debt | (9) (35) | 11/19/2021 | | 12.64% | SF+ | 7.00% | | 11/19/2026 | 2,778 | | 2,745 | | 2,778 | |
| | | Secured Debt | (9) | 11/19/2021 | | 12.66% | SF+ | 7.00% | | 11/19/2026 | 2,583 | | 2,528 | | 2,583 | |
| | | Secured Debt | (9) | 11/19/2021 | | 12.66% | SF+ | 7.00% | | 11/19/2026 | 11,625 | | 11,479 | | 11,625 | |
| | | | | | | | | | | | | 16,752 | | 16,986 | |
| World Micro Holdings, LLC | | Supply Chain Management | | | | | | | | | | | | |
| | | Secured Debt | | 12/12/2022 | | 13.00% | | | | 12/12/2027 | 1,627 | | 1,601 | | 1,601 | |
| | | Preferred Equity | (8) | 12/12/2022 | 530 | | | | | | | 530 | | 530 | |
| | | | | | | | | | | | | 2,131 | | 2,131 | |
| Xenon Arc, Inc. | (10) | Tech-enabled Distribution Services to Chemicals and Food Ingredients Primary Producers | | | | | | | | | | | | |
| | | Secured Debt | (9) (37) | 12/17/2021 | | | SF+ | 5.25% | | 12/17/2026 | — | | (5) | | — | |
| | | Secured Debt | (9) | 12/17/2021 | | 11.22% | SF+ | 5.75% | | 12/17/2027 | 1,188 | | 1,163 | | 1,188 | |
| | | Secured Debt | (9) | 12/17/2021 | | 11.25% | SF+ | 5.75% | | 12/17/2027 | 2,352 | | 2,321 | | 2,352 | |
| | | | | | | | | | | | | 3,479 | | 3,540 | |
| YS Garments, LLC | (11) | Designer and Provider of Branded Activewear | | | | | | | | | | | | |
| | | Secured Debt | (9) | 8/22/2018 | | 13.00% | SF+ | 7.50% | | 8/9/2026 | 5,584 | | 5,485 | | 5,110 | |
| | | | | | | | | | | | | | |
MSC INCOME FUND, INC.
Consolidated Schedule of Investments (Continued)
December 31, 2023
(dollars in thousands)
| | | | | | | | | | | | | | | | | | | | | | | | | | | | | | | | | | | | | | | | | | | | |
| Portfolio Company (1) (20) | | Business Description | Type of Investment (2) (3) (15) | | Investment Date (22) | Shares/Units | Total Rate | Reference Rate and Spread (25) | PIK Rate (19) | Maturity Date | Principal (4) | Cost (4) | Fair Value (18) |
| Zips Car Wash, LLC | (10) | Express Car Wash Operator | | | | | | | | | | | | |
| | | Secured Debt | (9) (33) | 2/11/2022 | | 12.71% | SF+ | 7.25% | | 3/1/2024 | 2,356 | | 2,352 | | 2,234 | |
| | | Secured Debt | (9) (33) | 2/11/2022 | | 12.71% | SF+ | 7.25% | | 3/1/2024 | 591 | | 589 | | 555 | |
| | | | | | | | | | | | | 2,941 | | 2,789 | |
Subtotal Non-Control/Non-Affiliate Investments (120.2% of net assets at fair value) | | | | | | | | | | | | | $ | 763,781 | | $ | 747,972 | |
Total Portfolio Investments, December 31, 2023 (175.6% of net assets at fair value) | | | | | | | | | | | | | $ | 1,038,318 | | $ | 1,092,895 | |
| Money market funds (included in cash and cash equivalents) (16) | | | | | | | | | | | | | | |
| Fidelity Government Portfolio Class III Fund (38) | | | | | | | | | | | | | $ | 3,188 | | $ | 3,188 | |
| First American Treasury Obligations Fund Class Z (39) | | | | | | | | | | | | | 17,656 | | 17,656 | |
| Total money market funds | | | | | | | | | | | | | $ | 20,844 | | $ | 20,844 | |
_____________________________
(1)All investments are Lower Middle Market portfolio investments, unless otherwise noted. See Note C — Fair Value Hierarchy for Investments — Portfolio Composition for a description of Lower Middle Market portfolio investments. All of the Company’s investments, unless otherwise noted, are encumbered as security for one of the Company’s Credit Facilities.
(2)Debt investments are income producing, unless otherwise noted by footnote (14), as described below. Equity and warrants are non-income producing, unless otherwise noted by footnote (8), as described below.
(3)See Note C — Fair Value Hierarchy for Investments — Portfolio Composition and Schedule 12-14 for a summary of geographic location of portfolio companies.
(4)Principal is net of repayments. Cost is net of repayments and accumulated unearned income. Negative cost is the result of the capitalized discount being greater than the principal amount outstanding on the loan.
(5)Control investments are defined by the 1940 Act as investments in which more than 25% of the voting securities are owned or where the ability to nominate greater than 50% of the board representation is maintained.
(6)Affiliate investments are defined by the 1940 Act as investments in which between 5% and 25% (inclusive) of the voting securities are owned and the investments are not classified as Control investments.
(7)Non-Control/Non-Affiliate investments are defined by the 1940 Act as investments that are neither Control investments nor Affiliate investments.
(8)Income producing through dividends or distributions.
(9)Index based floating interest rate is subject to contractual minimum interest rate. As noted in this schedule, 95% of these floating rate loans (based on the par amount) contain LIBOR or SOFR floors which range between 0.75% and 2.00%, with a weighted-average floor of 1.17%.
(10)Private Loan portfolio investment. See Note C — Fair Value Hierarchy for Investments — Portfolio Composition for a description of Private Loan portfolio investments.
(11)Middle Market portfolio investment. See Note C — Fair Value Hierarchy for Investments — Portfolio Composition for a description of Middle Market portfolio investments.
(12)Other Portfolio investment. See Note C — Fair Value Hierarchy for Investments — Portfolio Composition for a description of Other Portfolio investments.
(13)Investment is not a qualifying asset as defined under Section 55(a) of the 1940 Act. Qualifying assets must represent at least 70% of total assets at the time of acquisition of any additional non-qualifying assets.
(14)Non-accrual and non-income producing debt investment.
(15)All of the Company’s portfolio investments are generally subject to restrictions on resale as “restricted securities.”
(16)Money market fund interests included in cash and cash equivalents.
MSC INCOME FUND, INC.
Consolidated Schedule of Investments (Continued)
December 31, 2023
(dollars in thousands)
(17)Maturity date is under on-going negotiations with the portfolio company and other lenders, if applicable.
(18)Investment fair value was determined using significant unobservable inputs, unless otherwise noted. See Note C — Fair Value Hierarchy for Investments—Portfolio Composition for further discussion. Negative fair value is the result of the capitalized discount on the loan or the unfunded commitment being valued below par.
(19)Investments may have a portion, or all, of their income received from PIK interest or dividends. PIK interest income and cumulative dividend income represent income not paid currently in cash. The difference between the Total Rate and PIK Rate represents the cash rate as of December 31, 2023.
(20)All portfolio company headquarters are based in the United States, unless otherwise noted.
(21)Portfolio company headquarters are located outside of the United States.
(22)Investment date represents the date of initial investment in the security position.
(23)Shares/Units represent ownership in a related Real Estate or HoldCo entity.
(24)Investment is not unitized. Presentation is made in percent of fully diluted ownership unless otherwise indicated.
(25)A majority of the variable rate loans in the Company’s Investment Portfolio bear interest at a rate that may be determined by reference to either LIBOR (“L”), SOFR (“SF”) or an alternate base rate (commonly based on the Federal Funds Rate or the Prime rate (“P”)), which typically resets every one, three, or six months at the borrower’s option. SOFR based contracts may include a credit spread adjustment (the “Adjustment”) that is charged in addition to the stated spread. The Adjustment is applied when the SOFR rate, plus the Adjustment, exceeds the stated floor rate, as applicable. As of December 31, 2023, SOFR based contracts in the portfolio had Adjustments ranging from 0.10% to 0.43%.
(26)As of December 31, 2023, borrowings under the loan facility bear interest at SOFR+7.00% (Floor 1.00%). Each new draw or funding on the facility has a different floating rate reset date. The rate presented represents a weighted-average rate for borrowings under the facility, as of December 31, 2023.
(27)Warrants are presented in equivalent shares/units with a strike price of $0.01 per share/unit.
(28)As of December 31, 2023, borrowings under the loan facility bore interest at SOFR+10.00%. RLOC facility permits the borrower to make an interest rate election regarding the base rate on each draw under the facility. The rate presented represents a weighted-average rate for borrowings under the facility, as of December 31, 2023.
(29)As of December 31, 2023, borrowings under the loan facility bore interest at SOFR+7.00% (Floor 1.50%). RLOC facility permits the borrower to make an interest rate election regarding the base rate on each draw under the facility. The rate presented represents a weighted-average rate for borrowings under the facility, as of December 31, 2023.
(30)As of December 31, 2023, borrowings under the loan facility bore interest at SOFR+8.00% (Floor 1.00%). RLOC facility permits the borrower to make an interest rate election regarding the base rate on each draw under the facility. The rate presented represents a weighted-average rate for borrowings under the facility, as of December 31, 2023.
(31)As of December 31, 2023, borrowings under the loan facility bore interest at SOFR+8.00% (Floor 2.00%). RLOC facility permits the borrower to make an interest rate election regarding the base rate on each draw under the facility. The rate presented represents a weighted-average rate for borrowings under the facility, as of December 31, 2023.
(32)As of December 31, 2023, borrowings under the loan facility bore interest at SOFR+6.75% (Floor 1.00%). RLOC facility permits the borrower to make an interest rate election regarding the base rate on each draw under the facility. The rate presented represents a weighted-average rate for borrowings under the facility, as of December 31, 2023.
(33)As of December 31, 2023, borrowings under the loan facility bore interest at SOFR+7.25% (Floor 1.00%). Each new draw or funding on the facility has a different floating rate reset date. The rate presented represents a weighted-average rate for borrowings under the facility, as of December 31, 2023.
(34)As of December 31, 2023, borrowings under the loan facility bore interest at SOFR+6.50% (Floor 2.00%). RLOC facility permits the borrower to make an interest rate election regarding the base rate on each draw under the facility. The rate presented represents a weighted-average rate for borrowings under the facility, as of December 31, 2023.
MSC INCOME FUND, INC.
Consolidated Schedule of Investments (Continued)
December 31, 2023
(dollars in thousands)
(35)As of December 31, 2023, borrowings under the loan facility bore interest at SOFR+7.00% (Floor 1.00%). RLOC facility permits the borrower to make an interest rate election regarding the base rate on each draw under the facility. The rate presented represents a weighted-average rate for borrowings under the facility, as of December 31, 2023.
(36)Index based floating interest rate is subject to contractual maximum base rate of 3.00%.
(37)The position is unfunded and no interest income is being earned as of December 31, 2023. The position may earn a nominal unused facility fee on committed amounts.
(38)Effective yield as of December 31, 2023 was approximately 5.25% on the Fidelity Government Portfolio Class III Fund.
(39)Effective yield as of December 31, 2023 was approximately 5.23% on the First American Treasury Obligations Fund Class Z.
(40)Warrants are presented in equivalent shares/units with a strike price of $1.00 per share/unit.
(41)As of December 31, 2023, borrowings under the loan facility bore interest at SOFR+6.00% (Floor 1.00%). RLOC facility permits the borrower to make an interest rate election regarding the base rate on each draw under the facility. The rate presented represents a weighted-average rate for borrowings under the facility, as of December 31, 2023.
(42)As of December 31, 2023, borrowings under the loan facility bore interest at SOFR+6.00% (Floor 0.75%). Each new draw or funding on the facility has a different floating rate reset date. The rate presented represents a weighted-average rate for borrowings under the facility, as of December 31, 2023.
(43)As of December 31, 2023, borrowings under the loan facility bore interest at SOFR+5.75% (Floor 1.00%). Each new draw or funding on the facility has a different floating rate reset date. The rate presented represents a weighted-average rate for borrowings under the facility, as of December 31, 2023.
(44)As of December 31, 2023, borrowings under the loan facility bore interest at SOFR+7.00% (Floor 2.00%). RLOC facility permits the borrower to make an interest rate election regarding the base rate on each draw under the facility. The rate presented represents a weighted-average rate for borrowings under the facility, as of December 31, 2023.
(45)As of December 31, 2023, borrowings under the loan facility bore interest at SOFR+7.25% (Floor 1.00%). RLOC facility permits the borrower to make an interest rate election regarding the base rate on each draw under the facility. The rate presented represents a weighted-average rate for borrowings under the facility, as of December 31, 2023.
MSC INCOME FUND, INC.
Notes to the Consolidated Financial Statements
(Unaudited)
NOTE A — ORGANIZATION AND BASIS OF PRESENTATION
1.Organization
MSC Income Fund, Inc. (“MSIF” or, together with its consolidated subsidiaries, “MSC Income Fund” or the “Company”) is a principal investment firm primarily focused on providing debt capital to private (“Private Loan”) companies owned by or in the process of being acquired by a private equity fund (its “Private Loan investment strategy”) and secondarily focused on providing customized long-term debt and equity capital solutions to lower middle market (“LMM”) companies (its “LMM investment strategy”). MSC Income Fund’s portfolio investments are typically made to support leveraged buyouts, recapitalizations, growth financings, refinancings and acquisitions of companies that operate in diverse industry sectors. MSC Income Fund seeks to partner with private equity fund sponsors in its Private Loan investment strategy and primarily invests in secured debt investments of Private Loan companies generally headquartered in the United States. MSC Income Fund also seeks to partner with entrepreneurs, business owners and management teams and generally provides “one-stop” debt and equity financing solutions within its LMM investment strategy. Through its LMM investment strategy, MSC Income Fund primarily invests in secured debt investments, equity investments, warrants and other securities of LMM companies typically based in the United States.
MSC Income Fund also maintains a legacy portfolio of investments in larger middle market (“Middle Market”) companies (its “Middle Market investment portfolio”) and a limited portfolio of other portfolio (“Other Portfolio”) investments. MSC Income Fund’s Middle Market investments are generally debt investments in companies owned by a private equity fund that were originally issued through a syndication financing process. MSC Income Fund has generally stopped making new Middle Market investments and expects its Middle Market investment portfolio to continue to decline in future periods as its existing Middle Market investments are repaid or sold. MSC Income Fund’s Other Portfolio investments primarily consist of investments that are not consistent with the typical profiles for its Private Loan, LMM or Middle Market portfolio investments, including investments in unaffiliated investment companies and private funds managed by third parties. The “Investment Portfolio,” as used herein, refers to all of MSC Income Fund’s investments in Private Loan portfolio companies, investments in LMM portfolio companies, investments in Middle Market portfolio companies and Other Portfolio investments
MSIF was formed in November 2011 to operate as an externally managed business development company (“BDC”) under the Investment Company Act of 1940, as amended (the “1940 Act”). MSIF has elected to be treated for U.S. federal income tax purposes as a regulated investment company (“RIC”) under Subchapter M of the Internal Revenue Code of 1986, as amended (the “Code”). As a result, MSIF generally does not pay corporate-level U.S. federal income taxes on any net ordinary taxable income or capital gains that it distributes to its stockholders.
On October 28, 2020, MSIF’s stockholders approved the appointment of MSC Adviser I, LLC (the “Adviser”), which is wholly-owned by Main Street Capital Corporation (“Main Street”), a New York Stock Exchange listed BDC, as MSIF’s investment adviser and administrator under an Investment Advisory and Administrative Services Agreement dated October 30, 2020 (the “Investment Advisory Agreement”). In such role, the Adviser has the responsibility to manage the business of MSC Income Fund, including the responsibility to identify, evaluate, negotiate and structure prospective investments, make investment and portfolio management decisions, monitor MSC Income Fund’s Investment Portfolio (as defined below) and provide ongoing administrative services.
MSIF has certain direct and indirect wholly-owned subsidiaries that have elected to be taxable entities (the “Taxable Subsidiaries”). The primary purpose of the Taxable Subsidiaries is to permit MSIF to hold equity investments in portfolio companies which are “pass-through” entities for tax purposes. MSIF also has certain direct and indirect wholly-owned subsidiaries formed for financing purposes (the “Structured Subsidiaries”).
Unless otherwise noted or the context otherwise indicates, the terms “we,” “us,” “our,” the “Company” and “MSC Income Fund” refer to MSIF and its consolidated subsidiaries, which include the Taxable Subsidiaries and the Structured Subsidiaries.
MSC INCOME FUND, INC.
Notes to the Consolidated Financial Statements (Continued)
(Unaudited)
2.Basis of Presentation
MSC Income Fund’s consolidated financial statements are prepared in accordance with generally accepted accounting principles in the United States of America (“U.S. GAAP”). The Company is an investment company following accounting and reporting guidance in Financial Accounting Standards Board (“FASB”) Accounting Standards Codification (“ASC”) 946, Financial Services—Investment Companies (“ASC 946”). For each of the periods presented herein, MSC Income Fund’s consolidated financial statements include the accounts of MSIF and its consolidated subsidiaries. The Investment Portfolio as used herein, refers to all of MSC Income Fund’s investments in Private Loan portfolio companies, investments in LMM portfolio companies, investments in Middle Market portfolio companies and Other Portfolio investments. MSC Income Fund’s results of operations for the three and nine months ended September 30, 2024 and 2023, cash flows for the nine months ended September 30, 2024 and 2023, and financial position as of September 30, 2024 and December 31, 2023, are presented on a consolidated basis. The effects of all intercompany transactions between MSIF and its consolidated subsidiaries have been eliminated in consolidation.
The accompanying unaudited consolidated financial statements of MSC Income Fund are presented in conformity with U.S. GAAP for interim financial information and pursuant to the requirements for reporting on Form 10-Q and Articles 6, 10 and 12 of Regulation S-X. Accordingly, certain disclosures accompanying annual consolidated financial statements prepared in accordance with U.S. GAAP are omitted. The unaudited consolidated financial statements and notes should be read in conjunction with the audited consolidated financial statements and notes thereto for the year ended December 31, 2023. In the opinion of management, the unaudited consolidated financial results included herein contain all adjustments, consisting solely of normal recurring accruals, considered necessary for the fair presentation of financial statements for the interim periods included herein. The results of operations for the three and nine months ended September 30, 2024 are not necessarily indicative of the operating results to be expected for the full year. Financial statements prepared on a U.S. GAAP basis require management to make estimates and assumptions that affect the amounts and disclosures reported in the consolidated financial statements and accompanying notes. Such estimates and assumptions could change in the future as more information becomes known, which could impact the amounts reported and disclosed herein.
Principles of Consolidation
Under ASC 946, MSC Income Fund is precluded from consolidating other entities in which MSC Income Fund has equity investments, including those in which it has a controlling interest, unless the other entity is another investment company. An exception to this general principle in ASC 946 occurs if MSC Income Fund holds a controlling interest in an operating company that provides all or substantially all of its services directly to MSC Income Fund. Accordingly, as noted above, MSC Income Fund’s consolidated financial statements include the financial position and operating results for the Taxable Subsidiaries and the Structured Subsidiaries. MSC Income Fund has determined that none of its portfolio investments qualify for this exception. Therefore, MSC Income Fund’s Investment Portfolio is carried on the Consolidated Balance Sheets at fair value, as discussed further in Note B.1. — Summary of Significant Accounting Policies — Valuation of the Investment Portfolio, with any adjustments to fair value recognized as “Net Unrealized Appreciation (Depreciation)” until the investment is realized, usually upon exit, resulting in any gain or loss being recognized as a “Net Realized Gain (Loss),” in both cases on the Consolidated Statements of Operations.
MSC INCOME FUND, INC.
Notes to the Consolidated Financial Statements (Continued)
(Unaudited)
Portfolio Investment Classification
MSC Income Fund classifies its Investment Portfolio in accordance with the requirements of the 1940 Act. Under the 1940 Act, (a) “Control Investments” are defined as investments in which MSC Income Fund owns more than 25% of the voting securities or has rights to maintain greater than 50% of the board representation, (b) “Affiliate Investments” are defined as investments in which MSC Income Fund owns between 5% and 25% (inclusive) of the voting securities and does not have rights to maintain greater than 50% of the board representation and (c) “Non-Control/Non-Affiliate Investments” are defined as investments that are neither Control Investments nor Affiliate Investments. For purposes of determining the classification of its Investment Portfolio, MSC Income Fund has excluded consideration of any voting securities or board appointment rights held by Main Street or third-party investment funds advised by the Adviser.
3.Reverse Stock Split
On December 16, 2024, the Company effectuated a 2-for-1 reverse stock split of its outstanding common stock pursuant to approval from its board of directors (the “Reverse Stock Split”). As a result of the Reverse Stock Split, every two shares of the Company’s issued and outstanding common stock were converted into one share of issued and outstanding common stock, without any change in the par value or shares authorized. All share, per share, common stock and additional paid-in capital amounts presented in these financial statements for periods prior to December 16, 2024 have been retrospectively adjusted to give effect to the Reverse Stock Split. A summary of the Company’s weighted average number of shares of common stock outstanding and earnings per share after adjusting for the Reverse Stock Split is as follows:
| | | | | | | | |
| Three months ended September 30, 2024 | Nine months ended September 30 2024 |
| Weighted average number of shares of common stock outstanding (as reported) | 80,335,969 | | 80,309,460 | |
Weighted average number of shares of common stock outstanding (as adjusted) | 40,167,985 | 40,154,730 |
Net increase in net assets per share resulting from operations (as reported) | $ | 0.09 | | $ | 0.45 | |
Net increase in net assets per share resulting from operations (as adjusted) | $ | 0.18 | | $ | 0.90 | |
NOTE B — SUMMARY OF SIGNIFICANT ACCOUNTING POLICIES
1.Valuation of the Investment Portfolio
MSC Income Fund accounts for its Investment Portfolio at fair value. As a result, MSC Income Fund follows the provisions of ASC 820, Fair Value Measurements and Disclosures (“ASC 820”). ASC 820 defines fair value, establishes a framework for measuring fair value, establishes a fair value hierarchy based on the quality of inputs used to measure fair value and enhances disclosure requirements for fair value measurements. ASC 820 requires MSC Income Fund to assume that the portfolio investment is to be sold in the principal market to independent market participants, which may be a hypothetical market. Market participants are defined as buyers and sellers in the principal market that are independent, knowledgeable and willing and able to transact.
MSC Income Fund’s portfolio strategy calls for it to invest primarily in debt securities issued by Private Loan companies and illiquid debt and equity securities issued by LMM companies. MSC Income Fund also maintains a legacy portfolio of investments in Middle Market companies and a limited portfolio of Other Portfolio investments. MSC Income Fund’s portfolio investments may be subject to restrictions on resale.
Private Loan investments may include investments which have no established market or have established markets that are not active, while LMM investments and Other Portfolio investments generally have no established trading market. Middle Market portfolio investments generally have established markets that are not active. MSC Income Fund determines in good faith the fair value of its Investment Portfolio pursuant to a valuation policy in accordance with ASC 820, with such valuation process approved by its Board of Directors and in accordance with the 1940 Act. MSC Income Fund’s valuation policies and processes are intended to provide a consistent basis for determining the fair value of MSC Income Fund’s Investment Portfolio.
MSC INCOME FUND, INC.
Notes to the Consolidated Financial Statements (Continued)
(Unaudited)
For Private Loan and Middle Market portfolio investments in debt securities for which it has determined that third-party quotes or other independent pricing are not available or appropriate, MSC Income Fund generally estimates the fair value based on the assumptions that it believes hypothetical market participants would use to value the investment in a current hypothetical sale using the yield-to-maturity model (“Yield-to-Maturity”) valuation method. For LMM portfolio investments, MSC Income Fund generally reviews external events, including private mergers, sales and acquisitions involving comparable companies, and includes these events in the valuation process by using an enterprise value waterfall methodology (“Waterfall”) for its LMM equity investments and an income approach using a Yield-to-Maturity valuation method for its LMM debt investments. For Middle Market portfolio investments in debt securities for which it has determined that third-party quotes or other independent prices are available, MSC Income Fund primarily uses quoted prices in the valuation process. MSC Income Fund determines the appropriateness of the use of third-party broker quotes, if any, in determining fair value based on its understanding of the level of actual transactions used by the broker to develop the quote and whether the quote was an indicative price or binding offer, the depth and consistency of broker quotes and the correlation of changes in broker quotes with underlying performance of the portfolio company and other market indices. For its Other Portfolio equity investments, MSC Income Fund generally calculates the fair value of the investment primarily based on the net asset value (“NAV”) of the fund and adjusts the fair value for other factors deemed relevant that would affect the fair value of the investment. All of the valuation approaches for MSC Income Fund’s portfolio investments estimate the value of the investment as if MSC Income Fund were to sell, or exit, the investment as of the measurement date.
These valuation approaches consider the value associated with MSC Income Fund’s ability to control the capital structure of the portfolio company, as well as the timing of a potential exit. For valuation purposes, “control” portfolio investments are composed of debt and equity securities in companies for which MSC Income Fund has a controlling interest in the equity ownership of the portfolio company or the ability to nominate a majority of the portfolio company’s board of directors. For valuation purposes, “non-control” portfolio investments are generally composed of debt and equity securities in companies for which MSC Income Fund does not have a controlling interest in the equity ownership of the portfolio company or the ability to nominate a majority of the portfolio company’s board of directors.
Under the Waterfall valuation method, MSC Income Fund estimates the enterprise value of a portfolio company using a combination of market and income approaches or other appropriate valuation methods, such as considering recent transactions in the equity securities of the portfolio company or third-party valuations of the portfolio company, and then performs a Waterfall calculation by allocating the enterprise value over the portfolio company’s securities in order of their preference relative to one another. The enterprise value is the fair value at which an enterprise could be sold in a transaction between two willing parties, other than through a forced or liquidation sale. Typically, privately held companies are bought and sold based on multiples of earnings before interest, taxes, depreciation and amortization (“EBITDA”), cash flows, net income, revenues, or in limited cases, book value. There is no single methodology for estimating enterprise value. For any one portfolio company, enterprise value is generally described as a range of values from which a single estimate of enterprise value is derived. In estimating the enterprise value of a portfolio company, MSC Income Fund analyzes various factors including the portfolio company’s historical and projected financial results. Due to SEC deadlines for MSC Income Fund’s quarterly and annual financial reporting, the operating results of a portfolio company used in the current period valuation are generally the results from the period ended three months prior to such valuation date and may include unaudited, projected, budgeted or pro forma financial information and may require adjustments for non-recurring items or to normalize the operating results that may require significant judgment in determining. In addition, projecting future financial results requires significant judgment regarding future growth assumptions. In evaluating the operating results, MSC Income Fund also analyzes the impact of exposure to litigation, loss of customers or other contingencies. After determining the appropriate enterprise value, MSC Income Fund allocates the enterprise value to investments in order of the legal priority of the various components of the portfolio company’s capital structure. In applying the Waterfall valuation method, MSC Income Fund assumes the loans are paid-off at the principal amount in a change in control transaction and are not assumed by the buyer, which MSC Income Fund believes is consistent with its past transaction history and standard industry practices.
MSC INCOME FUND, INC.
Notes to the Consolidated Financial Statements (Continued)
(Unaudited)
Under the Yield-to-Maturity valuation method, MSC Income Fund also uses the income approach to determine the fair value of debt securities based on projections of the discounted future free cash flows that the debt security will likely generate, including analyzing the discounted cash flows of interest and principal amounts for the debt security, as set forth in the associated loan agreements, as well as the financial position and credit risk of the portfolio company. MSC Income Fund’s estimate of the expected repayment date of its debt securities is generally the maturity date of the instrument, as MSC Income Fund generally intends to hold its loans and debt securities to maturity. The Yield-to-Maturity analysis also considers changes in leverage levels, credit quality, portfolio company performance, changes in market-based interest rates and other factors. MSC Income Fund will generally use the value determined by the Yield-to-Maturity analysis as the fair value for that security; however, because of MSC Income Fund’s general intent to hold its loans to maturity, the fair value will not exceed the principal amount of the debt security valued using the Yield-to-Maturity valuation method. A change in the assumptions that MSC Income Fund uses to estimate the fair value of its debt securities using the Yield-to-Maturity valuation method could have a material impact on the determination of fair value. If there is deterioration in credit quality or if a debt security is in workout status, MSC Income Fund may consider other factors in determining the fair value of the debt security, including the value attributable to the debt security from the enterprise value of the portfolio company or the proceeds that would most likely be received in a liquidation analysis.
Under the NAV valuation method, for an investment in an investment fund that does not have a readily determinable fair value, MSC Income Fund measures the fair value of the investment predominately based on the NAV of the investment fund as of the measurement date and adjusts the investment’s fair value for factors known to MSC Income Fund that would affect that fund’s NAV, including, but not limited to, fair values for individual investments held by the fund if MSC Income Fund holds the same investment or for a publicly traded investment. In addition, in determining the fair value of the investment, MSC Income Fund considers whether adjustments to the NAV are necessary in certain circumstances, based on the analysis of any restrictions on redemption of MSC Income Fund’s investment as of the measurement date, recent actual sales or redemptions of interests in the investment fund, and expected future cash flows available to equity holders, including the rate of return on those cash flows compared to an implied market return on equity required by market participants, or other uncertainties surrounding MSC Income Fund’s ability to realize the full NAV of its interests in the investment fund.
Pursuant to its internal valuation process and the requirements under the 1940 Act, MSC Income Fund performs valuation procedures on each of its portfolio investments quarterly. In addition to its internal valuation process, in arriving at estimates of fair value for its investments in its Private Loan portfolio companies, MSC Income Fund, among other things, consults with a nationally recognized independent financial advisory services firm (the “Financial Advisory Firm”). The Financial Advisory Firm analyzes and provides observations and recommendations and an assurance certification regarding MSC Income Fund’s determinations of the fair value of its Private Loan portfolio company investments. The Financial Advisory Firm is generally consulted relative to MSC Income Fund’s investments in each Private Loan portfolio company at least once every calendar year, and for MSC Income Fund’s investments in new Private Loan portfolio companies, at least once in the twelve-month period subsequent to the initial investment. In certain instances, MSC Income Fund may determine that it is not cost-effective, and as a result is not in its stockholders’ best interest, to consult with the Financial Advisory Firm on its investments in one or more Private Loan portfolio companies. Such instances include, but are not limited to, situations where the fair value of MSC Income Fund’s investment in a Private Loan portfolio company is determined to be insignificant relative to the total Investment Portfolio. MSC Income Fund consulted with and received an assurance certification from the Financial Advisory Firm in arriving at its determination of fair value for its investments in a total of 17 and 14 Private Loan portfolio companies during the three months ended September 30, 2024 and 2023, respectively, representing 24% and 21% of the total Private Loan portfolio at fair value as of September 30, 2024 and 2023, respectively. A total of 58 Private Loan portfolio companies were reviewed and certified by the Financial Advisory Firm during the trailing twelve months ended September 30, 2024, representing 78% of the total Private Loan portfolio at fair value as of September 30, 2024. Excluding its investments in Private Loan portfolio companies that, as of September 30, 2024, had not been in the Investment Portfolio for at least twelve months subsequent to the initial investment and its investments in Private Loan portfolio companies that were not reviewed because the investment is valued based upon third-party quotes or other independent pricing, 96% of the Private Loan portfolio at fair value was reviewed and certified by the Financial Advisory Firm during the trailing twelve months ended September 30, 2024.
MSC INCOME FUND, INC.
Notes to the Consolidated Financial Statements (Continued)
(Unaudited)
For valuation purposes, all of MSC Income Fund’s Private Loan portfolio investments are non-control investments. For Private Loan portfolio investments for which it has determined that third-party quotes or other independent pricing are not available or appropriate, MSC Income Fund generally estimates the fair value based on the assumptions that it believes hypothetical market participants would use to value such Private Loan debt investments in a current hypothetical sale using the Yield-to-Maturity valuation method and such Private Loan equity investments in a current hypothetical sale using the Waterfall valuation method.
In addition to its internal valuation process, in arriving at estimates of fair value for its investments in its LMM portfolio companies, MSC Income Fund, among other things, consults with the Financial Advisory Firm. The Financial Advisory Firm analyzes and provides observations, recommendations and an assurance certification regarding MSC Income Fund’s determinations of the fair value of its LMM portfolio company investments. The Financial Advisory Firm is generally consulted relative to MSC Income Fund’s investments in each LMM portfolio company at least once every calendar year, and for MSC Income Fund’s investments in new LMM portfolio companies, at least once in the twelve-month period subsequent to the initial investment. In certain instances, MSC Income Fund may determine that it is not cost-effective, and as a result is not in its stockholders’ best interest, to consult with the Financial Advisory Firm on its investments in one or more LMM portfolio companies. Such instances include, but are not limited to, situations where the fair value of MSC Income Fund’s investment in a LMM portfolio company is determined to be insignificant relative to the total Investment Portfolio. MSC Income Fund consulted with and received an assurance certification from the Financial Advisory Firm in arriving at its determination of fair value for its investments in a total of 12 LMM portfolio companies during each of the three months ended September 30, 2024 and 2023, representing 22% and 25% of the total LMM portfolio at fair value as of September 30, 2024 and 2023, respectively. A total of 48 LMM portfolio companies were reviewed and certified by the Financial Advisory Firm during the trailing twelve months ended September 30, 2024, representing 93% of the total LMM portfolio at fair value as of September 30, 2024. Excluding its investments in LMM portfolio companies that, as of September 30, 2024, had not been in the Investment Portfolio for at least twelve months subsequent to the initial investment or whose primary purpose is to own real estate for which a third-party appraisal is obtained on at least an annual basis, 99% of the LMM portfolio at fair value was reviewed and certified by the Financial Advisory Firm during the trailing twelve months ended September 30, 2024.
For valuation purposes, all of MSC Income Fund’s Middle Market portfolio investments are non-control investments. To the extent sufficient observable inputs are available to determine fair value, MSC Income Fund uses observable inputs to determine the fair value of these investments through obtaining third-party quotes or other independent pricing. For Middle Market portfolio investments for which it has determined that third-party quotes or other independent pricing are not available or appropriate, MSC Income Fund generally estimates the fair value based on the assumptions that it believes hypothetical market participants would use to value such Middle Market debt investments in a current hypothetical sale using the Yield-to-Maturity valuation method and such Middle Market equity investments in a current hypothetical sale using the Waterfall valuation method. MSC Income Fund generally consults on a limited basis with the Financial Advisory Firm in connection with determining the fair value of its Middle Market portfolio investments due to the nature of these investments. The vast majority (94% and 97% as of September 30, 2024 and December 31, 2023, respectively) of the Middle Market portfolio investments (i) are valued using third-party quotes or other independent pricing services or (ii) MSC Income Fund has consulted with and received an assurance certification from the Financial Advisory Firm within the last twelve months.
For valuation purposes, all of MSC Income Fund’s Other Portfolio investments are non-control investments. MSC Income Fund’s Other Portfolio investments comprised 2.2% and 2.3% of MSC Income Fund’s Investment Portfolio at fair value as of September 30, 2024 and December 31, 2023, respectively. Similar to the LMM investment portfolio, market quotations for Other Portfolio equity investments are generally not readily available. For its Other Portfolio equity investments, MSC Income Fund generally determines the fair value of these investments using the NAV valuation method.
Due to the inherent uncertainty in the valuation process, MSC Income Fund’s determination of fair value for its Investment Portfolio may differ materially from the values that would have been determined had a ready market for the securities existed. In addition, changes in the market environment, portfolio company performance and other events that may occur over the lives of the investments may cause the gains or losses ultimately realized on these investments to be materially different than the valuations currently assigned. MSC Income Fund determines the fair value of each individual investment and records changes in fair value as unrealized appreciation or depreciation.
MSC INCOME FUND, INC.
Notes to the Consolidated Financial Statements (Continued)
(Unaudited)
MSC Income Fund uses an internally developed portfolio investment rating system in connection with its investment oversight, portfolio management and analysis and investment valuation procedures for its Private Loan, LMM and Middle Market portfolio companies. This system takes into account both quantitative and qualitative factors of each Private Loan, LMM and Middle Market portfolio company.
Rule 2a-5 under the 1940 Act permits a BDC’s board of directors to designate its executive officers or investment adviser as a valuation designee to determine the fair value for its investment portfolio, subject to the active oversight of the board. MSC Income Fund’s Board of Directors has approved policies and procedures pursuant to Rule 2a-5 (the “Valuation Procedures”) and has designated the Adviser, led by a group of Main Street’s and the Adviser’s executive officers, to serve as the Board of Directors’ valuation designee. MSC Income Fund believes its Investment Portfolio as of September 30, 2024 and December 31, 2023 approximates fair value as of those dates based on the markets in which it operates and other conditions in existence on those reporting dates.
2.Use of Estimates
The preparation of financial statements in conformity with U.S. GAAP requires management to make estimates and assumptions that affect the reported amounts of assets and liabilities and disclosure of contingent assets and liabilities as of the date of the financial statements and the reported amounts of revenue and expenses during the period. Actual results may differ from these estimates under different conditions or assumptions. Additionally, as explained in Note B.1. — Summary of Significant Accounting Policies — Valuation of the Investment Portfolio, the consolidated financial statements include investments in the Investment Portfolio whose values have been estimated by MSC Income Fund pursuant to valuation policies and procedures approved and overseen by MSC Income Fund’s Board of Directors, in the absence of readily ascertainable market values. Because of the inherent uncertainty of the Investment Portfolio valuations, those estimated values may differ materially from the values that would have been determined had a ready market for the securities existed.
Macroeconomic factors, including pandemics, risk of recession, inflation, supply chain constraints or disruptions, geopolitical disruptions and changing market index interest rates, and the related effect on the U.S. and global economies, have impacted, and may continue to impact, the businesses and operating results of certain of MSC Income Fund’s portfolio companies. As a result of these and other current effects of macroeconomic factors, as well as the uncertainty regarding the extent and duration of their impact, the valuation of MSC Income Fund’s Investment Portfolio has and may continue to experience increased volatility.
3.Cash and Cash Equivalents
Cash and cash equivalents consist of cash and highly liquid investments with an original maturity of three months or less at the date of purchase. Cash and cash equivalents are carried at cost, which approximates fair value. As of September 30, 2024 and December 31, 2023, the Company had $31.2 million and $20.8 million, respectively, of cash equivalents invested in AAA-rated money market funds pending investment in the Company’s primary investment strategies. These highly liquid investments are included in the Consolidated Schedule of Investments.
As of September 30, 2024 and December 31, 2023, cash balances totaling $16.5 million and $9.0 million, respectively, exceeded Federal Deposit Insurance Corporation insurance protection levels, subjecting the Company to risk related to the uninsured balance.
4.Interest, Dividend and Fee Income
MSC Income Fund records interest and dividend income on the accrual basis to the extent amounts are expected to be collected. Dividend income is recorded when dividends are declared by the portfolio company or at such other time that an obligation exists for the portfolio company to make a distribution. MSC Income Fund evaluates accrued interest and dividend income periodically for collectability. When a loan or debt security becomes 90 days or more past due, and if MSC Income Fund otherwise does not expect the debtor to be able to service its debt obligation, MSC Income Fund will generally place the loan or debt security on non-accrual status and cease recognizing interest income on that loan or debt security until the borrower has demonstrated the ability and intent to pay contractual amounts due. If a loan or debt security’s status significantly improves regarding the debtor’s ability to service the debt obligation, or if a loan or debt security is sold or written off, MSC Income Fund removes it from non-accrual status.
MSC INCOME FUND, INC.
Notes to the Consolidated Financial Statements (Continued)
(Unaudited)
As of September 30, 2024, investments on non-accrual status comprised 2.6% of MSC Income Fund’s total Investment Portfolio at fair value and 6.5% at cost. As of December 31, 2023, investments on non-accrual status comprised 1.1% of MSC Income Fund’s total Investment Portfolio at fair value and 4.0% at cost.
MSC Income Fund holds certain debt and preferred equity instruments in its Investment Portfolio that contain PIK interest and cumulative dividend provisions. The PIK interest, computed at the contractual rate specified in each debt agreement, is periodically added to the principal balance of the debt and is recorded as interest income. Thus, the actual collection of this interest may be deferred until the time of debt principal repayment. Cumulative dividends are recorded as dividend income, and any dividends in arrears are added to the balance of the preferred equity investment. The actual collection of these dividends in arrears may be deferred until such time as the preferred equity is redeemed or sold. To maintain RIC tax treatment (as discussed in Note B.7. — Summary of Significant Accounting Policies — Income Taxes below), these non-cash sources of income may need to be paid out to stockholders in the form of distributions, even though MSC Income Fund may not have collected the PIK interest and cumulative dividends in cash. MSC Income Fund stops accruing PIK interest and cumulative dividends and writes off any accrued and uncollected interest and dividends in arrears when it determines that such PIK interest and dividends in arrears are no longer collectible. For the three months ended September 30, 2024 and 2023, (i) 6.7% and 4.6%, respectively, of MSC Income Fund’s total investment income was attributable to PIK interest income not paid currently in cash and (ii) 0.1% of MSC Income Fund’s total investment income in each period was attributable to cumulative dividend income not paid currently in cash. For the nine months ended September 30, 2024 and 2023, (i) 5.4% and 3.9%, respectively, of MSC Income Fund’s total investment income was attributable to PIK interest income not paid currently in cash and (ii) 0.1% of MSC Income Fund’s total investment income in each period was attributable to cumulative dividend income not paid currently in cash.
MSC Income Fund may periodically provide services, including structuring and advisory services, to its portfolio companies or other third parties. For services that are separately identifiable and evidence exists to substantiate fair value, fee income is recognized as earned, which is generally when the investment or other applicable transaction closes. Fees received in connection with debt financing transactions for services that do not meet these criteria are treated as debt origination fees and are generally deferred and accreted into income over the life of the financing.
A presentation of total investment income MSC Income Fund received from its Investment Portfolio in each of the periods presented is as follows:
| | | | | | | | | | | | | | | | | | | | | | | |
| Three Months Ended
September 30, | | Nine Months Ended
September 30, |
| 2024 | | 2023 | | 2024 | | 2023 |
| (dollars in thousands) |
| Interest, fee and dividend income: | | | | | | | |
| Interest income | $ | 30,236 | | | $ | 29,400 | | | $ | 88,154 | | | $ | 86,791 | |
| Dividend income | 2,485 | | | 2,399 | | | 8,964 | | | 7,862 | |
| Fee income | 756 | | | 552 | | | 4,255 | | | 1,973 | |
| Total interest, fee and dividend income | $ | 33,477 | | | $ | 32,351 | | | $ | 101,373 | | | $ | 96,626 | |
5.Deferred Financing Costs
Deferred financing costs include commitment fees and other direct costs incurred in connection with arranging MSC Income Fund’s borrowings. Deferred financing costs incurred in connection with MSC Income Fund’s multi-year revolving Credit Facilities (as defined in Note D — Debt) have been capitalized as an asset. Deferred financing costs incurred in connection with the Series A Notes (as defined in Note D — Debt) are reflected as a direct deduction from the principal amount outstanding.
6.Unearned Income—Debt Origination Fees and Original Issue Discount and Discounts / Premiums to Par Value
MSC Income Fund capitalizes debt origination fees received in connection with financings and reflects such fees as unearned income netted against the applicable debt investments. The unearned income from the fees is accreted into income over the life of the financing.
MSC INCOME FUND, INC.
Notes to the Consolidated Financial Statements (Continued)
(Unaudited)
In connection with its portfolio debt investments, MSC Income Fund sometimes receives nominal cost warrants or warrants with an exercise price below the fair value of the underlying equity (together, “nominal cost equity”) that are valued as part of the negotiation process with the particular portfolio company. When MSC Income Fund receives nominal cost equity, it allocates its cost basis in its investment between its debt security and its nominal cost equity at the time of origination based on amounts negotiated with the particular portfolio company. The allocated amounts are based upon the fair value of the nominal cost equity, which is then used to determine the allocation of cost to the debt security. Any discount recorded on a debt investment resulting from this allocation is reflected as unearned income, which is netted against the applicable debt investment, and accreted into interest income over the life of the debt investment. The actual collection of this interest is deferred until the time of debt principal repayment.
MSC Income Fund may also purchase debt securities at a discount or at a premium to the par value of the debt security. In the case of a purchase at a discount, MSC Income Fund records the investment at the par value of the debt security net of the discount, and the discount is accreted into interest income over the life of the debt investment. In the case of a purchase at a premium, MSC Income Fund records the investment at the par value of the debt security plus the premium, and the premium is amortized as a reduction to interest income over the life of the debt investment.
To maintain RIC tax treatment (as discussed in Note B.7. — Summary of Significant Accounting Policies — Income Taxes below), these non-cash sources of income may need to be paid out to stockholders in the form of distributions, even though MSC Income Fund may not have collected the interest income. For the three months ended September 30, 2024 and 2023, 3.0% and 2.6%, respectively, and for the nine months ended September 30, 2024 and 2023, 2.8% and 2.6%, respectively, of MSC Income Fund’s total investment income was attributable to interest income from the accretion of discounts associated with debt investments, net of any premium amortization.
7.Income Taxes
MSIF has elected to be treated for U.S. federal income tax purposes as a RIC. MSIF’s taxable income includes the taxable income generated by MSIF and certain of its subsidiaries, including the Structured Subsidiaries, which are treated as disregarded entities for tax purposes. As a RIC, MSIF generally will not pay corporate-level U.S. federal income taxes on any net ordinary taxable income or capital gains that MSIF distributes to its stockholders. MSIF must generally distribute at least 90% of its “investment company taxable income” (which is generally its net ordinary taxable income and realized net short-term capital gains in excess of realized net long-term capital losses) and 90% of its tax-exempt income to maintain its RIC status (pass-through tax treatment for amounts distributed). As part of maintaining RIC status, undistributed taxable income (subject to a 4% non-deductible U.S. federal excise tax) pertaining to a given fiscal year may be distributed up to twelve months subsequent to the end of that fiscal year, provided such dividends are declared on or prior to the later of (i) the filing of the U.S. federal income tax return for the applicable fiscal year or (ii) the fifteenth day of the ninth month following the close of the year in which such taxable income was generated.
The Taxable Subsidiaries primarily hold certain equity investments for MSC Income Fund. The Taxable Subsidiaries permit MSC Income Fund to hold equity investments in portfolio companies which are “pass-through” entities for tax purposes and to continue to comply with the “source-of-income” requirements contained in the RIC tax provisions of the Code. The Taxable Subsidiaries are consolidated with MSC Income Fund for U.S. GAAP financial reporting purposes, and the portfolio investments held by the Taxable Subsidiaries are included in MSC Income Fund’s consolidated financial statements as portfolio investments and recorded at fair value. The Taxable Subsidiaries are not consolidated with MSIF for income tax purposes and may generate income tax expense, or benefit, and tax assets and liabilities, as a result of their ownership of certain portfolio investments. The taxable income, or loss, of the Taxable Subsidiaries may differ from their book income, or loss, due to temporary book and tax timing differences and permanent differences. The Taxable Subsidiaries are each taxed at corporate income tax rates based on their taxable income. The income tax expense, or benefit, if any, and the related tax assets and liabilities, of the Taxable Subsidiaries are reflected in MSC Income Fund’s consolidated financial statements.
MSC INCOME FUND, INC.
Notes to the Consolidated Financial Statements (Continued)
(Unaudited)
The Taxable Subsidiaries use the liability method in accounting for income taxes. Deferred tax assets and liabilities are recorded for temporary differences between the tax basis of assets and liabilities and their reported amounts in the consolidated financial statements, using statutory tax rates in effect for the year in which the temporary differences are expected to reverse. A valuation allowance is provided, if necessary, against deferred tax assets when it is more likely than not that some portion or all of the deferred tax asset will not be realized. MSC Income Fund’s net assets as included on the Consolidated Balance Sheets and Consolidated Statements of Changes in Net Assets include an adjustment to classification as a result of permanent book-to-tax differences, which include differences in the book and tax treatment of income and expenses.
Taxable income generally differs from net income for financial reporting purposes due to temporary and permanent differences in the recognition of income and expenses. Taxable income generally excludes net unrealized appreciation or depreciation, as investment gains or losses are not included in taxable income until they are realized.
8.Net Realized Gains or Losses and Net Unrealized Appreciation or Depreciation
Realized gains or losses are measured by the difference between the net proceeds from the sale or redemption of an investment or a financial instrument and the cost basis of the investment or financial instrument, without regard to unrealized appreciation or depreciation previously recognized, and includes investments written-off during the period net of recoveries and realized gains or losses from in-kind redemptions. Net unrealized appreciation or depreciation reflects the net change in the fair value of the Investment Portfolio and financial instruments and the reclassification of any prior period unrealized appreciation or depreciation on exited investments and financial instruments to realized gains or losses.
9.Fair Value of Financial Instruments
Fair value estimates are made at discrete points in time based on relevant information. These estimates may be subjective in nature and involve uncertainties and matters of significant judgment and, therefore, cannot be determined with precision. MSC Income Fund believes that the carrying amounts of its financial instruments, consisting of cash and cash equivalents, receivables, payables and other liabilities approximate the fair values of such items due to the short-term nature of these instruments.
MSC Income Fund’s debt instruments, including all revolving and term debt, are accounted for on a historical cost basis as applicable under U.S. GAAP. As also required under U.S. GAAP, MSC Income Fund discloses the estimated fair value of its debt obligations in Note D — Debt. To estimate the fair value of MSC Income Fund’s Series A Notes as disclosed in Note D — Debt, MSC Income Fund uses the Yield-to-Maturity valuation method based on projections of the discounted future free cash flows that the debt security will likely generate, including both the discounted cash flows of the associated interest and principal amounts for the debt security. The inputs used to value MSC Income Fund’s debt instruments for purposes of the fair value estimate disclosures in Note D — Debt are considered to be Level 2 according to the ASC 820 fair value hierarchy.
10.Earnings Per Share
Net increase in net assets resulting from operations per share and net investment income per share are computed utilizing the weighted-average number of shares of common stock outstanding for the period.
11.Recently Issued or Adopted Accounting Standards
In November 2022, the FASB issued ASU 2022-06, Reference rate reform (Topic 848) — Deferral of the Sunset Date of Topic 848, which deferred the sunset date of Topic 848 from December 31, 2022 to December 31, 2024 after which entities will no longer be permitted to apply the relief in Topic 848. The Company utilized the optional expedients and exceptions provided by ASU 2020-04 and extended by ASU 2022-06 during the year ended December 31, 2023, the effect of which was not material to the consolidated financial statements and the notes thereto. For the current year, the Company will no longer utilize the optional expedients provided by ASU 2020-04, as LIBOR is no longer referenced in any of its contracts. ASU 2022-06 did not have a material impact on the consolidated financial statements and the notes thereto.
MSC INCOME FUND, INC.
Notes to the Consolidated Financial Statements (Continued)
(Unaudited)
In November 2023, the FASB issued ASU 2023-07, Segment Reporting - Improvements to Reportable Segment Disclosures. The amendments in this update require incremental disclosures related to a public entity’s reportable segments. ASU 2023-07 is effective for years beginning after December 15, 2023 and interim periods in fiscal years beginning after December 15, 2024. The Company is currently assessing the impact of the new guidance on the consolidated financial statements and the notes thereto.
In December 2023, the FASB issued ASU 2023-09, Improvements to Income Tax Disclosures. The amendments in this update require more disaggregated information on income taxes paid. ASU 2023-09 is effective for years beginning after December 15, 2024, and early adoption is permitted. The Company is currently assessing the impact of the new guidance, but it does not expect ASU 2023-09 to have a material impact on the consolidated financial statements and the notes thereto.
From time to time, new accounting pronouncements are issued by the FASB or other standards-setting bodies that are adopted by the Company as of the specified effective date. The Company believes that the impact of recently issued standards and any that are not yet effective will not have a material impact on its consolidated financial statements upon adoption.
MSC INCOME FUND, INC.
Notes to the Consolidated Financial Statements (Continued)
(Unaudited)
NOTE C — FAIR VALUE HIERARCHY FOR INVESTMENTS—PORTFOLIO COMPOSITION
ASC 820 defines fair value, establishes a framework for measuring fair value, establishes a fair value hierarchy based on the quality of inputs used to measure fair value, and enhances disclosure requirements for fair value measurements. MSC Income Fund accounts for its investments at fair value.
Fair Value Hierarchy
In accordance with ASC 820, MSC Income Fund has categorized its investments based on the priority of the inputs to the valuation technique into a three-level fair value hierarchy. The fair value hierarchy gives the highest priority to quoted prices in active markets for identical investments (Level 1) and the lowest priority to unobservable inputs (Level 3).
Investments recorded on MSC Income Fund’s Consolidated Balance Sheets are categorized based on the inputs to the valuation techniques as follows:
Level 1 — Investments whose values are based on unadjusted quoted prices for identical assets in an active market that MSC Income Fund has the ability to access (examples include investments in active exchange-traded equity securities and investments in most U.S. government and agency securities).
Level 2 — Investments whose values are based on quoted prices in markets that are not active or model inputs that are observable either directly or indirectly for substantially the full term of the investment. Level 2 inputs include the following:
•Quoted prices for similar assets in active markets (for example, investments in restricted stock);
•Quoted prices for identical or similar assets in non-active markets (for example, investments in thinly traded public companies);
•Pricing models whose inputs are observable for substantially the full term of the investment (for example, market interest rate indices); and
•Pricing models whose inputs are derived principally from, or corroborated by, observable market data through correlation or other means for substantially the full term of the investment.
Level 3 — Investments whose values are based on prices or valuation techniques that require inputs that are both unobservable and significant to the overall fair value measurement (for example, investments in illiquid securities issued by privately held companies). These inputs reflect management’s own assumptions about the assumptions a market participant would use in pricing the investment.
As required by ASC 820, when the inputs used to measure fair value fall within different levels of the hierarchy, the level within which the fair value measurement is categorized is based on the lowest level input that is significant to the fair value measurement in its entirety. For example, a Level 3 fair value measurement may include inputs that are observable (Levels 1 and 2) and unobservable (Level 3). Therefore, unrealized appreciation and depreciation related to such investments categorized within the Level 3 tables below may include changes in fair value that are attributable to both observable inputs (Levels 1 and 2) and unobservable inputs (Level 3).
As of September 30, 2024 and December 31, 2023, MSC Income Fund’s Private Loan portfolio investments primarily consisted of investments in secured debt investments. The fair value determination for these investments consisted of a combination of observable inputs in non-active markets for which sufficient observable inputs were not available to determine the fair value of these investments and unobservable inputs. As a result, all of MSC Income Fund’s Private Loan portfolio investments were categorized as Level 3 as of September 30, 2024 and December 31, 2023.
As of September 30, 2024 and December 31, 2023, all of MSC Income Fund’s LMM portfolio investments consisted of illiquid securities issued by privately held companies and the fair value determination for these investments primarily consisted of unobservable inputs. As a result, all of MSC Income Fund’s LMM portfolio investments were categorized as Level 3 as of September 30, 2024 and December 31, 2023.
MSC INCOME FUND, INC.
Notes to the Consolidated Financial Statements (Continued)
(Unaudited)
As of September 30, 2024 and December 31, 2023, MSC Income Fund’s Middle Market portfolio investments consisted primarily of investments in secured and unsecured debt investments and independently rated debt investments. The fair value determination for these investments consisted of a combination of observable inputs in non-active markets for which sufficient observable inputs were not available to determine the fair value of these investments and unobservable inputs. As a result, all of MSC Income Fund’s Middle Market portfolio investments were categorized as Level 3 as of September 30, 2024 and December 31, 2023.
As of September 30, 2024 and December 31, 2023, MSC Income Fund’s Other Portfolio investments consisted of illiquid securities issued by privately held entities and the fair value determination for these investments primarily consisted of unobservable inputs. As a result, all of MSC Income Fund’s Other Portfolio investments were categorized as Level 3 as of September 30, 2024 and December 31, 2023.
As of September 30, 2024 and December 31, 2023, all money market funds included in cash and cash equivalents were valued using Level 1 inputs.
The fair value determination of each portfolio investment categorized as Level 3 required one or more of the following unobservable inputs:
•Financial information obtained from each portfolio company, including unaudited statements of operations and balance sheets for the most recent period available as compared to budgeted numbers;
•Current and projected financial condition of the portfolio company;
•Current and projected ability of the portfolio company to service its debt obligations;
•Type and amount of collateral, if any, underlying the investment;
•Current financial ratios (e.g., fixed charge coverage ratio, interest coverage ratio and net debt/EBITDA ratio) applicable to the investment;
•Current liquidity of the investment and related financial ratios (e.g., current ratio and quick ratio);
•Pending debt or capital restructuring of the portfolio company;
•Projected operating results of the portfolio company;
•Current information regarding any offers to purchase the investment;
•Current ability of the portfolio company to raise any additional financing as needed;
•Changes in the economic environment which may have a material impact on the operating results of the portfolio company;
•Internal occurrences that may have an impact (both positive and negative) on the operating performance of the portfolio company;
•Qualitative assessment of key management;
•Contractual rights, obligations or restrictions associated with the investment; and
•Other factors deemed relevant.
MSC INCOME FUND, INC.
Notes to the Consolidated Financial Statements (Continued)
(Unaudited)
The use of significant unobservable inputs creates uncertainty in the measurement of fair value as of the reporting date. The significant unobservable inputs used in the fair value measurement of MSC Income Fund’s LMM equity securities, which are generally valued through an average of the discounted cash flow technique and the market comparable/enterprise value technique (unless one of these approaches is determined to not be appropriate), are (i) EBITDA multiples and (ii) the weighted-average cost of capital (“WACC”). Significant increases (decreases) in EBITDA multiple inputs in isolation would result in a significantly higher (lower) fair value measurement, and significant increases (decreases) in WACC inputs in isolation would result in a significantly lower (higher) fair value measurement. The significant unobservable inputs used in the fair value measurement of MSC Income Fund’s Private Loan, LMM and Middle Market debt securities are (i) risk adjusted discount rates used in the Yield-to-Maturity valuation technique (see Note B.1. — Summary of Significant Accounting Policies — Valuation of the Investment Portfolio) and (ii) the percentage of expected principal recovery. Significant increases (decreases) in any of these discount rates in isolation would result in a significantly lower (higher) fair value measurement. Significant increases (decreases) in any of these expected principal recovery percentages in isolation would result in a significantly higher (lower) fair value measurement. However, due to the nature of certain investments, fair value measurements may be based on other criteria, such as third-party appraisals of collateral and fair values as determined by independent third parties, which are not presented in the tables below.
The following tables provide a summary of the significant unobservable inputs used to fair value MSC Income Fund’s Level 3 portfolio investments as of September 30, 2024 and December 31, 2023:
| | | | | | | | | | | | | | | | | | | | | | | | | | | | | | | | | | | | | | |
Type of
Investment | | Fair Value as of
September 30,
2024
(in thousands) | | Valuation Technique | | Significant
Unobservable Inputs | | Range(3) | | Weighted-Average
(3)(4) | | Median(3) |
| Equity investments | | $ | 244,788 | | | Discounted cash flow | | WACC | | 11.3% - 22.6% | | 14.5 | % | | 15.0 | % |
| | | | Market comparable / Enterprise value | | EBITDA multiple (1) | | 4.0x - 9.2x (2) | | 7.0x | | 6.5x |
| Debt investments | | $ | 879,495 | | | Discounted cash flow | | Risk adjusted discount factor (5) | | 9.8% - 17.5% (2) | | 13.6 | % | | 12.9 | % |
| | | | | | Expected principal recovery percentage | | 0.2% - 100.0% | | 99.7 | % | | 100.0 | % |
| Debt investments | | $ | 38,344 | | | Market approach | | Third-party quote | | 27.5 - 99.0 | | 83.1 | | 91.5 |
| Total Level 3 investments | | $ | 1,162,627 | | | | | | | | | | | |
_____________________________(1)EBITDA may include proforma adjustments and/or other add-backs based on specific circumstances related to each investment.
(2)Range excludes outliers that are greater than one standard deviation from the mean. Including these outliers, the range for EBITDA multiple is 2.0x - 15.7x and the range for risk adjusted discount factor is 8.0% - 31.8%.
(3)Does not include investments for which the valuation technique does not include the use of the applicable fair value input.
(4)Weighted-average is calculated for each significant unobservable input based on the applicable security’s fair value.
(5)Discount rate includes the effect of the standard SOFR base rate, as applicable.
MSC INCOME FUND, INC.
Notes to the Consolidated Financial Statements (Continued)
(Unaudited)
| | | | | | | | | | | | | | | | | | | | | | | | | | | | | | | | | | | | | | |
Type of
Investment | | Fair Value as of
December 31, 2023
(in thousands) | | Valuation Technique | | Significant
Unobservable Inputs | | Range(3) | | Weighted-Average
(3)(4) | | Median(3) |
| Equity investments | | $ | 254,770 | | | Discounted cash flow | | WACC | | 10.9% - 22.5% | | 14.4 | % | | 15.5 | % |
| | | | Market comparable / Enterprise value | | EBITDA multiple (1) | | 4.9x - 9.2x (2) | | 7.3x | | 6.5x |
| Debt investments | | $ | 777,003 | | | Discounted cash flow | | Risk adjusted discount factor (5) | | 9.8% - 16.8% (2) | | 13.1 | % | | 12.8 | % |
| | | | | | Expected principal recovery percentage | | 0.6% - 100.0% | | 99.6 | % | | 100.0 | % |
| Debt investments | | $ | 61,122 | | | Market approach | | Third-party quote | | 4.5 - 99.2 | | 85.0 | | 89.5 |
| Total Level 3 investments | | $ | 1,092,895 | | | | | | | | | | | |
_____________________________(1)EBITDA may include proforma adjustments and/or other add-backs based on specific circumstances related to each investment.
(2)Range excludes outliers that are greater than one standard deviation from the mean. Including these outliers, the range for EBITDA multiple is 2.0x - 15.7x and the range for risk adjusted discount factor is 8.0% - 27.3%.
(3)Does not include investments for which the valuation technique does not include the use of the applicable fair value input.
(4)Weighted-average is calculated for each significant unobservable input based on the applicable security’s fair value.
(5)Discount rate includes the effect of the standard SOFR base rate, as applicable.
The following tables provide a summary of changes in fair value of MSC Income Fund’s Level 3 portfolio investments for the nine months ended September 30, 2024 and 2023 (amounts in thousands):
| | | | | | | | | | | | | | | | | | | | | | | | | | | | | | | | | | | | | | | | | | | | | | | | | | |
Type of
Investment | | Fair Value
as of
December 31,
2023 | | Transfers
Into
Level 3
Hierarchy | | Redemptions/
Repayments | | New
Investments | | Net
Changes
from
Unrealized
to Realized | | Net
Unrealized
Appreciation
(Depreciation) | | Other(1) | | Fair Value
as of
September 30,
2024 |
| Debt | | $ | 838,125 | | | $ | — | | | $ | (169,492) | | | $ | 264,572 | | | $ | 2,180 | | | $ | (17,380) | | | $ | (166) | | | $ | 917,839 | |
| Equity | | 254,029 | | | — | | | (12,075) | | | 10,127 | | | (27,394) | | | 17,987 | | | 166 | | | 242,840 | |
| Equity Warrant | | 741 | | | — | | | — | | | 1,128 | | | (90) | | | 169 | | | — | | | 1,948 | |
| | $ | 1,092,895 | | | $ | — | | | $ | (181,567) | | | $ | 275,827 | | | $ | (25,304) | | | $ | 776 | | | $ | — | | | $ | 1,162,627 | |
_____________________________(1)Includes the impact of non-cash conversions. These transactions represent non-cash investing activities. See additional cash flow information in the Consolidated Statements of Cash Flows.
| | | | | | | | | | | | | | | | | | | | | | | | | | | | | | | | | | | | | | | | | | | | | | | | | | |
Type of
Investment | | Fair Value
as of
December 31,
2022 | | Transfers
Into
Level 3
Hierarchy | | Redemptions/
Repayments | | New
Investments | | Net
Changes
from
Unrealized
to Realized | | Net
Unrealized
Appreciation
(Depreciation) | | Other(1) | | Fair Value
as of
September 30,
2023 |
| Debt | | $ | 852,282 | | | $ | — | | | $ | (146,652) | | | $ | 155,357 | | | $ | 25,417 | | | $ | (7,776) | | | $ | (11,446) | | | $ | 867,182 | |
| Equity | | 214,687 | | | — | | | (12,686) | | | 8,713 | | | 621 | | | 11,854 | | | 12,551 | | | 235,740 | |
| Equity Warrant | | 1,174 | | | — | | | — | | | 523 | | | — | | | 299 | | | (1,105) | | | 891 | |
| | $ | 1,068,143 | | | $ | — | | | $ | (159,338) | | | $ | 164,593 | | | $ | 26,038 | | | $ | 4,377 | | | $ | — | | | $ | 1,103,813 | |
_____________________________(1)Includes the impact of non-cash conversions. These transactions represent non-cash investing activities. See additional cash flow information in the Consolidated Statements of Cash Flows.
MSC INCOME FUND, INC.
Notes to the Consolidated Financial Statements (Continued)
(Unaudited)
As of September 30, 2024 and December 31, 2023, MSC Income Fund's investments at fair value were categorized as follows in the fair value hierarchy for ASC 820 purposes:
| | | | | | | | | | | | | | | | | | | | | | | | | | |
| | | | Fair Value Measurements |
| | | | (in thousands) |
| As of September 30, 2024 | | Fair Value | | Quoted Prices in
Active Markets for
Identical Assets
(Level 1) | | Significant Other
Observable Inputs
(Level 2) | | Significant
Unobservable
Inputs
(Level 3) |
| Private Loan portfolio investments | | $ | 679,863 | | | $ | — | | | $ | — | | | $ | 679,863 | |
| LMM portfolio investments | | 411,030 | | | — | | | — | | | 411,030 | |
| Middle Market portfolio investments | | 46,062 | | | — | | | — | | | 46,062 | |
| Other Portfolio investments | | 25,672 | | | — | | | — | | | 25,672 | |
| Total investments | | $ | 1,162,627 | | | $ | — | | | $ | — | | | $ | 1,162,627 | |
| | | | | | | | | | | | | | | | | | | | | | | | | | |
| | | | Fair Value Measurements |
| | | | (in thousands) |
| As of December 31, 2023 | | Fair Value | | Quoted Prices in
Active Markets for
Identical Assets
(Level 1) | | Significant Other
Observable Inputs
(Level 2) | | Significant
Unobservable
Inputs
(Level 3) |
| Private Loan portfolio investments | | $ | 595,326 | | | $ | — | | | $ | — | | | $ | 595,326 | |
| LMM portfolio investments | | 386,956 | | | — | | | — | | | 386,956 | |
| Middle Market portfolio investments | | 85,990 | | | — | | | — | | | 85,990 | |
| Other Portfolio investments | | 24,623 | | | — | | | — | | | 24,623 | |
| Total investments | | $ | 1,092,895 | | | $ | — | | | $ | — | | | $ | 1,092,895 | |
Investment Portfolio Composition
MSC Income Fund’s principal investment objective is to maximize its investment portfolio’s total return by generating current income from its debt investments and current income and capital appreciation from its equity and equity-related investments, including warrants, convertible securities and other rights to acquire equity securities in a portfolio company. MSC Income Fund seeks to achieve its investment objective primarily through its Private Loan and LMM investment strategies.
MSC Income Fund’s Private Loan investment strategy is focused on investments in secured debt in privately held companies that generally have annual revenues between $25 million and $500 million, and its Private Loan investments generally range in size from $1 million to $20 million. MSC Income Fund’s Private Loan investments primarily consist of debt securities that have primarily been originated directly by the Adviser or, to a lesser extent, through the Adviser’s strategic relationships with other investment funds on a collaborative basis through investments that are often referred to in the debt markets as “club deals” because of the small lender group size. In both cases, MSC Income Fund’s Private Loan investments are typically made in a company owned by or in the process of being acquired by a private equity fund. MSC Income Fund’s Private Loan portfolio debt investments are generally secured by a first priority lien on the assets of the portfolio company and typically have a term of between three and seven years from the original investment date. MSC Income Fund may have the option to co-invest with Main Street and the private equity fund in the equity securities of its Private Loan portfolio companies.
MSC INCOME FUND, INC.
Notes to the Consolidated Financial Statements (Continued)
(Unaudited)
MSC Income Fund’s LMM investment strategy is focused on investments in secured debt and equity in privately held, LMM companies based in the United States. MSC Income Fund’s LMM portfolio companies generally have annual revenues between $10 million and $150 million, and its LMM investments generally range in size from $1 million to $20 million. The LMM debt investments are typically secured by a first priority lien on the assets of the portfolio company, can include either fixed or floating interest rate terms and generally have a term of between five and seven years from the original investment date. MSC Income Fund typically makes direct equity investments and/or receives nominally priced equity warrants in connection with a debt investment.
MSC Income Fund also maintains a legacy portfolio of investments in Middle Market companies. MSC Income Fund’s Middle Market investments are generally debt investments in companies owned by a private equity fund that were originally issued through a syndication financing process. MSC Income Fund has generally stopped making new Middle Market investments and expects its Middle Market investment portfolio to continue to decline in future periods as its existing Middle Market investments are repaid or sold. MSC Income Fund’s Middle Market debt investments generally range in size from $1 million to $20 million, are generally secured by a first priority lien on the assets of the portfolio company and typically have an expected duration of between three and seven years from the original investment date.
MSC Income Fund’s Other Portfolio investments primarily consist of investments that are not consistent with the typical profiles for its Private Loan, LMM or Middle Market portfolio investments, including investments in unaffiliated investment companies and private funds managed by third parties. In the Other Portfolio, MSC Income Fund may incur indirect fees and expenses to third party managers. For Other Portfolio investments, MSC Income Fund generally receives distributions related to the assets held by the portfolio company. Those assets are typically expected to be realized over a five to ten-year period.
Investment income, consisting of interest, dividends and fees, can fluctuate dramatically due to various factors, including the level of new investment activity, repayments of debt investments or sales of equity interests. Investment income in any given year could also be highly concentrated among several portfolio companies. For the three and nine months ended September 30, 2024 and 2023, MSC Income Fund did not record investment income from any single portfolio company in excess of 10% of total investment income.
MSC INCOME FUND, INC.
Notes to the Consolidated Financial Statements (Continued)
(Unaudited)
The following tables provide a summary of MSC Income Fund’s investments in the Private Loan, LMM and Middle Market portfolios as of September 30, 2024 and December 31, 2023 (this information excludes Other Portfolio investments, which are discussed further below).
| | | | | | | | | | | | | | | | | |
| As of September 30, 2024 |
| Private Loan | | LMM (a) | | Middle Market |
| (dollars in millions) |
| Number of portfolio companies | 84 | | | 55 | | | 11 | |
| Fair value | $ | 679.9 | | | $ | 411.0 | | | $ | 46.1 | |
| Cost | $ | 700.0 | | | $ | 340.5 | | | $ | 73.0 | |
| Debt investments as a % of portfolio (at cost) | 95.6 | % | | 70.8 | % | | 88.9 | % |
| Equity investments as a % of portfolio (at cost) | 4.4 | % | | 29.2 | % | | 11.1 | % |
| % of debt investments at cost secured by first priority lien | 99.9 | % | | 99.9 | % | | 99.9 | % |
| Weighted-average annual effective yield (b) | 12.7 | % | | 13.2 | % | | 14.1 | % |
| Average EBITDA (c) | $ | 33.2 | | | $ | 10.0 | | | $ | 44.3 | |
_____________________________(a)As of September 30, 2024, MSC Income Fund had equity ownership in all of its LMM portfolio companies, and the average fully diluted equity ownership in those portfolio companies was 9%.
(b)The weighted-average annual effective yields were computed using the effective interest rates for all debt investments as of September 30, 2024, including amortization of deferred debt origination fees and accretion of original issue discount but excluding fees payable upon repayment of the debt instruments and any debt investments on non-accrual status, and are weighted based upon the principal amount of each applicable debt investment as of September 30, 2024. The weighted-average annual effective yield on MSC Income Fund’s debt portfolio as of September 30, 2024 including debt investments on non-accrual status was 12.1% for its Private Loan portfolio, 11.8% for its LMM portfolio and 9.4% for its Middle Market portfolio. The weighted-average annual effective yield is not reflective of what an investor in shares of MSC Income Fund’s common stock will realize on its investment because it does not reflect MSC Income Fund’s utilization of debt capital in its capital structure, MSC Income Fund’s expenses or any sales load paid by an investor.
(c)The average EBITDA is calculated using a weighted-average for the Private Loan and Middle Market portfolios and a simple average for the LMM portfolio. These calculations exclude certain portfolio companies, including two Private Loan portfolio companies, two LMM portfolio companies and one Middle Market portfolio company, as EBITDA is not a meaningful valuation metric for MSC Income Fund’s investments in these portfolio companies, and those portfolio companies whose primary purpose is to own real estate and those portfolio companies whose primary operations have ceased and only residual value remains.
MSC INCOME FUND, INC.
Notes to the Consolidated Financial Statements (Continued)
(Unaudited)
| | | | | | | | | | | | | | | | | |
| As of December 31, 2023 |
| Private Loan | | LMM (a) | | Middle Market |
| (dollars in millions) |
| Number of portfolio companies | 78 | | | 50 | | | 16 | |
| Fair value | $ | 595.3 | | | $ | 387.0 | | | $ | 86.0 | |
| Cost | $ | 586.4 | | | $ | 315.7 | | | $ | 114.7 | |
| Debt investments as a % of portfolio (at cost) | 94.1 | % | | 70.2 | % | | 93.1 | % |
| Equity investments as a % of portfolio (at cost) | 5.9 | % | | 29.8 | % | | 6.9 | % |
| % of debt investments at cost secured by first priority lien | 100.0 | % | | 99.9 | % | | 100.0 | % |
| Weighted-average annual effective yield (b) | 13.1 | % | | 13.0 | % | | 13.0 | % |
| Average EBITDA (c) | $ | 30.5 | | | $ | 8.8 | | | $ | 74.2 | |
_____________________________
(a)As of December 31, 2023, MSC Income Fund had equity ownership in all of its LMM portfolio companies, and the average fully diluted equity ownership in those portfolio companies was 9%.
(b)The weighted-average annual effective yields were computed using the effective interest rates for all debt investments as of December 31, 2023, including amortization of deferred debt origination fees and accretion of original issue discount but excluding fees payable upon repayment of the debt instruments and any debt investments on non-accrual status, and are weighted based upon the principal amount of each applicable debt investment as of December 31, 2023. The weighted-average annual effective yield on MSC Income Fund’s debt portfolio as of December 31, 2023 including debt investments on non-accrual status was 12.6% for its Private Loan portfolio, 13.0% for its LMM portfolio and 9.9% for its Middle Market portfolio. The weighted-average annual effective yield is not reflective of what an investor in shares of MSC Income Fund’s common stock will realize on its investment because it does not reflect MSC Income Fund’s utilization of debt capital in its capital structure, MSC Income Fund’s expenses or any sales load paid by an investor.
(c)The average EBITDA is calculated using a weighted-average for the Private Loan and Middle Market portfolios and a simple average for the LMM portfolio. These calculations exclude certain portfolio companies, including one Private Loan portfolio company, as EBITDA is not a meaningful valuation metric for MSC Income Fund’s investment in this portfolio company, and those portfolio companies whose primary purpose is to own real estate.
For the three months ended September 30, 2024 and 2023, MSC Income Fund achieved an annualized total return on investments of 10.5% and 12.0%, respectively. For the nine months ended September 30, 2024 and 2023, MSC Income Fund achieved an annualized total return on investments of 12.4% and 12.9%, respectively. For the year ended December 31, 2023, MSC Income Fund achieved a total return on investments of 13.6%. Total return on investments is calculated using the interest, dividend and fee income, as well as the realized and unrealized change in fair value of the Investment Portfolio for the specified period. MSC Income Fund’s total return on investments is not reflective of what an investor in shares of MSC Income Fund’s common stock will realize on its investment because it does not reflect MSC Income Fund’s utilization of debt capital in its capital structure, MSC Income Fund’s expenses or any sales load paid by an investor.
As of September 30, 2024, MSC Income Fund had Other Portfolio investments in six entities, spread across four investment managers, collectively totaling $25.7 million in fair value and $19.1 million in cost basis and which comprised 2.2% and 1.7% of MSC Income Fund’s Investment Portfolio at fair value and cost, respectively. As of December 31, 2023, MSC Income Fund had Other Portfolio investments in six entities, spread across four investment managers, collectively totaling $24.6 million in fair value and $21.5 million in cost basis and which comprised 2.3% and 2.1% of MSC Income Fund’s Investment Portfolio at fair value and cost, respectively.
MSC INCOME FUND, INC.
Notes to the Consolidated Financial Statements (Continued)
(Unaudited)
The following tables summarize the composition of MSC Income Fund’s total combined Private Loan, LMM and Middle Market portfolio investments at cost and fair value by type of investment as a percentage of the total combined Private Loan, LMM and Middle Market portfolio investments, as of September 30, 2024 and December 31, 2023 (this information excludes Other Portfolio investments, which are discussed above).
| | | | | | | | | | | | | | |
| Cost: | | September 30, 2024 | | December 31, 2023 |
| First lien debt | | 87.6 | % | | 86.5 | % |
| Equity | | 12.1 | | | 13.3 | |
| Second lien debt | | — | | | — | |
| Equity warrants | | 0.3 | | | 0.2 | |
| Other | | — | | | — | |
| | 100.0 | % | | 100.0 | % |
| | | | | | | | | | | | | | |
| Fair Value: | | September 30, 2024 | | December 31, 2023 |
| First lien debt | | 80.7 | % | | 78.4 | % |
| Equity | | 19.1 | | | 21.5 | |
| Second lien debt | | — | | | — | |
| Equity warrants | | 0.2 | | | 0.1 | |
| Other | | — | | | — | |
| | 100.0 | % | | 100.0 | % |
The following tables summarize the composition of MSC Income Fund’s total combined Private Loan, LMM and Middle Market portfolio investments by geographic region of the United States and other countries at cost and fair value as a percentage of the total combined Private Loan, LMM and Middle Market portfolio investments, as of September 30, 2024 and December 31, 2023 (this information excludes Other Portfolio investments). The geographic composition is determined by the location of the corporate headquarters of the portfolio company.
| | | | | | | | | | | | | | |
| Cost: | | September 30, 2024 | | December 31, 2023 |
| Northeast | | 22.5 | % | | 21.9 | % |
| Midwest | | 22.4 | | | 17.6 | |
| West | | 18.7 | | | 17.0 | |
| Southeast | | 17.9 | | | 17.8 | |
| Southwest | | 16.8 | | | 23.8 | |
| Canada | | 0.7 | | | 0.8 | |
| Other Non-United States | | 1.0 | | | 1.1 | |
| | 100.0 | % | | 100.0 | % |
| | | | | | | | | | | | | | |
| Fair Value: | | September 30, 2024 | | December 31, 2023 |
| Midwest | | 23.2 | % | | 18.3 | % |
| Northeast | | 22.6 | | | 21.6 | |
| Southwest | | 18.7 | | | 26.8 | |
| West | | 18.6 | | | 16.4 | |
| Southeast | | 15.2 | | | 15.0 | |
| Canada | | 0.7 | | | 0.8 | |
| Other Non-United States | | 1.0 | | | 1.1 | |
| | 100.0 | % | | 100.0 | % |
MSC INCOME FUND, INC.
Notes to the Consolidated Financial Statements (Continued)
(Unaudited)
MSC Income Fund’s Private Loan, LMM and Middle Market portfolio investments are in companies conducting business in a variety of industries. The following tables summarize the composition of MSC Income Fund’s total combined Private Loan, LMM and Middle Market portfolio investments by industry at cost and fair value as of September 30, 2024 and December 31, 2023 (this information excludes Other Portfolio investments).
| | | | | | | | | | | | | | |
| Cost: | | September 30, 2024 | | December 31, 2023 |
| Commercial Services & Supplies | | 7.8 | % | | 8.5 | % |
| Internet Software & Services | | 7.3 | | | 8.8 | |
| Machinery | | 6.9 | | | 6.0 | |
| Professional Services | | 6.3 | | | 5.7 | |
| Electrical Equipment | | 6.1 | | | 2.2 | |
| Diversified Consumer Services | | 5.2 | | | 5.4 | |
| Containers & Packaging | | 4.5 | | | 4.3 | |
| IT Services | | 4.4 | | | 5.2 | |
| Distributors | | 4.2 | | | 4.4 | |
| Health Care Providers & Services | | 4.2 | | | 6.5 | |
| Leisure Equipment & Products | | 3.5 | | | 3.7 | |
| Textiles, Apparel & Luxury Goods | | 2.8 | | | 3.1 | |
| Specialty Retail | | 2.7 | | | 2.9 | |
| Communications Equipment | | 2.5 | | | 2.7 | |
| Computers & Peripherals | | 2.5 | | | 2.9 | |
| Hotels, Restaurants & Leisure | | 2.5 | | | 2.1 | |
| Diversified Financial Services | | 2.3 | | | 2.1 | |
| Building Products | | 2.2 | | | 2.1 | |
| Construction & Engineering | | 2.2 | | | 2.5 | |
| Household Products | | 1.8 | | | 2.0 | |
| Aerospace & Defense | | 1.7 | | | 2.6 | |
| Auto Components | | 1.7 | | | 0.8 | |
| Internet & Catalog Retail | | 1.7 | | | 1.6 | |
| Software | | 1.7 | | | 1.4 | |
| Energy Equipment & Services | | 1.6 | | | 0.5 | |
| Food & Staples Retailing | | 1.6 | | | 1.5 | |
| Marine | | 1.4 | | | — | |
| Media | | 1.2 | | | 2.5 | |
| Health Care Equipment & Supplies | | 1.1 | | | 1.3 | |
| Other (1) | | 4.4 | | | 4.7 | |
| | 100.0 | % | | 100.0 | % |
_____________________________
(1)Includes various industries with each industry individually less than 1.0% of the total combined Private Loan, LMM and Middle Market portfolio investments at each date.
MSC INCOME FUND, INC.
Notes to the Consolidated Financial Statements (Continued)
(Unaudited)
| | | | | | | | | | | | | | |
| Fair Value: | | September 30, 2024 | | December 31, 2023 |
| Machinery | | 8.3 | % | | 7.4 | % |
| Commercial Services & Supplies | | 6.9 | | | 7.3 | |
| Internet Software & Services | | 6.4 | | | 7.3 | |
| Professional Services | | 6.3 | | | 5.5 | |
| Diversified Consumer Services | | 6.1 | | | 6.5 | |
| Electrical Equipment | | 6.1 | | | 2.3 | |
| Containers & Packaging | | 4.9 | | | 4.6 | |
| IT Services | | 4.5 | | | 5.0 | |
| Computers & Peripherals | | 4.4 | | | 4.6 | |
| Distributors | | 4.4 | | | 4.6 | |
| Health Care Providers & Services | | 3.8 | | | 6.0 | |
| Construction & Engineering | | 3.0 | | | 3.1 | |
| Leisure Equipment & Products | | 3.0 | | | 3.3 | |
| Specialty Retail | | 2.7 | | | 2.7 | |
| Textiles, Apparel & Luxury Goods | | 2.6 | | | 2.9 | |
| Building Products | | 2.3 | | | 1.9 | |
| Diversified Financial Services | | 2.3 | | | 2.0 | |
| Software | | 2.1 | | | 1.7 | |
| Hotels, Restaurants & Leisure | | 1.8 | | | 1.6 | |
| Household Products | | 1.8 | | | 1.9 | |
| Aerospace & Defense | | 1.7 | | | 2.5 | |
| Auto Components | | 1.7 | | | 0.8 | |
| Internet & Catalog Retail | | 1.5 | | | 1.5 | |
| Air Freight & Logistics | | 1.4 | | | 1.6 | |
| Energy Equipment & Services | | 1.4 | | | 0.3 | |
| Food & Staples Retailing | | 1.4 | | | 1.2 | |
| Media | | 1.4 | | | 2.6 | |
| Marine | | 1.3 | | | — | |
| Communications Equipment | | 1.0 | | | 1.1 | |
| Construction Materials | | — | | | 2.2 | |
| Other (1) | | 3.5 | | | 4.0 | |
| | 100.0 | % | | 100.0 | % |
_____________________________
(1)Includes various industries with each industry individually less than 1.0% of the total combined Private Loan, LMM and Middle Market portfolio investments at each date.
As of September 30, 2024 and December 31, 2023, MSC Income Fund had no portfolio investment that was greater than 10% of the Investment Portfolio at fair value.
MSC INCOME FUND, INC.
Notes to the Consolidated Financial Statements (Continued)
(Unaudited)
Unconsolidated Significant Subsidiaries
In accordance with Rules 3-09 and 4-08(g) of Regulation S-X, MSC Income Fund must determine which of its unconsolidated controlled portfolio companies, if any, are considered “significant subsidiaries.” In evaluating its unconsolidated controlled portfolio companies in accordance with Regulation S-X, there are two tests that MSC Income Fund must utilize to determine if any of MSC Income Fund’s Control Investments (as defined in Note A — Organization and Basis of Presentation, including those unconsolidated portfolio companies defined as Control Investments in which MSC Income Fund does not own greater than 50% of the voting securities nor have rights to maintain greater than 50% of the board representation) are considered significant subsidiaries: the investment test and the income test. The investment test is generally measured by dividing MSC Income Fund’s investment in the Control Investment by the value of MSC Income Fund’s total investments. The income test is generally measured by dividing the absolute value of the combined sum of total investment income, net realized gain (loss) and net unrealized appreciation (depreciation) from the relevant Control Investment for the period being tested by the absolute value of MSC Income Fund’s change in net assets resulting from operations for the same period. Rules 3-09 and 4-08(g) of Regulation S-X require MSC Income Fund to include (1) separate audited financial statements of an unconsolidated majority-owned subsidiary (Control Investments in which MSC Income Fund owns greater than 50% of the voting securities) in an annual report and (2) summarized financial information of a Control Investment in a quarterly report, respectively, if certain thresholds of the investment or income tests are exceeded and the unconsolidated portfolio company qualifies as a significant subsidiary.
As of September 30, 2024 and December 31, 2023, MSC Income Fund had no single investment that qualified as a significant subsidiary under either the investment or income tests.
MSC INCOME FUND, INC.
Notes to the Consolidated Financial Statements (Continued)
(Unaudited)
NOTE D — DEBT
Summary of MSC Income Fund’s debt as of September 30, 2024 is as follows:
| | | | | | | | | | | | | | | | | | | | | | | |
| Outstanding Balance | | Unamortized Debt Issuance Costs (1) | | Recorded Value | | Estimated Fair Value (2) |
| (dollars in thousands) |
| | | | | | | |
| SPV Facility | $ | 259,688 | | | $ | — | | | $ | 259,688 | | | $ | 259,688 | |
| | | | | | | |
| Corporate Facility | 147,000 | | | — | | | 147,000 | | | 147,000 | |
| Series A Notes | 150,000 | | | (621) | | | 149,379 | | | 138,677 | |
| Total Debt | $ | 556,688 | | | $ | (621) | | | $ | 556,067 | | | $ | 545,365 | |
_____________________________
(1)The unamortized debt issuance costs for the Credit Facilities are reflected as Deferred financing costs on the Consolidated Balance Sheets, while the deferred debt issuance costs related to the Series A Notes are reflected as a contra-liability to the Series A Notes on the Consolidated Balance Sheets.
(2)Estimated fair value for outstanding debt is shown as if MSC Income Fund had adopted the fair value option under ASC 825. See discussion of the methods used to estimate the fair value of MSC Income Fund’s debt in Note B.9. — Summary of Significant Accounting Policies — Fair Value of Financial Instruments.
Summary of MSC Income Fund’s debt as of December 31, 2023 is as follows:
| | | | | | | | | | | | | | | | | | | | | | | |
| Outstanding Balance | | Unamortized Debt Issuance Costs (1) | | Recorded Value | | Estimated Fair Value (2) |
| (dollars in thousands) |
| | | | | | | |
| SPV Facility | $ | 203,688 | | | $ | — | | | $ | 203,688 | | | $ | 203,688 | |
| | | | | | | |
| Corporate Facility | 132,000 | | | — | | | 132,000 | | | 132,000 | |
| Series A Notes | 150,000 | | | (845) | | | 149,155 | | | 141,531 | |
| Total Debt | $ | 485,688 | | | $ | (845) | | | $ | 484,843 | | | $ | 477,219 | |
_____________________________(1)The unamortized debt issuance costs for the Credit Facilities are reflected as Deferred financing costs on the Consolidated Balance Sheets, while the deferred debt issuance costs related to the Series A Notes are reflected as a contra-liability to the Series A Notes on the Consolidated Balance Sheets.
(2)Estimated fair value for outstanding debt is shown as if MSC Income Fund had adopted the fair value option under ASC 825. See discussion of the methods used to estimate the fair value of MSC Income Fund’s debt in Note B.9. — Summary of Significant Accounting Policies — Fair Value of Financial Instruments.
MSC INCOME FUND, INC.
Notes to the Consolidated Financial Statements (Continued)
(Unaudited)
Summarized interest expense for the three and nine months ended September 30, 2024 and 2023 is as follows:
| | | | | | | | | | | | | | | | | | | | | | | |
| Three Months Ended September 30, | | Nine Months Ended September 30, |
| 2024 | | 2023 | | 2024 | | 2023 |
| (dollars in thousands) |
| SPV Facility | $ | 5,904 | | | $ | 5,933 | | | $ | 17,902 | | | $ | 16,127 | |
| Corporate Facility | 2,880 | | | 1,880 | | | 6,799 | | | 5,703 | |
| Series A Notes | 1,590 | | | 1,590 | | | 4,769 | | | 4,769 | |
| | | | | | | |
| | | | | | | |
| Total Interest Expense | $ | 10,374 | | | $ | 9,403 | | | $ | 29,470 | | | $ | 26,599 | |
A summary of MSC Income Fund’s average amount of total borrowings outstanding and overall weighted-average effective interest rate including amortization of debt issuance costs, original issuance discounts and premiums and fees on unused lender commitments are as follows:
| | | | | | | | | | | | | | | | | | | | | | | |
| Three Months Ended September 30, | | Nine Months Ended September 30, |
| 2024 | | 2023 | | 2024 | | 2023 |
| (dollars in millions) |
| Weighted-average borrowings outstanding | $ | 531.1 | | | $ | 495.0 | | | $ | 504.5 | | | $ | 481.7 | |
| Weighted-average effective interest rate | 7.8 | % | | 7.6 | % | | 7.8 | % | | 7.4 | % |
SPV Facility
MSC Income Fund, through MSIF Funding, LLC (“MSIF Funding”), a wholly-owned Structured Subsidiary that primarily holds debt investments, is party to a senior secured revolving credit facility dated February 3, 2021 (as amended, the “SPV Facility” and, together with the Corporate Facility, the “Credit Facilities”) with JPMorgan Chase Bank, National Association (“JPM”), as administrative agent, and U.S. Bank, N.A., as collateral agent and collateral administrator, JPM and other financial institutions as lenders and MSIF as portfolio manager. In August 2023, the SPV facility was amended to extend the revolving period expiration date from February 3, 2024 to February 3, 2027 and the maturity date from February 3, 2025 to February 3, 2028. Additionally, total commitments were reduced from $325.0 million to $300.0 million. Advances under the SPV Facility bear interest at a per annum rate equal to the three month SOFR in effect, plus the applicable margin of 3.00%. MSIF Funding also pays a commitment fee of 0.75% per annum on the average daily unused amount of the financing commitments until February 2, 2027. As of September 30, 2024, the SPV Facility included total commitments of $300.0 million and an accordion feature, with the right to request an increase of total commitments and borrowing availability up to $450.0 million. The SPV Facility is secured by a collateral loan on the assets of MSIF Funding. In connection with the SPV Facility, MSIF Funding has made customary representations and warranties and is required to comply with various covenants, reporting requirements and other customary requirements for similar credit facilities.
As of September 30, 2024, the interest rate for borrowings on the SPV Facility was 7.84%. The average interest rate for borrowings under the SPV Facility was 8.32% and 8.25% per annum for the three months ended September 30, 2024 and 2023, respectively, and 8.32% and 7.99% per annum for the nine months ended September 30, 2024 and 2023, respectively. As of September 30, 2024, MSIF Funding was in compliance with all financial covenants of the SPV Facility.
Corporate Facility
MSC Income Fund is a party to a senior secured revolving credit agreement dated March 6, 2017 (as amended, the “Corporate Facility”) with EverBank (formerly known as TIAA Bank), as administrative agent, and with EverBank and other financial institutions as lenders. As of September 30, 2024, the Corporate Facility included (i) total commitments of $165.0 million, (ii) an accordion feature with the right to request an increase in commitments under the facility from new and existing lenders on the same terms and conditions as the existing commitments up to $200.0 million of total commitments and (iii) a revolving period and maturity date of September 1, 2025 and March 1, 2026, respectively, with two one-year extension options subject to lender approval.
MSC INCOME FUND, INC.
Notes to the Consolidated Financial Statements (Continued)
(Unaudited)
Borrowings under the Corporate Facility bear interest, subject to MSC Income Fund’s election, on a per annum basis at a rate equal to (i) SOFR plus 2.50% or (ii) the base rate plus 1.40%. The base rate is defined as the higher of (a) the Prime rate, (b) the Federal Funds Rate (as defined in the credit agreement) plus 0.5% or (c) SOFR plus 1.1%. Additionally, MSC Income Fund pays an annual unused commitment fee of 0.30% per annum on the unused lender commitments if more than 50% or more of the lender commitments are being used and an annual unused commitment fee of 0.625% per annum on the unused lender commitments if less than 50% of the lender commitments are being used. Borrowings under the Corporate Facility are secured by a first lien on all of the assets of MSIF and its subsidiaries, excluding the assets of Structured Subsidiaries or immaterial subsidiaries, as well as all of the assets, and a pledge of equity ownership interests, of any future subsidiaries of MSIF (other than Structured Subsidiaries or immaterial subsidiaries). In connection with the Corporate Facility, MSIF has made customary representations and warranties and is required to comply with various covenants, reporting requirements and other customary requirements for similar credit facilities. Effective April 27, 2023, the reference rate under the Corporate Facility was amended from LIBOR to SOFR plus an applicable credit spread adjustment of 0.10%.
As of September 30, 2024, the interest rate for borrowings on the Corporate Facility was 7.70%. The average interest rate for borrowings under the Corporate Facility was 7.81% and 7.75% per annum for the three months ended September 30, 2024 and 2023, respectively, and 7.82% and 7.39% per annum for the nine months ended September 30, 2024 and 2023, respectively. As of September 30, 2024, MSC Income Fund was in compliance with all financial covenants of the Corporate Facility.
Series A Notes
Pursuant to a Master Note Purchase Agreement dated October 21, 2021 (the “Note Purchase Agreement”), MSC Income Fund issued $77.5 million of 4.04% Series A Senior Notes due 2026 (the “Series A Notes”) upon entering into the Note Purchase Agreement and an additional $72.5 million on January 21, 2022. The Series A Notes bear a fixed interest rate of 4.04% per year and will mature on October 30, 2026, unless redeemed, purchased or prepaid prior to such date by the Company in accordance with their terms.
Interest on the Series A Notes is due semiannually on April 30 and October 30 of each year. The Series A Notes may be redeemed in whole or in part at any time or from time to time at MSC Income Fund’s option at par plus accrued interest to the prepayment date and, if applicable, a make-whole premium. In addition, MSC Income Fund is obligated to offer to prepay the Series A Notes at par plus accrued and unpaid interest up to, but excluding, the date of prepayment, if certain change in control events occur. In the event that a Below Investment Grade Event (as defined in the Note Purchase Agreement) occurs, the Series A Notes will bear interest at a fixed rate of 5.04% per year from the date of the occurrence of the Below Investment Grade Event to and until the date on which the Below Investment Grade Event ends. The Series A Notes are general unsecured obligations of MSIF that rank pari passu with all outstanding and future unsecured unsubordinated indebtedness issued by MSIF.
The Note Purchase Agreement also contains customary events of default with customary cure and notice periods, including, without limitation, nonpayment, incorrect representation in any material respect, breach of covenant, cross-default under other indebtedness of MSIF or subsidiary guarantors subject to a cure pass-through, certain judgments and orders and certain events of bankruptcy. As of September 30, 2024, MSC Income Fund was in compliance with all financial covenants of the Note Purchase Agreement.
MSC INCOME FUND, INC.
Notes to the Consolidated Financial Statements (Continued)
(Unaudited)
NOTE E—FINANCIAL HIGHLIGHTS
The following is a schedule of financial highlights of MSC Income Fund for the nine months ended September 30, 2024 and 2023:
| | | | | | | | | | | |
| Nine Months Ended September 30, |
Per Share Data (7): | 2024 | | 2023 |
| NAV as of the beginning of the period | $ | 15.54 | | | $ | 15.22 | |
| Net investment income (1) | 1.07 | | | 1.06 | |
| Net realized gain (loss) (1)(2) | 0.59 | | | (0.62) | |
| Net unrealized appreciation (depreciation) (1)(2) | (0.61) | | | 0.76 | |
| Income tax provision (1)(2) | (0.15) | | | (0.08) | |
| Net increase in net assets resulting from operations (1) | 0.90 | | | 1.12 | |
| Dividends paid from net investment income (6) | (0.76) | | | (1.05) | |
| Distributions paid from capital gains (6) | (0.33) | | | — | |
| Distributions paid or accrued (3)(6) | (1.09) | | | (1.05) | |
| | | |
| Accretive effect of stock repurchases (repurchasing shares below NAV per share) (4) | 0.02 | | | 0.04 | |
| Other (5) | 0.01 | | | 0.01 | |
| NAV as of the end of the period | $ | 15.38 | | | $ | 15.34 | |
| Shares outstanding as of the end of the period | 40,217,446 | | | 40,006,974 | |
_____________________________(1)Based on weighted-average number of common shares outstanding for the period.
(2)Net realized gains or losses, net unrealized appreciation or depreciation, and income tax provision or benefit can fluctuate significantly from period to period.
(3)Represents stockholder distributions paid or accrued for the period.
(4)Shares repurchased in connection with Dutch auction tender offers. See Note G — Share Repurchases for additional information.
(5)Includes the impact of the different share amounts as a result of calculating certain per share data based on the weighted-average basic shares outstanding during the period and certain per share data based on the shares outstanding as of a period end or transaction date.
(6)MSIF’s taxable income for each period is an estimate and will not be finally determined until MSIF files its tax return for each year. As a result, the character of MSIF’s dividends and distributions for each period is also an estimate. Therefore, the final character of MSIF’s dividends and distributions may be different than this estimate.
(7)Per share data and shares outstanding have been adjusted for the periods shown to reflect the Reverse Stock Split effected on December 16, 2024 on a retrospective basis.
MSC INCOME FUND, INC.
Notes to the Consolidated Financial Statements (Continued)
(Unaudited)
| | | | | | | | | | | |
| Nine Months Ended September 30, |
| 2024 | | 2023 |
| (dollars in thousands) |
| NAV as of the end of the period | $ | 618,485 | | | $ | 613,569 | |
| Average NAV | $ | 620,622 | | | $ | 611,329 | |
| Average outstanding debt | $ | 512,088 | | | $ | 482,021 | |
| | | |
| Ratios to average NAV: | | | |
| Ratio of total expenses, including income tax provision, to average NAV(1)(2)(3)(5) | 10.38 | % | | 9.35 | % |
| Ratio of operating expenses to average NAV(2)(3)(5) | 9.39 | % | | 8.83 | % |
| Ratio of operating expenses, excluding interest expense, to average NAV(2)(3)(5) | 4.64 | % | | 4.48 | % |
| Ratio of operating expenses, excluding interest expense and incentive fees, to average NAV(2)(3)(5) | 3.13 | % | | 3.03 | % |
| Ratio of net investment income to average NAV(2)(5) | 6.94 | % | | 6.97 | % |
| Portfolio turnover ratio(2) | 18.54 | % | | 12.32 | % |
| Total return based on change in NAV(2)(4) | 6.41 | % | | 7.36 | % |
_____________________________
(1)Total expenses are the sum of operating expenses and net income tax provision. Net income tax provision includes the accrual of net deferred tax provision relating to the net unrealized appreciation or depreciation on portfolio investments held in Taxable Subsidiaries and due to the change in the loss carryforwards, which are non-cash in nature and may vary significantly from period to period. MSC Income Fund is required to include net deferred tax provision in calculating its total expenses even though these net deferred taxes are not currently payable or receivable.
(2)Not annualized.
(3)Unless otherwise noted, operating expenses include interest, management fees, incentive fees and general and administrative expenses.
(4)Total return is calculated based on the change in NAV per share and stockholder distributions declared per share during the reporting period, divided by the NAV per share at the beginning of the period. The total return does not reflect the sales load from the sale of MSC Income Fund’s common stock.
(5)Net of expense waivers of $6.7 million and $6.3 million for the nine months ended September 30, 2024 and 2023, respectively. Excluding these expense waivers, the expense and income ratios are as follows:
| | | | | | | | | | | |
| Nine Months Ended September 30, |
| 2024 | | 2023 |
| | | |
| Ratio of total expenses, including income tax provision, to average NAV(1)(2)(3) | 11.49 | % | | 10.39 | % |
| Ratio of operating expenses to average NAV(2)(3) | 10.49 | % | | 9.87 | % |
| Ratio of operating expenses, excluding interest expense, to average NAV(2)(3) | 5.73 | % | | 5.52 | % |
| Ratio of operating expenses, excluding interest expense and incentive fees, to average NAV(2)(3) | 4.22 | % | | 4.06 | % |
| Ratio of net investment income to average NAV(2) | 5.88 | % | | 5.95 | % |
| | | |
_____________________________
See footnotes (1), (2), and (3) immediately prior to this table.
MSC INCOME FUND, INC.
Notes to the Consolidated Financial Statements (Continued)
(Unaudited)
NOTE F — DIVIDENDS, DISTRIBUTIONS AND TAXABLE INCOME
MSC Income Fund currently pays quarterly dividends to its stockholders. Future quarterly dividends, if any, will be determined by its Board of Directors on a quarterly basis. MSC Income Fund paid or accrued dividends to its common stockholders of $14.5 million, or $0.36 per share, during the three months ended September 30, 2024, and $43.7 million, or $1.09 per share, during the nine months ended September 30, 2024, compared to $14.0 million, or $0.35 per share, during the three months ended September 30, 2023, and $42.0 million, or $1.05 per share, during the nine months ended September 30, 2023. Per share amounts have been adjusted to reflect the Reverse Stock Split on a retrospective basis .
MSIF has elected to be treated for U.S. federal income tax purposes as a RIC. MSIF’s taxable income includes the taxable income generated by MSIF and certain of its subsidiaries, including the Structured Subsidiaries, which are treated as disregarded entities for tax purposes. As a RIC, MSIF generally will not pay corporate-level U.S. federal income taxes on any net ordinary taxable income or capital gains that MSIF distributes to its stockholders. MSIF must generally distribute at least 90% of its “investment company taxable income” (which is generally its net ordinary taxable income and realized net short-term capital gains in excess of realized net long-term capital losses) and 90% of its tax-exempt income to maintain its RIC status (pass-through tax treatment for amounts distributed). As part of maintaining RIC status, undistributed taxable income (subject to a 4% non-deductible U.S. federal excise tax) pertaining to a given fiscal year may be distributed up to twelve months subsequent to the end of that fiscal year, provided such dividends are declared on or prior to the later of (i) filing of the U.S. federal income tax return for the applicable fiscal year or (ii) the fifteenth day of the ninth month following the close of the year in which such taxable income was generated.
The determination of the tax attributes for MSC Income Fund’s distributions is made annually, based upon its taxable income for the full year and distributions paid for the full year. Therefore, a determination made on an interim basis may not be representative of the actual tax attributes of distributions for a full year. Ordinary dividend distributions from a RIC do not qualify for the 20% maximum tax rate (plus a 3.8% Medicare surtax, if applicable) on dividend income from domestic corporations and qualified foreign corporations, except to the extent that the RIC received the income in the form of qualifying dividends from domestic corporations and qualified foreign corporations. The tax attributes for distributions will generally include both ordinary income and qualified dividends, but may also include either one or both of capital gains and return of capital.
Listed below is a reconciliation of “Net increase in net assets resulting from operations” to taxable income and to total distributions declared to common stockholders for the nine months ended September 30, 2024 and 2023.
| | | | | | | | | | | |
| Nine Months Ended September 30, |
| 2024 | | 2023 |
| (estimated, dollars in thousands) |
| | | |
| Net increase in net assets resulting from operations | $ | 36,089 | | | $ | 44,869 | |
| Net unrealized (appreciation) depreciation | 24,656 | | | (30,415) | |
| Income tax provision | 6,150 | | | 3,189 | |
| Pre-tax book income not consolidated for tax purposes | (9,867) | | | (676) | |
| Book income and tax income differences, including debt origination, structuring fees, dividends, realized gains and changes in estimates | (9,989) | | | 20,099 | |
| Estimated taxable income (1) | 47,039 | | | 37,066 | |
| Taxable income earned in prior year and carried forward for distribution in current year | 14,745 | | | 20,674 | |
| Taxable income earned prior to period end and carried forward for distribution next period | (32,538) | | | (29,705) | |
| Dividend accrued as of period end and paid in the following period | 14,478 | | | 14,002 | |
| Total distributions accrued or paid to common stockholders | $ | 43,724 | | | $ | 42,037 | |
_____________________________
(1)MSIF’s taxable income for each period is an estimate and will not be finally determined until MSIF files its tax return for each year. Therefore, the final taxable income, and the taxable income earned in each period and carried forward for distribution in the following period, may be different than this estimate.
MSC INCOME FUND, INC.
Notes to the Consolidated Financial Statements (Continued)
(Unaudited)
The Taxable Subsidiaries primarily hold certain equity investments for MSC Income Fund. The Taxable Subsidiaries permit MSC Income Fund to hold equity investments in portfolio companies which are “pass-through” entities for tax purposes and to continue to comply with the “source-of-income” requirements contained in the RIC tax provisions of the Code. The Taxable Subsidiaries are consolidated with MSIF for U.S. GAAP financial reporting purposes, and the portfolio investments held by the Taxable Subsidiaries are included in MSC Income Fund’s consolidated financial statements as portfolio investments and recorded at fair value. The Taxable Subsidiaries are not consolidated with MSIF for income tax purposes and may generate income tax expense, or benefit, and tax assets and liabilities, as a result of their ownership of certain portfolio investments. The taxable income, or loss, of the Taxable Subsidiaries may differ from their book income, or loss, due to temporary book and tax timing differences and permanent differences. The Taxable Subsidiaries are each taxed at corporate income tax rates based on their taxable income. The income tax expense, or benefit, if any, and the related tax assets and liabilities, of the Taxable Subsidiaries are reflected in MSC Income Fund’s consolidated financial statements.
The income tax provision for MSC Income Fund is generally composed of (i) deferred tax expense, which is primarily the result of the net activity relating to the portfolio investments held in the Taxable Subsidiaries, including changes in loss carryforwards, changes in net unrealized appreciation or depreciation and other temporary book tax differences, and (ii) current tax expense, which is primarily the result of current U.S. federal income and state taxes and excise taxes on MSC Income Fund’s estimated undistributed taxable income. The income tax expense, or benefit, and the related tax assets and liabilities generated by the Taxable Subsidiaries, if any, are reflected in MSC Income Fund’s Consolidated Statements of Operations. MSC Income Fund’s provision for income taxes was comprised of the following for the three and nine months ended September 30, 2024 and 2023:
| | | | | | | | | | | | | | | | | | | | | | | |
| Three Months Ended September 30, | | Nine Months Ended September 30, |
| 2024 | | 2023 | | 2024 | | 2023 |
| (dollars in thousands) |
| Current tax expense (benefit): | | | | | | | |
| Federal | $ | 761 | | | $ | (39) | | | $ | 1,145 | | | $ | 15 | |
| State | 397 | | | 337 | | | 810 | | | 565 | |
| Excise | 491 | | | 133 | | | 570 | | | 374 | |
| Total current tax expense | 1,649 | | | 431 | | | 2,525 | | | 954 | |
| Deferred tax expense (benefit): | | | | | | | |
| Federal | 652 | | | 292 | | | 3,395 | | | 2,533 | |
| State | 133 | | | (750) | | | 230 | | | (298) | |
| Total deferred tax expense (benefit) | 785 | | | (458) | | | 3,625 | | | 2,235 | |
| | | | | | | |
| Total income tax provision (benefit) | $ | 2,434 | | | $ | (27) | | | $ | 6,150 | | | $ | 3,189 | |
The net deferred tax liability as of September 30, 2024 and December 31, 2023 was $6.9 million and $3.3 million, respectively, with the change primarily related to changes in net unrealized appreciation or depreciation, changes in loss carryforwards and other temporary book-tax differences relating to portfolio investments held by the Taxable Subsidiaries.
As of September 30, 2024, for U.S. federal income tax purposes, the Taxable Subsidiaries did not have any net operating loss carryforwards. The Taxable Subsidiaries have net capital loss carryforwards from prior years which, if unused, will expire in various taxable years 2025 through 2027. Additionally, the Taxable Subsidiaries have interest expense limitation carryforwards which have an indefinite carryforward period.
MSC INCOME FUND, INC.
Notes to the Consolidated Financial Statements (Continued)
(Unaudited)
NOTE G — SHARE REPURCHASES
Under the terms of its share repurchase program, MSC Income Fund offers to purchase shares at the NAV per share on the repurchase date. The amount of shares of MSC Income Fund’s common stock to be repurchased during any calendar quarter may be equal to the lesser of (i) the number of shares of common stock MSC Income Fund could repurchase with the proceeds it received from the issuance of common stock under MSC Income Fund’s dividend reinvestment plan or (ii) 2.5% of the weighted-average number of shares of common stock outstanding in the prior four calendar quarters. Repurchase offers are currently limited to the number of shares of common stock MSC Income Fund can repurchase with 90% of the cash retained as a result of issuances of common stock under its dividend reinvestment plan. At the discretion of the Board of Directors, MSC Income Fund may also use cash on hand, cash available from borrowings and cash from the sale of investments as of the end of the applicable period to repurchase shares. MSC Income Fund’s Board of Directors may amend, suspend or terminate the share repurchase program upon 30 days’ notice.
In addition to its share repurchase program, beginning in the second quarter of 2023, MSC Income Fund began periodically offering to complete modified Dutch auction tender offers (“Dutch Auction Tenders”), pursuant to which MSC Income Fund offered to purchase up to a specified amount of shares of its common stock at the lowest clearing purchase price elected by participating stockholders within a specified range that allowed MSC Income Fund to purchase the maximum amount offered. In such Dutch Auction Tenders all shares purchased are purchased at the clearing purchase price. SEC rules permit MSC Income Fund to increase the number of shares accepted for purchase in any Dutch Auction Tender by up to 2% of MSC Income Fund’s outstanding shares without amending the offer. MSC Income Fund has no obligation to continue to offer Dutch Auction Tenders in the future.
On February 5, 2024, MSC Income Fund commenced a modified “Dutch Auction” tender offer (the “February 2024 Dutch Auction Tender Offer”) pursuant to the Offer to Purchase, dated February 5, 2024, which expired on March 4, 2024. Pursuant to the February 2024 Dutch Auction Tender Offer, MSC Income Fund repurchased 178,572 shares on March 8, 2024 at a price of $14.00 per share for an aggregate cost of $2.5 million, excluding fees and expenses related to the February 2024 Dutch Auction Tender Offer (as adjusted to reflect the Reverse Stock Split on a retrospective basis).
On May 17, 2024, MSC Income Fund commenced a modified “Dutch Auction” tender offer (the “May 2024 Dutch Auction Tender Offer”) pursuant to the Offer to Purchase, dated May 17, 2024, which expired on June 20, 2024. Pursuant to the May 2024 Dutch Auction Tender Offer, MSC Income Fund repurchased 166,667 shares on June 25, 2024 at a price of $12.00 per share for an aggregate cost of $2.0 million, excluding fees and expenses related to the May 2024 Dutch Auction Tender Offer (as adjusted to reflect the Reverse Stock Split on a retrospective basis).
For the three months ended September 30, 2024 and 2023, MSC Income Fund funded $4.0 million and $4.2 million, respectively, for shares of its common stock tendered for repurchase under the share repurchase program. For the three months ended September 30, 2024, MSC Income Fund did not tender any shares of its common stock for repurchase through its Dutch auction tender offers. For the three months ended September 30, 2023, MSC Income Fund funded $2.8 million for shares of its common stock tendered for repurchase through its Dutch auction tender offers. For the nine months ended September 30, 2024 and 2023, MSC Income Fund funded $12.3 million and $12.5 million, respectively, for shares of its common stock tendered for repurchase under the share repurchase program. For the nine months ended September 30, 2024 and 2023, MSC Income Fund funded $4.5 million and $5.1 million, respectively, for shares of its common stock tendered for repurchase through its Dutch auction tender offers.
Since the reinstatement of its share repurchase program in March 2021, after briefly suspending it during the COVID-19 pandemic, through September 30, 2024, MSC Income Fund has funded the repurchase of $54.9 million in shares of common stock under the share repurchase program. MSC Income Fund has also purchased $12.3 million in shares of common stock through its various Dutch auction tender offers completed from June 2023 through September 30, 2024.
MSC INCOME FUND, INC.
Notes to the Consolidated Financial Statements (Continued)
(Unaudited)
NOTE H — DIVIDEND REINVESTMENT PLAN
MSC Income Fund’s dividend reinvestment plan (the “DRIP”) provides for the reinvestment of dividends on behalf of its stockholders. As a result, if MSC Income Fund declares a cash dividend, its stockholders who have “opted in” to the DRIP will have their cash dividend automatically reinvested into additional shares of MSC Income Fund common stock. The number of shares of common stock to be issued to a stockholder under the DRIP shall be determined by dividing the total dollar amount of the distribution payable to such stockholder by a price per share of common stock determined by MSC Income Fund’s Board of Directors or a committee thereof, in its sole discretion, that is (i) not less than the NAV per share of common stock determined in good faith by the Board of Directors or a committee thereof, in its sole discretion, within 48 hours prior to the payment of the distribution and (ii) not more than 2.5% greater than the NAV per share as of such date.
Summarized DRIP information for the nine months ended September 30, 2024 and 2023 is as follows (shares have been adjusted to reflect the Reverse Stock Split on a retrospective basis):
| | | | | | | | | | | |
| Nine Months Ended September 30, |
| 2024 | | 2023 |
| (dollars in thousands) |
| DRIP participation | $ | 13,578 | | | $ | 13,864 | |
| Shares issued for DRIP | 853,382 | | 883,645 |
MSC INCOME FUND, INC.
Notes to the Consolidated Financial Statements (Continued)
(Unaudited)
NOTE I—COMMITMENTS AND CONTINGENCIES
As of September 30, 2024, MSC Income Fund had the following outstanding commitments (in thousands):
| | | | | | | | |
| Investments with equity capital commitments that have not yet funded: | | Amount |
| | |
| HPEP 3, L.P. | | 1,308 | |
| Brightwood Capital Fund III, LP | | 22 | |
| | |
| Total Equity Commitments (1) | | $ | 1,330 |
| | |
| Investments with commitments to fund revolving loans that have not been fully drawn or term loans with additional commitments not yet funded: | | |
| | |
| Computer Data Source, LLC | | $ | 6,250 | |
| HEADLANDS OP-CO LLC | | 5,000 | |
| CQ Fluency, LLC | | 4,500 | |
| Mako Steel, LP | | 4,057 | |
| Insight Borrower Corporation (Industrial Physics) | | 3,888 | |
| ZRG Partners, LLC | | 3,718 | |
| Winter Services LLC | | 3,333 | |
| Hornblower Sub, LLC | | 2,432 | |
| JDC Power Services, LLC | | 2,105 | |
| BP Loenbro Holdings Inc. | | 1,798 | |
| Ansira Partners II, LLC | | 1,756 | |
| SI East, LLC (Stavig) | | 1,750 | |
| American Health Staffing Group, Inc. | | 1,667 | |
| Creative Foam Corporation | | 1,562 | |
| Burning Glass Intermediate Holding Company, Inc. | | 1,549 | |
| Bluestem Brands, Inc. | | 1,428 | |
| Titan Meter Midco Corp. | | 1,384 | |
| IG Parent Corporation (Infogain) | | 1,361 | |
| Power System Solutions | | 1,330 | |
| Buca C, LLC | | 1,321 | |
| Bettercloud, Inc. | | 1,216 | |
| Bond Brand Loyalty ULC | | 900 | |
| Imaging Business Machines, L.L.C. | | 890 | |
| Garyline, LLC | | 840 | |
| VVS Holdco LLC | | 800 | |
| Cody Pools, Inc. | | 786 | |
| PurgeRite, LLC | | 781 | |
| NinjaTrader, LLC | | 750 | |
| Sales Performance International, LLC | | 630 | |
| Centre Technologies Holdings, LLC | | 600 | |
| IG Investor, LLC (Ira Green) | | 600 | |
| South Coast Terminals Holdings, LLC | | 589 | |
| Obra Capital, Inc. | | 521 | |
| Coregistics Buyer LLC (Belvika) | | 513 | |
| AVEX Aviation Holdings, LLC | | 512 | |
| NexRev LLC | | 510 | |
| The Affiliati Network, LLC | | 500 | |
MSC INCOME FUND, INC.
Notes to the Consolidated Financial Statements (Continued)
(Unaudited)
| | | | | | | | |
| Wall Street Prep, Inc. | | 500 | |
| Island Pump and Tank, LLC | | 456 | |
| Microbe Formulas, LLC | | 434 | |
| CaseWorthy, Inc. | | 400 | |
| Johnson Downie Opco, LLC | | 400 | |
| Chamberlin Holding LLC | | 400 | |
| Trantech Radiator Topco, LLC | | 400 | |
| Colonial Electric Company LLC | | 400 | |
| Pinnacle TopCo, LLC | | 400 | |
| ArborWorks, LLC | | 382 | |
| Escalent, Inc. | | 349 | |
| Gamber-Johnson Holdings, LLC | | 300 | |
| Clad-Rex Steel, LLC | | 300 | |
| Roof Opco (Apple Roof), LLC | | 292 | |
| Career Team Holdings, LLC | | 225 | |
| SPAU Holdings, LLC | | 220 | |
| MetalForming AcquireCo, LLC | | 205 | |
| ASK (Analytical Systems Keco Holdings, LLC) | | 200 | |
| Mystic Logistics Holdings, LLC | | 200 | |
| Orttech Holdings, LLC | | 200 | |
| Batjer TopCo, LLC | | 180 | |
| PTL US Bidco, Inc | | 177 | |
| Mini Melts of America, LLC | | 150 | |
| ATS Operating, LLC | | 145 | |
| Elgin AcquireCo, LLC | | 123 | |
| Channel Partners Intermediateco, LLC | | 105 | |
| GRT Rubber Technologies LLC | | 100 | |
| LL Management, Inc.(Lab Logistics) | | 100 | |
| Gulf Publishing Holdings, LLC | | 100 | |
| AAC Holdings, Inc. | | 71 | |
| Inspire Aesthetics Management, LLC | | 43 | |
| Invincible Boat Company, LLC. | | 42 | |
| | |
| Total Loan Commitments | | $ | 72,126 | |
| | |
| Total Commitments | | $ | 73,456 | |
_____________________________
(1)This table excludes commitments related to one additional Other Portfolio investment for which the investment period has expired and remaining commitments may only be drawn to pay fund expenses or for follow on investments in existing portfolio companies. The Company does not expect any material future capital to be called on its commitment to this investment to pay fund expenses, and based on representations from the fund manager, the Company does not expect any further capital will be called on its commitment for follow on investments. As a result, the Company has excluded those commitments from this table.
MSC INCOME FUND, INC.
Notes to the Consolidated Financial Statements (Continued)
(Unaudited)
MSC Income Fund will fund its unfunded commitments from the same sources it uses to fund its investment commitments that are funded at the time they are made (which are typically through existing cash and cash equivalents and borrowings under the Credit Facilities). MSC Income Fund follows a process to manage its liquidity and ensure that it has available capital to fund its unfunded commitments as necessary. MSC Income Fund had no unrealized appreciation or depreciation on the outstanding unfunded commitments as of September 30, 2024.
MSC Income Fund may, from time to time, be involved in litigation arising out of its operations in the normal course of business or otherwise. Furthermore, third parties may try to impose liability on MSC Income Fund in connection with the activities of its portfolio companies. While the outcome of any current legal proceedings cannot at this time be predicted with certainty, MSC Income Fund does not expect any current matters will materially affect its financial condition or results of operations; however, there can be no assurance whether any pending legal proceedings will have a material adverse effect on MSC Income Fund’s financial condition or results of operations in any future reporting period.
NOTE J — RELATED PARTY TRANSACTIONS
1.Advisory Agreements and Conditional Expense Reimbursement Waivers
On October 30, 2020, MSC Income Fund entered into the Investment Advisory Agreement with the Adviser, which states that the Adviser will oversee the management of MSC Income Fund’s activities and is responsible for making investment decisions with respect to, and providing day‑to‑day management and administration of, MSC Income Fund’s Investment Portfolio. The Investment Advisory Agreement was most recently re-approved by the Board of Directors, including a majority of members who are not “interested” persons (as defined by the 1940 Act) of MSC Income Fund or the Adviser, on July 17, 2024.
Pursuant to the Investment Advisory Agreement, MSC Income Fund pays the Adviser a base management fee and incentive fees as compensation for the services described above. The base management fee is calculated at an annual rate of 1.75% of MSC Income Fund’s average gross assets. The term “gross assets” means total assets of MSC Income Fund as disclosed on MSC Income Fund’s Consolidated Balance Sheets. “Average gross assets” are calculated based on MSC Income Fund’s gross assets at the end of the two most recently completed calendar quarters. The base management fee is payable quarterly in arrears. The base management fee is expensed as incurred.
The incentive fee under the Investment Advisory Agreement consists of two parts. The first part, referred to as the subordinated incentive fee on income, is calculated and payable quarterly in arrears based on Pre-Incentive Fee Net Investment Income (as defined below) for the immediately preceding quarter. The subordinated incentive fee on income is equal to 20.0% of MSC Income Fund’s Pre-Incentive Fee Net Investment Income for the immediately preceding quarter, expressed as a quarterly rate of return on adjusted capital at the beginning of the most recently completed calendar quarter, exceeding 1.875% (or 7.5% annualized), subject to a “catch up” feature (as described below).
For this purpose, Pre-Incentive Fee Net Investment Income means interest income, dividend income and any other income (including any other fees such as commitment, origination, structuring, diligence and consulting fees or other fees that MSC Income Fund receives from portfolio companies) accrued during the calendar quarter, minus MSC Income Fund’s operating expenses for the quarter (including the management fee, expenses payable under any proposed administration agreement and any interest expense and dividends paid on any issued and outstanding preferred stock, but excluding taxes and the incentive fee). Pre-Incentive Fee Net Investment Income includes, in the case of investments with a deferred interest feature (such as original issue discount debt instruments and PIK interest and zero coupon securities), accrued income that MSC Income Fund has not yet received in cash. Pre-Incentive Fee Net Investment Income does not include any realized capital gains, realized capital losses or unrealized capital appreciation or depreciation. For purposes of this fee, adjusted capital means cumulative gross proceeds generated from sales of MSC Income Fund’s common stock (including proceeds from MSC Income Fund’s DRIP) reduced for non-liquidating distributions, other than distributions of profits, paid to MSC Income Fund’s stockholders and amounts paid for share repurchases pursuant to MSC Income Fund’s share repurchase program. The subordinated incentive fee on income is expensed in the quarter in which it is incurred.
The calculation of the subordinated incentive fee on income for each quarter is as follows:
•No subordinated incentive fee on income shall be payable to the Adviser in any calendar quarter in which MSC Income Fund’s Pre-Incentive Fee Net Investment Income does not exceed the hurdle rate of 1.875% (or 7.5% annualized) on adjusted capital;
MSC INCOME FUND, INC.
Notes to the Consolidated Financial Statements (Continued)
(Unaudited)
•100% of MSC Income Fund’s Pre-Incentive Fee Net Investment Income, if any, that exceeds the hurdle rate but is less than or equal to 2.34375% in any calendar quarter (9.375% annualized) shall be payable to the Adviser. This portion of the subordinated incentive fee on income is referred to as the “catch up” and is intended to provide the Adviser with an incentive fee of 20.0% on all of MSC Income Fund’s Pre-Incentive Fee Net Investment Income as if the hurdle rate did not apply when the Pre-Incentive Fee Net Investment Income exceeds 2.34375% (9.375% annualized) in any calendar quarter; and
•For any quarter in which MSC Income Fund’s Pre-Incentive Fee Net Investment Income exceeds 2.34375% (9.375% annualized), the subordinated incentive fee on income shall equal 20.0% of the amount of MSC Income Fund’s Pre-Incentive Fee Net Investment Income, as the hurdle rate and catch-up will have been achieved.
The second part of the incentive fee, referred to as the incentive fee on capital gains, is an incentive fee on realized capital gains earned from the portfolio of MSC Income Fund and is determined and payable in arrears as of the end of each calendar year (or upon termination of the Investment Advisory Agreement). This fee equals 20.0% of MSC Income Fund’s incentive fee capital gains, which equals MSC Income Fund’s realized capital gains on a cumulative basis from inception, calculated as of the end of each calendar year, computed net of all realized capital losses and unrealized capital depreciation on a cumulative basis, less the aggregate amount of any previously paid capital gain incentive fees. At the end of each reporting period, MSC Income Fund estimates the incentive fee on capital gains and accrues the fee based on a hypothetical liquidation of its portfolio. Therefore, the accrual includes both net realized gains and net unrealized gains (the net unrealized difference between the fair value and the par value of its portfolio), if any. The incentive fee accrued pertaining to the unrealized gain is neither earned nor payable to the Adviser until such time it is realized.
For the three months ended September 30, 2024 and 2023, MSC Income Fund incurred base management fees of $5.3 million and $5.0 million, respectively. For the three months ended September 30, 2024 and 2023, MSC Income Fund incurred subordinated incentive fees on income of $2.1 million and $2.6 million, respectively. For each of the three months ended September 30, 2024 and 2023, MSC Income Fund did not incur any capital gains incentive fees. For the nine months ended September 30, 2024 and 2023, MSC Income Fund incurred base management fees of $15.5 million and $14.8 million, respectively. For the nine months ended September 30, 2024 and 2023, MSC Income Fund incurred subordinated incentive fees on income of $9.4 million and $8.9 million, respectively. For each of the nine months ended September 30, 2024 and 2023, MSC Income Fund did not incur any capital gains incentive fees.
Pursuant to the Investment Advisory Agreement, MSC Income Fund is required to pay or reimburse the Adviser for administrative services expenses, which include all costs and expenses related to MSC Income Fund’s day-to-day administration and management not related to advisory services, whether such administrative services were performed by a third-party service provider or the Adviser or its affiliates (to the extent performed by the Adviser or its affiliates, the “Internal Administrative Services”). Internal Administrative Services include, but are not limited to, the cost of an Adviser’s personnel performing accounting and compliance functions and other administrative services on behalf of MSC Income Fund.
The Adviser waived reimbursement of all Internal Administrative Services expenses from October 30, 2020 through December 31, 2021. On January 1, 2022, the Adviser assumed responsibility of certain administrative services that were previously provided for MSC Income Fund by a third-party sub-administrator. After December 31, 2021, the Adviser continued to waive reimbursement of all Internal Administrative Services expenses, except for the cost of the services previously provided by the sub-administrator. For the three months ended September 30, 2024 and 2023, MSC Income Fund incurred Internal Administrative Services expenses before expense waivers of $2.4 million and $2.2 million, respectively. For the three months ended September 30, 2024 and 2023, the Adviser waived the reimbursements of Internal Administrative Services expenses of $2.2 million and $2.0 million, respectively. For the nine months ended September 30, 2024 and 2023, MSC Income Fund incurred Internal Administrative Services expenses before expense waivers of $7.2 million and $6.8 million, respectively. For the nine months ended September 30, 2024 and 2023, the Adviser waived the reimbursements of Internal Administrative Services expenses of $6.7 million and $6.3 million, respectively. Waived Internal Administrative Services expenses are permanently waived and are not subject to future reimbursement.
MSC INCOME FUND, INC.
Notes to the Consolidated Financial Statements (Continued)
(Unaudited)
2.Offering Costs
In accordance with MSC Income Fund’s previous investment advisory agreement with the previous investment adviser (“HMS Adviser”), MSC Income Fund reimbursed HMS Adviser for any offering costs that were paid on MSC Income Fund’s behalf, which consisted of, among other costs, actual legal, accounting, bona fide out-of-pocket itemized and detailed due diligence costs, printing, filing fees, transfer agent costs, postage, escrow fees, advertising and sales literature and other costs incurred in connection with the offering of MSC Income Fund’s common stock, including through MSC Income Fund’s DRIP. HMS Adviser was responsible for the payment of offering costs to the extent they exceeded 1.5% of the aggregate gross stock offering proceeds. Pursuant to the transaction whereby the Adviser became the investment adviser to MSC Income Fund, HMS Adviser agreed to permanently waive reimbursement of organizational and offering expenses except for $0.6 million which remained payable to HMS Adviser and would be reimbursed as part of future issuances of common stock by MSC Income Fund. For the three months ended June 30, 2023, MSC Income Fund reimbursed HMS Adviser $0.1 million in connection with stock issuances. MSC Income Fund’s reimbursement obligation to HMS Adviser for organizational and offering expenses was fully repaid as of June 30, 2023.
3.Indemnification
The Investment Advisory Agreement provides that the Adviser and its officers, directors, controlling persons and any other person or entity affiliated with it acting as MSC Income Fund’s agent are entitled to indemnification (including reasonable attorneys’ fees and amounts reasonably paid in settlement) for any liability or loss suffered by such indemnitee, and such indemnitee will be held harmless for any loss or liability suffered by MSC Income Fund, if (i) the indemnitee has determined, in good faith, that the course of conduct which caused the loss or liability was in MSC Income Fund’s best interests, (ii) the indemnitee was acting on behalf of or performing services for MSC Income Fund, (iii) the liability or loss suffered was not the result of negligence, willful malfeasance, bad faith or misconduct by the indemnitee or an affiliate thereof acting as MSC Income Fund’s agent and (iv) the indemnification or agreement to hold the indemnitee harmless is only recoverable out of MSC Income Fund’s net assets and not from MSC Income Fund’s stockholders.
4.Co-Investment
In the ordinary course of business, MSC Income Fund enters into transactions with other parties that may be considered related party transactions. MSC Income Fund has implemented certain policies and procedures, both written and unwritten, to ensure that it does not engage in any prohibited transactions with any persons affiliated with MSC Income Fund. If such affiliations are found to exist, MSC Income Fund seeks the Board of Directors and/or appropriate Board of Directors committee review and approval for such transactions and otherwise comply with, or seek, orders for exemptive relief from the SEC, as appropriate.
MSC Income Fund has received an exemptive order from the SEC permitting co-investments among MSC Income Fund, Main Street and other funds and clients advised by the Adviser in certain negotiated transactions where co-investing would otherwise be prohibited under the 1940 Act. MSC Income Fund has made co-investments, and in the future intends to continue to make co-investments with Main Street and other funds and clients advised by the Adviser, in accordance with the conditions of the order. The order requires, among other things, that the Adviser and Main Street consider whether each such investment opportunity is appropriate for MSC Income Fund, Main Street and the other funds and clients advised by the Adviser, as applicable, and if it is appropriate, to propose an allocation of the investment opportunity between such parties. Because the Adviser is wholly-owned by Main Street and is not managing MSC Income Fund’s investment activities as its sole activity, this may provide the Adviser an incentive to allocate opportunities to other participating funds and clients instead of MSC Income Fund. However, the Adviser has policies and procedures in place to manage this conflict, including oversight by the independent members of the Board of Directors. Additional information regarding the operation of the co-investment program is set forth in the order granting exemptive relief, which may be reviewed on the SEC’s website at www.sec.gov. In addition to the co-investment program described above, MSC Income Fund also co-invests in syndicated deals and other transactions where price is the only negotiated point by MSC Income Fund and its affiliates.
MSC INCOME FUND, INC.
Notes to the Consolidated Financial Statements (Continued)
(Unaudited)
5. Other Related Party Transactions
On August 1, 2024, the Company sold 125,314 shares (as adjusted to reflect the Reverse Stock Split on a retrospective basis) of its common stock to Main Street at $15.96 per share (as adjusted to reflect the Reverse Stock Split on a retrospective basis), the price at which the Company issued new shares in connection with reinvestments of the August 1, 2024 dividend pursuant to the DRIP, for total proceeds to the Company of $2.0 million. The issuance and sale were made pursuant to the exemption from registration under Section 4(a)(2) of the Securities Act and were unanimously approved by the Board of Directors, including each director who is not an “interested person,” as such term is defined in Section 2(a)(19) of the 1940 Act, of the Company or the Adviser.
NOTE K — SUBSEQUENT EVENTS
Our management has evaluated subsequent events through the date of issuance of the consolidated financial statements, and identified the following to report:
On November 1, 2024, the Company repurchased 256,365 shares (as adjusted to reflect the Reverse Stock Split on a retrospective basis) of its common stock validly tendered and not withdrawn on the terms set forth in the tender offer statement on Schedule TO and Offer to Purchase filed with the SEC on September 26, 2024. The shares were repurchased at a price of $15.48 per share (as adjusted to reflect the Reverse Stock Split on a retrospective basis), which was the Company’s NAV per share as of November 1, 2024, for an aggregate purchase price of $4.0 million (an amount equal to 90% of the proceeds the Company received from the issuance of shares under the Company’s DRIP from the November 1, 2024 dividend payment).
On November 8, 2024, the Company entered into an amendment to the Corporate Facility to, among other things: (i) extend the revolving period from September 2025 to November 2028, (ii) extend the final maturity date from March 2026 to May 2029 and (iii) reduce the interest rate, subject to MSC Income Fund’s election to (a) SOFR plus 2.05% or (b) the base rate plus 1.05%.
On November 13, 2024, the Board of Directors declared a quarterly dividend of $0.36 per share (as adjusted to reflect the Reverse Stock Split on a retrospective basis) payable on January 31, 2025 to stockholders of record as of December 31, 2024.
The Company has scheduled a special meeting of stockholders on December 2, 2024 to consider a series of proposals that the Company believes will position it to potentially effect a listing of the Company’s shares of common stock on a national securities exchange (such as the New York Stock Exchange) (a “Listing”) if and when market conditions make it desirable to do so and it is otherwise in the Company’s best interest. On November 13, 2024, the Board of Directors, including the independent directors, unanimously approved suspending the Company’s share repurchase program in anticipation of a Listing and the opportunity for enhanced liquidity a Listing is expected to provide the Company’s stockholders. The share repurchase program will ultimately terminate upon a Listing.
MSC INCOME FUND, INC.
Consolidated Schedule of Investments In and Advances to Affiliates
September 30, 2024
(dollars in thousands)
(unaudited)
| | | | | | | | | | | | | | | | | | | | | | | | | | | | | | | | | | | | | | | | | | | | | | | | | | | | | | | | | | | | | | | | | |
| Company | Total Rate | Base Rate | Spread | PIK Rate | Type of Investment (1)(10)(11) | | Geography | | Amount of
Realized
Gain/(Loss) | | Amount of
Unrealized
Gain/(Loss) | | Amount of
Interest,
Fees or
Dividends
Credited to
Income (2) | | December 31,
2023 Fair Value | | Gross
Additions (3) | | Gross
Reductions (4) | | September 30,
2024 Fair Value (13) |
| Control Investments | | | | | | | | | | | | | | | | | | | | | |
| Copper Trail Fund Investments | | | | | LP Interests (CTMH, LP) | | (9) | | $ | — | | | $ | — | | | $ | — | | | $ | 568 | | | $ | — | | | $ | 38 | | | $ | 530 | |
| GRT Rubber Technologies LLC | 11.35% | SF+ | 6.00% | | Secured Debt (12) | | (8) | | — | | | 4 | | | 123 | | | 1,182 | | | 368 | | | — | | | 1,550 | |
| 13.35% | SF+ | 8.00% | | Secured Debt | | (8) | | — | | | (37) | | | 2,080 | | | 19,944 | | | 37 | | | 37 | | | 19,944 | |
| | | | | Member Units | | (8) | | — | | | — | | | 93 | | | 21,890 | | | — | | | — | | | 21,890 | |
| Harris Preston Fund Investments | | | | | LP Interests (2717 MH, L.P.) | | (8) | | 57 | | | 2,769 | | | 278 | | | 6,050 | | | 2,826 | | | 57 | | | 8,819 | |
| Volusion, LLC | 10.00% | | | | Secured Debt | | (8) | | — | | | — | | | 69 | | | 900 | | | — | | | — | | | 900 | |
| | | | | Preferred Member Units | | (8) | | — | | | — | | | — | | | — | | | — | | | — | | | — | |
| | | | | Preferred Member Units | | (8) | | — | | | 1,895 | | | — | | | 3,110 | | | 1,895 | | | 1,805 | | | 3,200 | |
| | | | | Preferred Member Units | | (8) | | — | | | — | | | — | | | — | | | — | | | — | | | — | |
| | | | | Common Stock | | (8) | | — | | | — | | | — | | | — | | | — | | | — | | | — | |
Other
Amounts related to
investments transferred to
or from other
1940 Act classification
during the period | | | | | | | | | — | | | — | | | — | | | — | | | — | | | — | | | — | |
| Total Control Investments | | | | | | | | | $ | 57 | | | $ | 4,631 | | | $ | 2,643 | | | $ | 53,644 | | | $ | 5,126 | | | $ | 1,937 | | | $ | 56,833 | |
| Affiliate Investments | | | | | | | | | | | | | | | | | | | | | |
| Analytical Systems Keco Holdings, LLC | | | | | Secured Debt (12) | | (8) | | — | | | — | | | 4 | | | 54 | | | — | | | 54 | | | — | |
| 13.75% | | | | Secured Debt | | (8) | | — | | | — | | | 138 | | | 1,020 | | | 79 | | | 75 | | | 1,024 | |
| | | | | Preferred Member Units | | (8) | | — | | | — | | | — | | | — | | | — | | | — | | | — | |
| | | | | Preferred Member Units | | (8) | | — | | | 220 | | | — | | | 1,210 | | | 220 | | | — | | | 1,430 | |
| | | | | Warrants | | (8) | | — | | | — | | | — | | | — | | | — | | | — | | | — | |
| Barfly Ventures, LLC | | | | | Member Units | | (5) | | — | | | 407 | | | — | | | 1,380 | | | 407 | | | — | | | 1,787 | |
| Batjer TopCo, LLC | 10.00% | | | | Secured Debt (12) | | (8) | | — | | | (1) | | | 3 | | | — | | | 50 | | | 1 | | | 49 | |
| 10.00% | | | | Secured Debt (12) | | (8) | | — | | | — | | | 2 | | | 30 | | | — | | | — | | | 30 | |
| 10.00% | | | | Secured Debt | | (8) | | — | | | (15) | | | 93 | | | 1,175 | | | 4 | | | 15 | | | 1,164 | |
| | | | | Preferred Stock | | (8) | | — | | | (110) | | | 71 | | | 680 | | | — | | | 110 | | | 570 | |
| Brewer Crane Holdings, LLC | 15.35% | SF+ | 10.00% | | Secured Debt | | (9) | | — | | | — | | | 158 | | | 1,374 | | | 4 | | | 93 | | | 1,285 | |
| | | | | Preferred Member Units | | (9) | | — | | | (40) | | | 23 | | | 1,400 | | | — | | | 40 | | | 1,360 | |
| Centre Technologies Holdings, LLC | | SF+ | 10.00% | | Secured Debt (12) | | (8) | | — | | | — | | | 2 | | | — | | | — | | | — | | | — | |
| 15.35% | SF+ | 10.00% | | Secured Debt | | (8) | | — | | | 54 | | | 550 | | | — | | | 5,494 | | | 378 | | | 5,116 | |
| | | | | Secured Debt | | (8) | | — | | | (29) | | | 84 | | | 4,394 | | | — | | | 4,394 | | | — | |
| | | | | Preferred Member Units | | (8) | | — | | | 230 | | | 23 | | | 2,760 | | | 230 | | | — | | | 2,990 | |
| Chamberlin Holding LLC | | SF+ | 6.00% | | Secured Debt (12) | | (8) | | — | | | (17) | | | 18 | | | — | | | 17 | | | 17 | | | — | |
| 13.36% | SF+ | 8.00% | | Secured Debt | | (8) | | — | | | (1) | | | 401 | | | 3,905 | | | 1 | | | 1 | | | 3,905 | |
| | | | | Member Units | | (8) | | — | | | 300 | | | 969 | | | 7,330 | | | 300 | | | — | | | 7,630 | |
| | | | | Member Units | | (8) | | — | | | 90 | | | 17 | | | 715 | | | 90 | | | — | | | 805 | |
| Charps, LLC | | | | | Preferred Member Units | | (5) | | — | | | (20) | | | 121 | | | 3,920 | | | — | | | 20 | | | 3,900 | |
| Clad-Rex Steel, LLC | | | | | Secured Debt (12) | | (5) | | — | | | — | | | 1 | | | — | | | — | | | — | | | — | |
| 10.00% | | | | Secured Debt | | (5) | | — | | | 37 | | | 176 | | | 2,103 | | | 30 | | | 350 | | | 1,783 | |
| 10.00% | | | | Secured Debt | | (5) | | — | | | — | | | 19 | | | 251 | | | — | | | 7 | | | 244 | |
| | | | | Member Units | | (5) | | — | | | 910 | | | 146 | | | 1,300 | | | 910 | | | — | | | 2,210 | |
| | | | | Member Units | | (5) | | — | | | (45) | | | — | | | 282 | | | — | | | 45 | | | 237 | |
| Cody Pools, Inc. | | | | | Secured Debt (12) | | (8) | | — | | | 1 | | | 6 | | | — | | | 236 | | | 236 | | | — | |
MSC INCOME FUND, INC.
Consolidated Schedule of Investments In and Advances to Affiliates (Continued)
September 30, 2024
(dollars in thousands)
(unaudited)
| | | | | | | | | | | | | | | | | | | | | | | | | | | | | | | | | | | | | | | | | | | | | | | | | | | | | | | | | | | | | | | | | |
| Company | Total Rate | Base Rate | Spread | PIK Rate | Type of Investment (1)(10)(11) | | Geography | | Amount of
Realized
Gain/(Loss) | | Amount of
Unrealized
Gain/(Loss) | | Amount of
Interest,
Fees or
Dividends
Credited to
Income (2) | | December 31,
2023 Fair Value | | Gross
Additions (3) | | Gross
Reductions (4) | | September 30,
2024 Fair Value (13) |
| 12.50% | | | | Secured Debt | | (8) | | — | | | (6) | | | 660 | | | 7,111 | | | 5 | | | 404 | | | 6,712 | |
| | | | | Preferred Member Units | | (8) | | — | | | (630) | | | 392 | | | 18,120 | | | — | | | 630 | | | 17,490 | |
| Colonial Electric Company LLC | | | | | Secured Debt (12) | | (6) | | — | | | — | | | 2 | | | — | | | — | | | — | | | — | |
| 12.00% | | | | Secured Debt | | (6) | | — | | | 73 | | | 469 | | | 5,407 | | | 105 | | | 1,456 | | | 4,056 | |
| | | | | Preferred Member Units | | (6) | | — | | | (360) | | | 360 | | | 600 | | | — | | | 600 | | | — | |
| | | | | Preferred Member Units | | (6) | | — | | | 1,360 | | | 560 | | | 1,920 | | | 1,360 | | | — | | | 3,280 | |
| Compass Systems & Sales, LLC | | | | | Secured Debt | | (5) | | — | | | — | | | 18 | | | — | | | 583 | | | 600 | | | (17) | |
| 13.50% | | | | Secured Debt | | (5) | | — | | | — | | | 461 | | | 4,175 | | | 19 | | | — | | | 4,194 | |
| | | | | Preferred Equity | | (5) | | — | | | 117 | | | 45 | | | 1,863 | | | 117 | | | — | | | 1,980 | |
| Datacom, LLC | 7.50% | | | | Secured Debt | | (8) | | — | | | — | | | 3 | | | 49 | | | 50 | | | 60 | | | 39 | |
| 10.00% | | | | Secured Debt | | (8) | | — | | | 7 | | | 86 | | | 844 | | | 24 | | | 23 | | | 845 | |
| | | | | Preferred Member Units | | (8) | | — | | | 30 | | | — | | | 10 | | | 30 | | | — | | | 40 | |
| Digital Products Holdings LLC | 15.25% | SF+ | 10.00% | | Secured Debt | | (5) | | — | | | — | | | 410 | | | 3,673 | | | 12 | | | 482 | | | 3,203 | |
| | | | | Preferred Member Units | | (5) | | — | | | — | | | 38 | | | 2,459 | | | — | | | — | | | 2,459 | |
| Direct Marketing Solutions, Inc. | | | | | Secured Debt | | (9) | | — | | | (1) | | | 10 | | | 217 | | | 301 | | | 518 | | | — | |
| 14.00% | | | | Secured Debt | | (9) | | — | | | (11) | | | 529 | | | 5,002 | | | 11 | | | 262 | | | 4,751 | |
| | | | | Preferred Stock | | (9) | | — | | | (360) | | | — | | | 5,180 | | | — | | | 360 | | | 4,820 | |
| Flame King Holdings, LLC | | | | | Preferred Equity | | (9) | | — | | | 1,970 | | | 808 | | | 6,970 | | | 1,970 | | | — | | | 8,940 | |
| Freeport Financial Funds | | | | | LP Interests (Freeport First Lien Loan Fund III LP) | | (5) | | — | | | 193 | | | 38 | | | 3,705 | | | 193 | | | 2,005 | | | 1,893 | |
| Gamber-Johnson Holdings, LLC | | SF+ | 7.00% | | Secured Debt (12) | | (5) | | — | | | — | | | 1 | | | — | | | — | | | — | | | — | |
| 10.00% | SF+ | 7.00% | | Secured Debt | | (5) | | — | | | (50) | | | 1,036 | | | 13,520 | | | 50 | | | 1,450 | | | 12,120 | |
| | | | | Member Units | | (5) | | — | | | 2,660 | | | 1,352 | | | 24,180 | | | 2,660 | | | — | | | 26,840 | |
| GFG Group, LLC | 8.00% | | | | Secured Debt | | (5) | | — | | | (14) | | | 153 | | | 2,336 | | | 14 | | | 304 | | | 2,046 | |
| | | | | Preferred Member Units | | (5) | | — | | | (230) | | | 323 | | | 2,870 | | | — | | | 230 | | | 2,640 | |
| Gulf Publishing Holdings, LLC | | SF+ | 9.50% | | Secured Debt (12) | | (8) | | — | | | — | | | — | | | — | | | — | | | — | | | — | |
| 12.50% | | | 12.50% | Secured Debt | | (8) | | — | | | (220) | | | 19 | | | 571 | | | — | | | 220 | | | 351 | |
| | | | | Preferred Equity | | (8) | | — | | | (620) | | | — | | | 620 | | | — | | | 620 | | | — | |
| | | | | Member Units | | (8) | | — | | | — | | | — | | | — | | | — | | | — | | | — | |
| HPEP 3, L.P. | | | | | LP Interests (HPEP 3, L.P.) (12) | | (8) | | — | | | 247 | | | — | | | 4,225 | | | 247 | | | — | | | 4,472 | |
| IG Investor, LLC | 13.00% | | | | Secured Debt (12) | | (6) | | — | | | — | | | 17 | | | (27) | | | 405 | | | — | | | 378 | |
| 13.00% | | | | Secured Debt | | (6) | | — | | | — | | | 948 | | | 9,069 | | | 48 | | | 330 | | | 8,787 | |
| | | | | Common Equity | | (6) | | — | | | 120 | | | — | | | 3,600 | | | 120 | | | — | | | 3,720 | |
| Independent Pet Partners Intermediate Holdings, LLC | | | | | Common Equity | | (6) | | — | | | 970 | | | — | | | 6,320 | | | 970 | | | — | | | 7,290 | |
| Integral Energy Services | 13.09% | SF+ | 7.50% | | Secured Debt | | (8) | | — | | | 273 | | | 1,633 | | | 16,232 | | | 342 | | | 1,835 | | | 14,739 | |
| 10.00% | | | 10.00% | Preferred Equity | | (8) | | — | | | 153 | | | 24 | | | 350 | | | 177 | | | — | | | 527 | |
| | | | | Common Stock | | (8) | | — | | | 450 | | | 38 | | | 190 | | | 450 | | | — | | | 640 | |
| Kickhaefer Manufacturing Company, LLC | 12.00% | | | | Secured Debt | | (5) | | — | | | — | | | 429 | | | 4,933 | | | 6 | | | 800 | | | 4,139 | |
| 9.00% | | | | Secured Debt | | (5) | | — | | | — | | | 66 | | | 951 | | | 41 | | | 8 | | | 984 | |
| | | | | Preferred Equity | | (5) | | — | | | 640 | | | — | | | 2,420 | | | 640 | | | — | | | 3,060 | |
| | | | | Member Units | | (5) | | — | | | (60) | | | 24 | | | 683 | | | — | | | 60 | | | 623 | |
| MH Corbin Holding LLC | 14.00% | | | | Secured Debt | | (5) | | — | | | (871) | | | 139 | | | 1,256 | | | — | | | 911 | | | 345 | |
| | | | | Preferred Member Units | | (5) | | — | | | (80) | | | — | | | 80 | | | — | | | 80 | | | — | |
MSC INCOME FUND, INC.
Consolidated Schedule of Investments In and Advances to Affiliates (Continued)
September 30, 2024
(dollars in thousands)
(unaudited)
| | | | | | | | | | | | | | | | | | | | | | | | | | | | | | | | | | | | | | | | | | | | | | | | | | | | | | | | | | | | | | | | | |
| Company | Total Rate | Base Rate | Spread | PIK Rate | Type of Investment (1)(10)(11) | | Geography | | Amount of
Realized
Gain/(Loss) | | Amount of
Unrealized
Gain/(Loss) | | Amount of
Interest,
Fees or
Dividends
Credited to
Income (2) | | December 31,
2023 Fair Value | | Gross
Additions (3) | | Gross
Reductions (4) | | September 30,
2024 Fair Value (13) |
| | | | | Preferred Member Units | | (5) | | — | | | — | | | — | | | — | | | — | | | — | | | — | |
| Mystic Logistics Holdings, LLC | | | | | Secured Debt (12) | | (6) | | — | | | — | | | 1 | | | — | | | — | | | — | | | — | |
| 10.00% | | | | Secured Debt | | (6) | | — | | | 4 | | | 110 | | | 1,436 | | | — | | | — | | | 1,436 | |
| | | | | Common Stock | | (6) | | — | | | (68) | | | 735 | | | 6,598 | | | — | | | 68 | | | 6,530 | |
| Nello Industries Investco, LLC | 11.75% | SF+ | 6.50% | | Secured Debt | | (5) | | — | | | — | | | 126 | | | — | | | 4,188 | | | 600 | | | 3,588 | |
| 13.50% | | | | Secured Debt | | (5) | | — | | | — | | | 293 | | | — | | | 6,609 | | | — | | | 6,609 | |
| | | | | Common Equity | | (5) | | — | | | — | | | 55 | | | — | | | 3,030 | | | — | | | 3,030 | |
| NexRev LLC | 10.00% | | | | Secured Debt (12) | | (8) | | — | | | — | | | 25 | | | — | | | 790 | | | 300 | | | 490 | |
| 10.00% | | | | Secured Debt | | (8) | | — | | | 6 | | | 198 | | | 2,435 | | | 18 | | | — | | | 2,453 | |
| | | | | Preferred Member Units | | (8) | | — | | | 870 | | | 161 | | | 1,590 | | | 870 | | | — | | | 2,460 | |
| NuStep, LLC | 11.85% | SF+ | 6.50% | | Secured Debt | | (5) | | — | | | — | | | 83 | | | 899 | | | 1 | | | — | | | 900 | |
| 12.00% | | | | Secured Debt | | (5) | | — | | | — | | | 424 | | | 4,606 | | | 3 | | | — | | | 4,609 | |
| | | | | Preferred Member Units | | (5) | | — | | | 92 | | | — | | | 2,310 | | | 350 | | | — | | | 2,660 | |
| | | | | Preferred Member Units | | (5) | | — | | | 20 | | | — | | | 1,290 | | | 150 | | | — | | | 1,440 | |
| Oneliance, LLC | | SF+ | 10.00% | | Secured Debt | | (7) | | — | | | 7 | | | 142 | | | 1,339 | | | 21 | | | 1,360 | | | — | |
| | | | | Preferred Stock | | (7) | | — | | | 268 | | | — | | | 282 | | | 268 | | | — | | | 550 | |
| Orttech Holdings, LLC | | SF+ | 11.00% | | Secured Debt (12) | | (5) | | — | | | (1) | | | 1 | | | — | | | 1 | | | 1 | | | — | |
| 16.35% | SF+ | 11.00% | | Secured Debt | | (5) | | — | | | (17) | | | 705 | | | 5,510 | | | 17 | | | 37 | | | 5,490 | |
| | | | | Preferred Stock | | (5) | | — | | | (590) | | | 97 | | | 4,260 | | | — | | | 590 | | | 3,670 | |
| Pinnacle TopCo, LLC | | | | | Secured Debt (12) | | (8) | | — | | | 8 | | | 4 | | | 105 | | | 10 | | | 115 | | | — | |
| 13.00% | | | | Secured Debt | | (8) | | — | | | 152 | | | 783 | | | 7,472 | | | 188 | | | 400 | | | 7,260 | |
| | | | | Preferred Equity | | (8) | | — | | | 1,205 | | | 430 | | | 3,135 | | | 1,205 | | | — | | | 4,340 | |
| RA Outdoors LLC | 11.59% | SF+ | 6.75% | 11.59% | Secured Debt | | (8) | | — | | | (70) | | | 27 | | | 745 | | | 481 | | | 36 | | | 1,190 | |
| 11.59% | SF+ | 6.75% | 11.59% | Secured Debt | | (8) | | — | | | (737) | | | 284 | | | 12,089 | | | 448 | | | 96 | | | 12,441 | |
| | | | | Common Equity | | (8) | | — | | | — | | | — | | | — | | | — | | | — | | | — | |
| Robbins Bros. Jewelry, Inc. | | | | 10.00% | Secured Debt | | (9) | | — | | | — | | | 1 | | | (6) | | | 1 | | | — | | | (5) | |
| 12.50% | | | 10.00% | Secured Debt | | (9) | | — | | | (1,662) | | | 123 | | | 3,421 | | | 5 | | | 1,713 | | | 1,713 | |
| | | | | Preferred Equity | | (9) | | — | | | — | | | — | | | — | | | — | | | — | | | — | |
| SI East, LLC | 11.75% | | | | Secured Debt (12) | | (7) | | — | | | — | | | 64 | | | 375 | | | 750 | | | 375 | | | 750 | |
| | | | | Secured Debt | | (7) | | — | | | (161) | | | 947 | | | 18,179 | | | — | | | 18,179 | | | — | |
| 12.63% | | | | Secured Debt | | (7) | | — | | | 22 | | | 1,213 | | | — | | | 22,554 | | | — | | | 22,554 | |
| | | | | Preferred Member Units | | (7) | | — | | | (1,000) | | | 665 | | | 6,390 | | | — | | | 1,000 | | | 5,390 | |
| Student Resource Center, LLC | 8.50% | | | 8.50% | Secured Debt | | (6) | | — | | | (1,717) | | | — | | | 3,543 | | | — | | | 1,717 | | | 1,826 | |
| | | | | Preferred Equity | | (6) | | — | | | — | | | — | | | — | | | — | | | — | | | — | |
| 8.50% | | | 8.50% | Secured Debt | | (6) | | — | | | — | | | 1 | | | — | | | 223 | | | — | | | 223 | |
| Tedder Industries, LLC | 12.00% | | | 12.00% | Secured Debt | | (9) | | — | | | — | | | 14 | | | 432 | | | — | | | — | | | 432 | |
| 12.00% | | | 12.00% | Secured Debt | | (9) | | — | | | (2,401) | | | 115 | | | 3,565 | | | — | | | 2,401 | | | 1,164 | |
| | | | | Preferred Member Units | | (9) | | — | | | — | | | — | | | — | | | — | | | — | | | — | |
| | | | | Preferred Member Units | | (9) | | — | | | — | | | — | | | — | | | — | | | — | | | — | |
| | | | | Preferred Member Units | | (9) | | — | | | — | | | — | | | — | | | — | | | — | | | — | |
| Trantech Radiator Topco, LLC | | | | | Secured Debt (12) | | (7) | | — | | | — | | | 1 | | | — | | | — | | | — | | | — | |
| 13.50% | | | | Secured Debt | | (7) | | — | | | 15 | | | 204 | | | 1,980 | | | — | | | — | | | 1,980 | |
| | | | | Common Stock | | (7) | | — | | | (800) | | | 22 | | | 3,180 | | | — | | | 800 | | | 2,380 | |
MSC INCOME FUND, INC.
Consolidated Schedule of Investments In and Advances to Affiliates (Continued)
September 30, 2024
(dollars in thousands)
(unaudited)
| | | | | | | | | | | | | | | | | | | | | | | | | | | | | | | | | | | | | | | | | | | | | | | | | | | | | | | | | | | | | | | | | |
| Company | Total Rate | Base Rate | Spread | PIK Rate | Type of Investment (1)(10)(11) | | Geography | | Amount of
Realized
Gain/(Loss) | | Amount of
Unrealized
Gain/(Loss) | | Amount of
Interest,
Fees or
Dividends
Credited to
Income (2) | | December 31,
2023 Fair Value | | Gross
Additions (3) | | Gross
Reductions (4) | | September 30,
2024 Fair Value (13) |
| VVS Holdco LLC | | SF+ | 6.00% | | Secured Debt (12) | | (5) | | — | | | — | | | 3 | | | — | | | — | | | — | | | — | |
| 11.50% | | | | Secured Debt | | (5) | | — | | | — | | | 638 | | | 6,926 | | | 36 | | | 290 | | | 6,672 | |
| | | | | Preferred Equity | | (5) | | — | | | — | | | 80 | | | 3,060 | | | — | | | — | | | 3,060 | |
Other
Amounts related to
investments transferred to
or from other
1940 Act classification
during the period | | | | | | | | | — | | | — | | | — | | | (12,834) | | | — | | | — | | | — | |
| Total Affiliate investments | | | | | | | | | $ | — | | | $ | 1,166 | | | $ | 22,891 | | | $ | 291,279 | | | $ | 61,239 | | | $ | 50,162 | | | $ | 315,190 | |
_____________________________
(1)The principal amount, the ownership detail for equity investments and if the investment is income producing is included in the Consolidated Schedule of Investments included in Item 1. Consolidated Financial Statements.
(2)Represents the total amount of interest, fees and dividends credited to income for the portion of the period for which an investment was included in Control or Affiliate categories, respectively. For investments transferred between Control and Affiliate categories during the period, any income or investment balances related to the time period it was in the category other than the one shown at period end is included in “Amounts related to investments transferred from other 1940 Act classifications during the period.”
(3)Gross additions include increases in the cost basis of investments resulting from new portfolio investments, follow-on investments and accrued PIK interest, and the exchange of one or more existing securities for one or more new securities. Gross additions also include net increases in unrealized appreciation or net decreases in net unrealized depreciation as well as the movement of an existing portfolio company into this category and out of a different category.
(4)Gross reductions include decreases in the cost basis of investments resulting from principal repayments or sales and the exchange of one or more existing securities for one or more new securities. Gross reductions also include net increases in net unrealized depreciation or net decreases in unrealized appreciation as well as the movement of an existing portfolio company out of this category and into a different category.
(5)Portfolio company located in the Midwest region as determined by location of the corporate headquarters. The fair value as of September 30, 2024 for affiliate investments located in this region was $118,398. This represented 19.1% of net assets as of September 30, 2024.
(6)Portfolio company located in the Northeast region as determined by location of the corporate headquarters. The fair value as of September 30, 2024 for affiliate investments located in this region was $37,526. This represented 6.1% of net assets as of September 30, 2024.
(7)Portfolio company located in the Southeast region as determined by location of the corporate headquarters. The fair value as of September 30, 2024 for affiliate investments located in this region was $33,604. This represented 5.4% of net assets as of September 30, 2024.
(8)Portfolio company located in the Southwest region as determined by location of the corporate headquarters. The fair value as of September 30, 2024 for control investments located in this region was $56,303. This represented 9.1% of net assets as of September 30, 2024. The fair value as of September 30, 2024 for affiliate investments located in this region was $101,202. This represented 16.4% of net assets as of September 30, 2024.
MSC INCOME FUND, INC.
Consolidated Schedule of Investments In and Advances to Affiliates (Continued)
September 30, 2024
(dollars in thousands)
(unaudited)
(9)Portfolio company located in the West region as determined by location of the corporate headquarters. The fair value as of September 30, 2024 for control investments located in this region was $530. This represented 0.1% of net assets as of September 30, 2024. The fair value as of September 30, 2024 for affiliate investments located in this region was $24,460. This represented 4.0% of net assets as of September 30, 2024.
(10)All of the Company’s portfolio investments are generally subject to restrictions on resale as “restricted securities,” unless otherwise noted.
(11)This schedule should be read in conjunction with the Consolidated Schedule of Investments and Notes to the Consolidated Financial Statements included in Item 1. Consolidated Financial Statements. Supplemental information can be located within the Consolidated Schedule of Investments including end of period interest rate, preferred dividend rate, maturity date, investments not paid currently in cash and investments whose value was determined using significant unobservable inputs.
(12)Investment has an unfunded commitment as of September 30, 2024 (see Note I). The fair value of the investment includes the impact of the fair value of any unfunded commitments.
(13)Negative fair value is the result of the capitalized discount being greater than the principal amount outstanding on the loan.
MSC INCOME FUND, INC.
Consolidated Schedule of Investments In and Advances to Affiliates
September 30, 2023
(dollars in thousands)
(unaudited)
| | | | | | | | | | | | | | | | | | | | | | | | | | | | | | | | | | | | | | | | | | | | | | | | | | | | | | | | | | | | | | | | | |
| Company | Total Rate | Base Rate | Spread | PIK Rate | Type of Investment (1)(10)(11) | | Geography | | Amount of
Realized
Gain/(Loss) | | Amount of
Unrealized
Gain/(Loss) | | Amount of
Interest,
Fees or
Dividends
Credited to
Income (2) | | December 31,
2022 Fair Value | | Gross
Additions (3) | | Gross
Reductions (4) | | September 30,
2023 Fair Value (13) |
| Control Investments | | | | | | | | | | | | | | | | | | | | | |
| Copper Trail Fund Investments | | | | | LP Interests (CTMH, LP) | | (9) | | $ | — | | | $ | — | | | $ | 38 | | | $ | 588 | | | $ | — | | | $ | — | | | $ | 588 | |
| GRT Rubber Technologies LLC | 11.48% | SF+ | 6.00% | | Secured Debt (12) | | (8) | | — | | | — | | | 59 | | | 330 | | | 508 | | | — | | | 838 | |
| 13.48% | SF+ | 8.00% | | Secured Debt | | (8) | | — | | | (37) | | | 1,998 | | | 19,943 | | | 38 | | | 37 | | | 19,944 | |
| | | | | Member Units | | (8) | | — | | | — | | | 62 | | | 21,890 | | | — | | | — | | | 21,890 | |
| Harris Preston Fund Investments | | | | | LP Interests (2717 MH, L.P.) | | (8) | | 2,223 | | | (1,106) | | | 141 | | | 7,552 | | | 2,796 | | | 4,452 | | | 5,896 | |
| Volusion, LLC | 10.00% | | | | Secured Debt | | (8) | | — | | | — | | | 46 | | | — | | | 900 | | | — | | | 900 | |
| | | | | Secured Debt | | (8) | | (1,366) | | | 780 | | | 71 | | | 6,392 | | | — | | | 6,392 | | | — | |
| | | | | Unsecured Convertible Debt | | (8) | | (175) | | | 175 | | | — | | | — | | | 175 | | | 175 | | | — | |
| | | | | Preferred Member Units | | (8) | | — | | | — | | | — | | | — | | | — | | | — | | | — | |
| | | | | Preferred Member Units | | (8) | | — | | | (596) | | | — | | | — | | | 4,906 | | | 896 | | | 4,010 | |
| | | | | Preferred Member Units | | (8) | | — | | | — | | | — | | | — | | | — | | | — | | | — | |
| | | | | Common Stock | | (8) | | — | | | (1,104) | | | — | | | — | | | 1,104 | | | 1,104 | | | — | |
| | | | | Warrants | | (8) | | — | | | 1,104 | | | — | | | — | | | — | | | — | | | — | |
Other
Amounts related to
investments transferred to
or from other
1940 Act classification
during the period | | | | | | | | | 1,541 | | | (649) | | | (94) | | | (6,392) | | | 6,392 | | | — | | | — | |
| Total Control Investments | | | | | | | | | $ | 2,223 | | | $ | (1,433) | | | $ | 2,321 | | | $ | 50,303 | | | $ | 16,819 | | | $ | 13,056 | | | $ | 54,066 | |
| Affiliate Investments | | | | | | | | | | | | | | | | | | | | | |
| AFG Capital Group, LLC | | | | | Preferred Member Units | | (8) | | $ | 1,800 | | | $ | (2,050) | | | $ | — | | | $ | 2,350 | | | $ | 1,800 | | | $ | 4,150 | | | $ | — | |
| Analytical Systems Keco Holdings, LLC | 15.38% | SF+ | 10.00% | | Secured Debt (12) | | (8) | | — | | | — | | | 2 | | | (2) | | | 41 | | | — | | | 39 | |
| 15.38% | SF+ | 10.00% | | Secured Debt | | (8) | | — | | | — | | | 143 | | | 1,135 | | | 16 | | | 118 | | | 1,033 | |
| 14.13% | | | | Preferred Member Units | | (8) | | — | | | — | | | — | | | — | | | — | | | — | | | — | |
| | | | | Preferred Member Units | | (8) | | — | | | 260 | | | — | | | 880 | | | 260 | | | — | | | 1,140 | |
| | | | | Warrants | | (8) | | — | | | — | | | — | | | — | | | — | | | — | | | — | |
| ATX Networks Corp. | | L+ | 7.50% | | Secured Debt | | (6) | | — | | | (102) | | | 856 | | | 6,368 | | | 545 | | | 6,913 | | | — | |
| | | | | Unsecured Debt | | (6) | | — | | | (276) | | | 1,135 | | | 2,614 | | | 1,135 | | | 3,749 | | | — | |
| | | | | Common Stock | | (6) | | 3,178 | | | (3,290) | | | — | | | 3,290 | | | 3,178 | | | 6,468 | | | — | |
| Barfly Ventures, LLC | | | | | Member Units | | (5) | | — | | | (94) | | | — | | | 1,107 | | | — | | | 94 | | | 1,013 | |
| Batjer TopCo, LLC | | | | | Secured Debt (12) | | (8) | | — | | | 1 | | | — | | | (1) | | | 1 | | | — | | | — | |
| 10.00% | | | | Secured Debt (12) | | (8) | | — | | | — | | | 1 | | | — | | | 70 | | | — | | | 70 | |
| 10.00% | | | | Secured Debt | | (8) | | — | | | 16 | | | 98 | | | 1,205 | | | 20 | | | 50 | | | 1,175 | |
| | | | | Preferred Stock | | (8) | | — | | | 225 | | | 70 | | | 455 | | | 225 | | | — | | | 680 | |
| Brewer Crane Holdings, LLC | 15.44% | L+ | 10.00% | | Secured Debt | | (9) | | — | | | (29) | | | 169 | | | 1,491 | | | 8 | | | 123 | | | 1,376 | |
| | | | | Preferred Member Units | | (9) | | — | | | (370) | | | 23 | | | 1,770 | | | — | | | 370 | | | 1,400 | |
| Centre Technologies Holdings, LLC | | SF+ | 9.00% | | Secured Debt (12) | | (8) | | — | | | — | | | 2 | | | — | | | — | | | — | | | — | |
| 14.48% | SF+ | 9.00% | | Secured Debt | | (8) | | — | | | 33 | | | 406 | | | 3,731 | | | 663 | | | — | | | 4,394 | |
| | | | | Preferred Member Units | | (8) | | — | | | 430 | | | 23 | | | 2,170 | | | 430 | | | — | | | 2,600 | |
| Chamberlin Holding LLC | | SF+ | 6.00% | | Secured Debt (12) | | (8) | | — | | | 35 | | | 5 | | | — | | | — | | | — | | | — | |
| 13.49% | SF+ | 8.00% | | Secured Debt | | (8) | | — | | | (4) | | | 416 | | | 4,236 | | | 4 | | | 138 | | | 4,102 | |
| | | | | Member Units | | (8) | | — | | | 750 | | | 698 | | | 5,728 | | | 752 | | | — | | | 6,480 | |
| | | | | Member Units | | (8) | | — | | | 65 | | | 17 | | | 678 | | | 65 | | | — | | | 743 | |
| Charps, LLC | | | | | Preferred Member Units | | (5) | | — | | | 170 | | | 167 | | | 3,330 | | | 170 | | | — | | | 3,500 | |
MSC INCOME FUND, INC.
Consolidated Schedule of Investments In and Advances to Affiliates (Continued)
September 30, 2023
(dollars in thousands)
(unaudited)
| | | | | | | | | | | | | | | | | | | | | | | | | | | | | | | | | | | | | | | | | | | | | | | | | | | | | | | | | | | | | | | | | |
| Company | Total Rate | Base Rate | Spread | PIK Rate | Type of Investment (1)(10)(11) | | Geography | | Amount of
Realized
Gain/(Loss) | | Amount of
Unrealized
Gain/(Loss) | | Amount of
Interest,
Fees or
Dividends
Credited to
Income (2) | | December 31,
2022 Fair Value | | Gross
Additions (3) | | Gross
Reductions (4) | | September 30,
2023 Fair Value (13) |
| Clad-Rex Steel, LLC | | | | | Secured Debt (12) | | (5) | | — | | | — | | | — | | | — | | | — | | | — | | | — | |
| 11.50% | | | | Secured Debt | | (5) | | — | | | (37) | | | 220 | | | 2,620 | | | — | | | 457 | | | 2,163 | |
| 10.00% | | | | Secured Debt | | (5) | | — | | | — | | | 20 | | | 260 | | | — | | | 7 | | | 253 | |
| | | | | Member Units | | (5) | | — | | | (660) | | | 69 | | | 2,060 | | | — | | | 660 | | | 1,400 | |
| | | | | Member Units | | (5) | | — | | | 55 | | | — | | | 152 | | | 130 | | | — | | | 282 | |
| Cody Pools, Inc. | | | | | Secured Debt (12) | | (8) | | — | | | 2 | | | — | | | — | | | — | | | — | | | — | |
| 12.50% | | | | Secured Debt | | (8) | | — | | | 25 | | | 330 | | | — | | | 7,872 | | | 495 | | | 7,377 | |
| | L+ | 10.50% | | Secured Debt | | (8) | | — | | | (11) | | | 26 | | | 273 | | | 14 | | | 287 | | | — | |
| | L+ | 10.50% | | Secured Debt | | (8) | | — | | | (96) | | | 500 | | | 6,882 | | | — | | | 6,882 | | | — | |
| | | | | Preferred Member Units | | (8) | | — | | | 2,740 | | | 653 | | | 14,550 | | | 2,740 | | | — | | | 17,290 | |
| Colonial Electric Company LLC | | | | | Secured Debt | | (6) | | — | | | — | | | 12 | | | — | | | 400 | | | 400 | | | — | |
| 12.00% | | | | Secured Debt | | (6) | | — | | | (77) | | | 542 | | | 5,729 | | | 26 | | | 313 | | | 5,442 | |
| | | | | Preferred Member Units | | (6) | | — | | | 360 | | | — | | | — | | | 600 | | | — | | | 600 | |
| | | | | Preferred Member Units | | (6) | | — | | | (370) | | | (295) | | | 2,290 | | | — | | | 370 | | | 1,920 | |
| Datacom, LLC | 7.50% | | | | Secured Debt | | (8) | | — | | | — | | | 3 | | | 25 | | | 89 | | | 55 | | | 59 | |
| 10.00% | | | | Secured Debt | | (8) | | — | | | (14) | | | 89 | | | 865 | | | 17 | | | 36 | | | 846 | |
| | | | | Preferred Member Units | | (8) | | — | | | (270) | | | — | | | 300 | | | — | | | 270 | | | 30 | |
| Digital Products Holdings LLC | 15.38% | SF+ | 10.00% | | Secured Debt | | (5) | | — | | | (17) | | | 436 | | | 3,878 | | | — | | | 209 | | | 3,669 | |
| | | | | Preferred Member Units | | (5) | | — | | | — | | | 38 | | | 2,459 | | | — | | | — | | | 2,459 | |
| Direct Marketing Solutions, Inc. | 14.00% | | | | Secured Debt | | (9) | | — | | | (1) | | | 4 | | | — | | | 226 | | | 1 | | | 225 | |
| 14.00% | | | | Secured Debt | | (9) | | — | | | (15) | | | 550 | | | 5,352 | | | 15 | | | 282 | | | 5,085 | |
| | | | | Preferred Stock | | (9) | | — | | | (220) | | | 43 | | | 5,558 | | | — | | | 218 | | | 5,340 | |
| Flame King Holdings, LLC | | L+ | 6.50% | | Secured Debt | | (9) | | — | | | (15) | | | 121 | | | 1,900 | | | 15 | | | 1,915 | | | — | |
| | L+ | 9.00% | | Secured Debt | | (9) | | — | | | (123) | | | 478 | | | 5,300 | | | 123 | | | 5,423 | | | — | |
| | | | | Preferred Equity | | (9) | | — | | | 2,570 | | | 619 | | | 4,400 | | | 2,570 | | | — | | | 6,970 | |
| Freeport Financial Funds | | | | | LP Interests (Freeport First Lien Loan Fund III LP) (12) | | (5) | | — | | | — | | | 446 | | | 5,848 | | | — | | | 975 | | | 4,873 | |
| Gamber-Johnson Holdings, LLC | | SF+ | 7.50% | | Secured Debt (12) | | (5) | | — | | | — | | | 1 | | | — | | | — | | | — | | | — | |
| 10.50% | SF+ | 7.50% | | Secured Debt | | (5) | | — | | | (68) | | | 1,338 | | | 16,020 | | | 68 | | | 1,968 | | | 14,120 | |
| | | | | Member Units | | (5) | | — | | | 7,680 | | | 1,240 | | | 12,720 | | | 7,680 | | | — | | | 20,400 | |
| GFG Group, LLC | 8.00% | | | | Secured Debt | | (5) | | — | | | (16) | | | 201 | | | 2,836 | | | 16 | | | 216 | | | 2,636 | |
| | | | | Preferred Member Units | | (5) | | — | | | 810 | | | 82 | | | 1,790 | | | 810 | | | — | | | 2,600 | |
| Gulf Publishing Holdings, LLC | | SF+ | 9.50% | | Secured Debt (12) | | (8) | | — | | | — | | | — | | | — | | | — | | | — | | | — | |
| 12.50% | | | | Secured Debt | | (8) | | — | | | — | | | 57 | | | 571 | | | — | | | — | | | 571 | |
| | | | | Preferred Equity | | (8) | | — | | | (250) | | | — | | | 950 | | | — | | | 250 | | | 700 | |
| | | | | Member Units | | (8) | | — | | | — | | | — | | | — | | | — | | | — | | | — | |
| HPEP 3, L.P. | | | | | LP Interests (HPEP 3, L.P.) (12) | | (8) | | — | | | 283 | | | — | | | 4,331 | | | 283 | | | 508 | | | 4,106 | |
| IG Investor, LLC | | | | | Secured Debt (12) | | (6) | | — | | | — | | | 3 | | | — | | | 172 | | | 200 | | | (28) | |
| 13.00% | | | | Secured Debt | | (6) | | — | | | — | | | 366 | | | — | | | 9,162 | | | — | | | 9,162 | |
| | | | | Common Equity | | (6) | | — | | | — | | | — | | | — | | | 3,774 | | | 174 | | | 3,600 | |
| Independent Pet Partners Intermediate Holdings, LLC | | | | | Common Equity | | (6) | | — | | | (280) | | | — | | | — | | | 6,540 | | | 280 | | | 6,260 | |
| Integral Energy Services | 13.01% | SF+ | 7.50% | | Secured Debt | | (8) | | — | | | (876) | | | 1,842 | | | 18,425 | | | 58 | | | 876 | | | 17,607 | |
| | | | | Common Stock | | (8) | | — | | | (1,160) | | | 38 | | | 1,490 | | | — | | | 1,160 | | | 330 | |
MSC INCOME FUND, INC.
Consolidated Schedule of Investments In and Advances to Affiliates (Continued)
September 30, 2023
(dollars in thousands)
(unaudited)
| | | | | | | | | | | | | | | | | | | | | | | | | | | | | | | | | | | | | | | | | | | | | | | | | | | | | | | | | | | | | | | | | |
| Company | Total Rate | Base Rate | Spread | PIK Rate | Type of Investment (1)(10)(11) | | Geography | | Amount of
Realized
Gain/(Loss) | | Amount of
Unrealized
Gain/(Loss) | | Amount of
Interest,
Fees or
Dividends
Credited to
Income (2) | | December 31,
2022 Fair Value | | Gross
Additions (3) | | Gross
Reductions (4) | | September 30,
2023 Fair Value (13) |
| Kickhaefer Manufacturing Company, LLC | 12.00% | | | | Secured Debt | | (5) | | — | | | — | | | 513 | | | 5,093 | | | 56 | | | 199 | | | 4,950 | |
| 9.00% | | | | Secured Debt | | (5) | | — | | | — | | | 66 | | | 961 | | | — | | | 7 | | | 954 | |
| | | | | Preferred Equity | | (5) | | — | | | 410 | | | — | | | 1,800 | | | 410 | | | — | | | 2,210 | |
| | | | | Member Units | | (5) | | — | | | 2 | | | 23 | | | 713 | | | 3 | | | 1 | | | 715 | |
| Market Force Information, LLC | | | | | Secured Debt | | (9) | | (6,465) | | | 6,060 | | | — | | | 403 | | | 6,060 | | | 6,463 | | | — | |
| | | | | Member Units | | (9) | | (4,160) | | | 4,160 | | | — | | | — | | | 4,160 | | | 4,160 | | | — | |
| MH Corbin Holding LLC | 13.00% | | | | Secured Debt | | (5) | | — | | | 307 | | | 145 | | | 1,137 | | | 308 | | | 169 | | | 1,276 | |
| | | | | Preferred Member Units | | (5) | | — | | | 80 | | | — | | | — | | | 80 | | | — | | | 80 | |
| | | | | Preferred Member Units | | (5) | | — | | | — | | | — | | | — | | | — | | | — | | | — | |
| Mystic Logistics Holdings, LLC | | | | | Secured Debt (12) | | (6) | | — | | | — | | | 1 | | | — | | | — | | | — | | | — | |
| 10.00% | | | | Secured Debt | | (6) | | — | | | — | | | 109 | | | 1,436 | | | — | | | — | | | 1,436 | |
| | | | | Common Stock | | (6) | | — | | | 1,080 | | | 785 | | | 5,708 | | | 1,080 | | | — | | | 6,788 | |
| NexRev LLC | | | | | Secured Debt (12) | | (8) | | — | | | — | | | — | | | — | | | — | | | — | | | — | |
| 10.00% | | | | Secured Debt | | (8) | | — | | | 708 | | | 223 | | | 2,119 | | | 725 | | | 413 | | | 2,431 | |
| | | | | Preferred Member Units | | (8) | | — | | | 1,310 | | | 43 | | | 280 | | | 1,310 | | | — | | | 1,590 | |
| NuStep, LLC | 11.98% | SF+ | 6.50% | | Secured Debt | | (5) | | — | | | (2) | | | 92 | | | 1,100 | | | 1 | | | 203 | | | 898 | |
| 12.00% | | | | Secured Debt | | (5) | | — | | | — | | | 422 | | | 4,603 | | | 3 | | | — | | | 4,606 | |
| | | | | Preferred Member Units | | (5) | | — | | | 300 | | | — | | | 2,010 | | | 300 | | | — | | | 2,310 | |
| | | | | Preferred Member Units | | (5) | | — | | | — | | | — | | | 1,290 | | | — | | | — | | | 1,290 | |
| Oneliance, LLC | 16.48% | SF+ | 11.00% | | Secured Debt | | (7) | | — | | | (7) | | | 172 | | | 1,380 | | | 4 | | | 27 | | | 1,357 | |
| | | | | Preferred Stock | | (7) | | — | | | — | | | — | | | 264 | | | 18 | | | — | | | 282 | |
| Orttech Holdings, LLC | | SF+ | 11.00% | | Secured Debt (12) | | (5) | | — | | | 2 | | | 1 | | | (2) | | | 2 | | | — | | | — | |
| 16.48% | SF+ | 11.00% | | Secured Debt | | (5) | | — | | | 64 | | | 716 | | | 5,814 | | | 86 | | | 350 | | | 5,550 | |
| | | | | Preferred Stock | | (5) | | — | | | 1,320 | | | 227 | | | 2,940 | | | 1,320 | | | — | | | 4,260 | |
| Robbins Bros. Jewelry, Inc. | | | | | Secured Debt | | (9) | | — | | | — | | | 3 | | | (8) | | | 2 | | | — | | | (6) | |
| 12.50% | | | | Secured Debt | | (9) | | — | | | (43) | | | 382 | | | 3,902 | | | 13 | | | 167 | | | 3,748 | |
| | | | | Preferred Equity | | (9) | | — | | | (1,340) | | | — | | | 1,650 | | | — | | | 1,340 | | | 310 | |
| SI East, LLC | 11.25% | | | | Secured Debt (12) | | (7) | | — | | | 6 | | | 8 | | | — | | | 625 | | | — | | | 625 | |
| 12.49% | | | | Secured Debt | | (7) | | — | | | 170 | | | 690 | | | — | | | 18,179 | | | — | | | 18,179 | |
| | | | | Secured Debt | | (7) | | — | | | (134) | | | 1,403 | | | 29,929 | | | — | | | 29,929 | | | — | |
| | | | | Preferred Member Units | | (7) | | — | | | 1,188 | | | 348 | | | 4,550 | | | 1,290 | | | — | | | 5,840 | |
| Student Resource Center, LLC | 8.50% | | | 8.50% | Secured Debt | | (6) | | — | | | (126) | | | 364 | | | 5,063 | | | 243 | | | 8 | | | 5,298 | |
| | | | | Preferred Equity | | (6) | | — | | | 139 | | | — | | | — | | | 139 | | | — | | | 139 | |
| Tedder Industries, LLC | 12.00% | | | | Secured Debt | | (9) | | — | | | (14) | | | 42 | | | 460 | | | — | | | 14 | | | 446 | |
| 12.00% | | | | Secured Debt | | (9) | | — | | | (102) | | | 349 | | | 3,780 | | | 3 | | | 102 | | | 3,681 | |
| | | | | Preferred Member Units | | (9) | | — | | | (1,020) | | | — | | | 1,920 | | | — | | | 1,020 | | | 900 | |
| | | | | Preferred Member Units | | (9) | | — | | | 44 | | | — | | | — | | | 150 | | | — | | | 150 | |
| | | | | Preferred Member Units | | (9) | | — | | | 180 | | | — | | | — | | | 300 | | | — | | | 300 | |
| Trantech Radiator Topco, LLC | | | | | Secured Debt (12) | | (7) | | — | | | (2) | | | 3 | | | — | | | 2 | | | 2 | | | — | |
| 12.00% | | | | Secured Debt | | (7) | | — | | | (10) | | | 191 | | | 1,980 | | | 10 | | | 10 | | | 1,980 | |
| | | | | Common Stock | | (7) | | — | | | 1,400 | | | 22 | | | 1,950 | | | 1,400 | | | — | | | 3,350 | |
| VVS Holdco LLC | | SF+ | 6.00% | | Secured Debt (12) | | (5) | | — | | | — | | | 6 | | | (5) | | | 4 | | | — | | | (1) | |
MSC INCOME FUND, INC.
Consolidated Schedule of Investments In and Advances to Affiliates (Continued)
September 30, 2023
(dollars in thousands)
(unaudited)
| | | | | | | | | | | | | | | | | | | | | | | | | | | | | | | | | | | | | | | | | | | | | | | | | | | | | | | | | | | | | | | | | |
| Company | Total Rate | Base Rate | Spread | PIK Rate | Type of Investment (1)(10)(11) | | Geography | | Amount of
Realized
Gain/(Loss) | | Amount of
Unrealized
Gain/(Loss) | | Amount of
Interest,
Fees or
Dividends
Credited to
Income (2) | | December 31,
2022 Fair Value | | Gross
Additions (3) | | Gross
Reductions (4) | | September 30,
2023 Fair Value (13) |
| 11.50% | | | | Secured Debt | | (5) | | — | | | — | | | 686 | | | 7,421 | | | 45 | | | 551 | | | 6,915 | |
| | | | | Preferred Equity | | (5) | | — | | | (30) | | | 54 | | | 2,990 | | | — | | | 30 | | | 2,960 | |
Other
Amounts related to
investments transferred to
or from other
1940 Act classification
during the period | | | | | | | | | (1,541) | | | 649 | | | (151) | | | — | | | — | | | — | | | — | |
| Total Affiliate investments | | | | | | | | | $ | (7,188) | | | $ | 22,468 | | | $ | 22,241 | | | $ | 277,000 | | | $ | 91,114 | | | $ | 92,225 | | | $ | 275,889 | |
_____________________________
(1)The principal amount, the ownership detail for equity investments and if the investment is income producing is included in the Consolidated Schedule of Investments included in Item 1. Consolidated Financial Statements.
(2)Represents the total amount of interest, fees and dividends credited to income for the portion of the period for which an investment was included in Control or Affiliate categories, respectively. For investments transferred between Control and Affiliate categories during the period, any income or investment balances related to the time period it was in the category other than the one shown at period end is included in “Amounts related to investments transferred from other 1940 Act classifications during the period.”
(3)Gross additions include increases in the cost basis of investments resulting from new portfolio investments, follow-on investments and accrued PIK interest, and the exchange of one or more existing securities for one or more new securities. Gross additions also include net increases in unrealized appreciation or net decreases in net unrealized depreciation as well as the movement of an existing portfolio company into this category and out of a different category.
(4)Gross reductions include decreases in the cost basis of investments resulting from principal repayments or sales and the exchange of one or more existing securities for one or more new securities. Gross reductions also include net increases in net unrealized depreciation or net decreases in unrealized appreciation as well as the movement of an existing portfolio company out of this category and into a different category.
(5)Portfolio company located in the Midwest region as determined by location of the corporate headquarters. The fair value as of September 30, 2023 for affiliate investments located in this region was $98,341. This represented 16.0% of net assets as of September 30, 2023.
(6)Portfolio company located in the Northeast region as determined by location of the corporate headquarters. The fair value as of September 30, 2023 for affiliate investments located in this region was $40,617. This represented 6.6% of net assets as of September 30, 2023.
(7)Portfolio company located in the Southeast region as determined by location of the corporate headquarters. The fair value as of September 30, 2023 for affiliate investments located in this region was $31,613. This represented 5.2% of net assets as of September 30, 2023.
(8)Portfolio company located in the Southwest region as determined by location of the corporate headquarters. The fair value as of September 30, 2023 for control investments located in this region was $53,478. This represented 8.7% of net assets as of September 30, 2023. The fair value as of September 30, 2023 for affiliate investments located in this region was $75,393. This represented 12.3% of net assets as of September 30, 2023.
MSC INCOME FUND, INC.
Consolidated Schedule of Investments In and Advances to Affiliates (Continued)
September 30, 2023
(dollars in thousands)
(unaudited)
(9)Portfolio company located in the West region as determined by location of the corporate headquarters. The fair value as of September 30, 2023 for control investments located in this region was $588. This represented 0.1% of net assets as of September 30, 2023. The fair value as of September 30, 2023 for affiliate investments located in this region was $29,925. This represented 4.9% of net assets as of September 30, 2023.
(10)All of the Company’s portfolio investments are generally subject to restrictions on resale as “restricted securities,” unless otherwise noted.
(11)This schedule should be read in conjunction with the Consolidated Schedule of Investments and Notes to the Consolidated Financial Statements included in Item 1. Consolidated Financial Statements. Supplemental information can be located within the Consolidated Schedule of Investments including end of period interest rate, preferred dividend rate, maturity date, investments not paid currently in cash and investments whose value was determined using significant unobservable inputs.
(12)Investment has an unfunded commitment as of September 30, 2023 (see Note I). The fair value of the investment includes the impact of the fair value of any unfunded commitments.
(13)Negative fair value is the result of the capitalized discount being greater than the principal amount outstanding on the loan.
REPORT OF INDEPENDENT REGISTERED PUBLIC ACCOUNTING FIRM
Board of Directors and Stockholders
MSC Income Fund, Inc.
Opinion on the financial statements
We have audited the accompanying consolidated balance sheets of MSC Income Fund, Inc. (a Maryland corporation) and subsidiaries (the “Company”), including the consolidated schedules of investments, as of December 31, 2023 and 2022, the related consolidated statements of operations, changes in net assets, and cash flows for each of the three years in the period ended December 31, 2023, and the related notes and financial statement schedule included under Item 15(b) (collectively referred to as the “financial statements”). In our opinion, the financial statements present fairly, in all material respects, the financial position of the Company as of December 31, 2023 and 2022, and the results of its operations and its cash flows for each of the three years in the period ended December 31, 2023, in conformity with accounting principles generally accepted in the United States of America.
Basis for opinion
These financial statements are the responsibility of the Company’s management. Our responsibility is to express an opinion on the Company’s financial statements based on our audits. We are a public accounting firm registered with the Public Company Accounting Oversight Board (United States) (“PCAOB”) and are required to be independent with respect to the Company in accordance with the U.S. federal securities laws and the applicable rules and regulations of the Securities and Exchange Commission and the PCAOB.
We conducted our audits in accordance with the standards of the PCAOB. Those standards require that we plan and perform the audit to obtain reasonable assurance about whether the financial statements are free of material misstatement, whether due to error or fraud. The Company is not required to have, nor were we engaged to perform, an audit of its internal control over financial reporting. As part of our audits we are required to obtain an understanding of internal control over financial reporting but not for the purpose of expressing an opinion on the effectiveness of the Company’s internal control over financial reporting. Accordingly, we express no such opinion.
Our audits included performing procedures to assess the risks of material misstatement of the financial statements, whether due to error or fraud, and performing procedures that respond to those risks. Such procedures included examining, on a test basis, evidence regarding the amounts and disclosures in the financial statements. Our procedures included confirmation of securities as of December 31, 2023, by correspondence with the portfolio companies and custodians; when replies were not received, we performed other auditing procedures. Our audits also included evaluating the accounting principles used and significant estimates made by management, as well as evaluating the overall presentation of the financial statements. We believe that our audits provide a reasonable basis for our opinion.
Critical audit matter
The critical audit matter communicated below is a matter arising from the current period audit of the financial statements that was communicated or required to be communicated to the audit committee and that: (1) relates to accounts or disclosures that are material to the financial statements and (2) involved our especially challenging, subjective, or complex judgments. The communication of critical audit matters does not alter in any way our opinion on the financial statements, taken as a whole, and we are not, by communicating the critical audit matter below, providing a separate opinion on the critical audit matter or on the accounts or disclosures to which it relates.
Fair Value of Investments
As described further in Note C to the financial statements, the Company’s investments recorded at fair value, categorized as Level 3 investments within the fair value hierarchy, totaled $1,092,895 thousand at December 31, 2023. Approximately 95% of these investments have no readily available market values and are measured using significant unobservable inputs and assumptions, and generally use valuation techniques such as the income and market approach. The significant unobservable inputs disclosed by management include, among others, weighted-average cost of capital (“WACC”) inputs and market multiples for equity investments, and risk adjusted discount rates and percentage of expected principal recovery for debt investments. Changes in these assumptions could have a significant impact on the determination of fair value. As such, we identified fair value of Level 3 investments measured using significant unobservable inputs and assumptions as a critical audit matter.
REPORT OF INDEPENDENT REGISTERED PUBLIC ACCOUNTING FIRM
The principal considerations for our determination that fair value of Level 3 investments measured using significant unobservable inputs is a critical audit matter are the significant management judgements used in developing complex valuation techniques and inherent estimation uncertainty. Auditing these investments requires a high degree of subjective auditor judgement, including use of valuation professionals with specialized skills and knowledge, to evaluate the reasonableness of unobservable inputs and assumptions.
Our audit procedures related to the critical audit matter included the following, among others:
•Testing the design and operating effectiveness of controls over management’s process to determine investment fair value. Specifically, we identified and tested key attributes of management’s fair value determination review. These attributes addressed the relevance, adequacy and appropriateness of the data, assumptions, valuation methods, and mathematical accuracy used to determine investment fair value as of the reporting date.
•Evaluated the ability to estimate fair value by comparing prior period fair values to transaction prices of transactions occurring subsequent to the prior period valuation date.
•With the assistance of internal valuation specialists to evaluate and test management’s process to develop the valuation estimates, we performed substantive audit procedures to determine mathematical accuracy and to determine that the data, valuation methods, and significant unobservable inputs and assumptions used to determine investment fair value as of the Company’s reporting date were reasonable. We tested certain key inputs/assumptions for a selection of investments, including the following, as applicable:
•enterprise values,
•weighted average cost of capital (“WACC”),
•discount rates,
•forecasted cash flows and long-term growth rates,
•discount for lack of marketability,
•market multiples,
•weighting between valuation techniques,
•risk adjusted discount factor, and
•percentage of expected principal recovery.
In testing the above, we considered available third-party market information and published studies, current economic conditions and subsequent events, and other information that could be corroborated to source information.
/s/ GRANT THORNTON LLP
We have served as the Company’s auditor since 2012.
Houston, Texas
March 8, 2024, except for the effects of the reverse stock split discussed in Note A.3 to the consolidated financial statements, as to which the date is December 20, 2024
MSC INCOME FUND, INC.
Consolidated Balance Sheets
(dollars in thousands, except shares and per share amounts)
| | | | | | | | | | | |
| December 31, 2023 | | December 31, 2022 |
| ASSETS | | | |
| Investments at fair value: | | | |
Control investments (cost: $43,159 and $31,120 as of December 31, 2023 and December 31, 2022, respectively) | $ | 53,644 | | | $ | 50,303 | |
Affiliate investments (cost: $231,378 and $241,565 as of December 31, 2023 and December 31, 2022, respectively) | 291,279 | | | 277,000 | |
Non‑Control/Non‑Affiliate investments (cost: $763,781 and $787,201 as of December 31, 2023 and December 31, 2022, respectively) | 747,972 | | | 740,840 | |
Total investments (cost: $1,038,318 and $1,059,886 as of December 31, 2023 and December 31, 2022, respectively) | 1,092,895 | | | 1,068,143 | |
| Cash and cash equivalents | 30,786 | | | 21,312 | |
| Interest and dividend receivable | 10,541 | | | 11,917 | |
| Receivable for securities sold | 171 | | | 464 | |
Deferred financing costs (net of accumulated amortization of $4,168 and $2,413 as of December 31, 2023 and December 31, 2022, respectively) | 3,416 | | | 2,908 | |
| Prepaids and other assets | 2,091 | | | 2,420 | |
| Total assets | $ | 1,139,900 | | | $ | 1,107,164 | |
| LIABILITIES | | | |
| Credit Facilities | $ | 335,688 | | | $ | 321,688 | |
Series A Notes due 2026 (par: $150,000 as of both December 31, 2023 and December 31, 2022) | 149,155 | | | 148,856 | |
| Accounts payable and other liabilities | 255 | | | 1,292 | |
| Payable for securities purchased | 206 | | | — | |
| Interest payable | 6,266 | | | 5,443 | |
| Dividend payable | 14,019 | | | 12,816 | |
| Management and incentive fees payable | 8,745 | | | 7,042 | |
| Deferred tax liability, net | 3,259 | | | 362 | |
| Total liabilities | 517,593 | | | 497,499 | |
| Commitments and contingencies (Note J) | | | |
NET ASSETS (1) | | | |
Common stock, $0.001 par value per share (450,000,000 shares authorized; 40,054,433 and 40,053,000 shares issued and outstanding as of December 31, 2023 and December 31, 2022, respectively) | 40 | | 40 |
| Additional paid‑in capital | 686,176 | | 684,205 |
| Total overdistributed earnings | (63,909) | | | (74,580) | |
| Total net assets | 622,307 | | | 609,665 | |
| Total liabilities and net assets | $ | 1,139,900 | | | $ | 1,107,164 | |
NET ASSET VALUE PER SHARE (1) | $ | 15.54 | | | $ | 15.22 | |
(1)As discussed in Note A.3 - Reverse Stock Split, the Company completed a two-for-one reverse stock split, effective as of December 16, 2024.
The accompanying notes are an integral part of these consolidated financial statements
MSC INCOME FUND, INC.
Consolidated Statements of Operations
(dollars in thousands, except shares and per share amounts)
| | | | | | | | | | | | | | | | | |
| Year Ended December 31, |
| 2023 | | 2022 | | 2021 |
| INVESTMENT INCOME: | | | | | |
| Interest, fee and dividend income: | | | | | |
| Control investments | $ | 3,101 | | | $ | 3,223 | | | $ | 2,810 | |
| Affiliate investments | 29,805 | | | 24,057 | | | 18,244 | |
| Non‑Control/Non‑Affiliate investments | 98,480 | | | 76,485 | | | 69,074 | |
| Total investment income | 131,386 | | | 103,765 | | | 90,128 | |
| EXPENSES: | | | | | |
| Interest | (36,458) | | | (24,423) | | | (14,469) | |
| Base management fees | (19,828) | | | (19,831) | | | (17,316) | |
| Incentive fees | (12,569) | | | (2,130) | | | (557) | |
| Internal administrative services expenses | (8,916) | | | (5,147) | | | (4,317) | |
| General and administrative | (4,254) | | | (3,905) | | | (4,427) | |
| Total expenses before expense waivers | (82,025) | | | (55,436) | | | (41,086) | |
| Waiver of internal administrative services expenses | 8,308 | | | 4,540 | | | 4,317 | |
| Total expenses, net of expense waivers | (73,717) | | | (50,896) | | | (36,769) | |
| NET INVESTMENT INCOME | 57,669 | | | 52,869 | | | 53,359 | |
| NET REALIZED GAIN (LOSS): | | | | | |
| Control investments | 2,223 | | | — | | | — | |
| Affiliate investments | (7,188) | | | (7,327) | | | (2,673) | |
| Non‑Control/Non‑Affiliate investments | (29,045) | | | 3,391 | | | 2,175 | |
| Realized loss on extinguishment of debt | — | | | — | | | (2,430) | |
| Total net realized loss | (34,010) | | | (3,936) | | | (2,928) | |
| NET UNREALIZED APPRECIATION (DEPRECIATION): | | | | | |
| Control investments | (1,289) | | | 1,503 | | | 2,001 | |
| Affiliate investments | 25,116 | | | 15,689 | | | 10,237 | |
| Non‑Control/Non‑Affiliate investments | 22,492 | | | (18,894) | | | 12,857 | |
| Total net unrealized appreciation (depreciation) | 46,319 | | | (1,702) | | | 25,095 | |
| INCOME TAXES: | | | | | |
| Federal and state income, excise and other taxes | (872) | | | (1,281) | | | (1,890) | |
| Deferred taxes | (2,897) | | | (362) | | | — | |
| Income tax provision | (3,769) | | | (1,643) | | | (1,890) | |
| NET INCREASE IN NET ASSETS RESULTING FROM OPERATIONS | $ | 66,209 | | | $ | 45,588 | | | $ | 73,636 | |
NET INVESTMENT INCOME PER SHARE—BASIC AND DILUTED (1) | $ | 1.44 | | | $ | 1.32 | | | $ | 1.34 | |
NET INCREASE IN NET ASSETS RESULTING FROM OPERATIONS PER SHARE—BASIC AND DILUTED (1) | $ | 1.65 | | | $ | 1.14 | | | $ | 1.84 | |
WEIGHTED-AVERAGE SHARES OUTSTANDING—BASIC AND DILUTED (1) | 40,134,501 | | | 39,996,520 | | | 39,936,769 | |
(1)As discussed in Note A.3 - Reverse Stock Split, the Company completed a two-for-one reverse stock split, effective as of December 16, 2024.
The accompanying notes are an integral part of these consolidated financial statements
MSC INCOME FUND, INC.
Consolidated Statements of Changes in Net Assets
(dollars in thousands, except shares)
| | | | | | | | | | | | | | | | | | | | | | | | | | | | | |
| Common Stock (1) | | Additional Paid-In Capital (1) | | Total
Overdistributed
Earnings | | Total Net
Asset Value |
| Number of
Shares | | Par
Value | | | |
Balances at December 31, 2020 | 39,804,152 | | | $ | 40 | | | $ | 682,068 | | | $ | (102,484) | | | $ | 579,624 | |
| Issuance of common stock | 44,853 | | | — | | | 674 | | | — | | | 674 | |
| Dividend reinvestment | 730,857 | | | 1 | | | 11,159 | | | — | | | 11,160 | |
| Common stock repurchased | (666,559) | | | (1) | | | (10,064) | | | — | | | (10,065) | |
| Net increase resulting from operations | — | | | — | | | — | | | 73,636 | | | 73,636 | |
| Dividends to stockholders | — | | | — | | | — | | | (41,859) | | | (41,859) | |
| Reclassification for certain permanent book-to-tax differences | — | | | — | | | (1,371) | | | 1,371 | | | — | |
Balances at December 31, 2021 | 39,913,303 | | | $ | 40 | | | $ | 682,466 | | | $ | (69,336) | | | $ | 613,170 | |
| Issuance of common stock | 47,349 | | | — | | | 750 | | | — | | | 750 | |
| Dividend reinvestment | 1,129,806 | | | 2 | | | 17,748 | | | — | | | 17,750 | |
| Common stock repurchased | (1,037,458) | | | (2) | | | (15,984) | | | — | | | (15,986) | |
| Net increase resulting from operations | — | | | — | | | — | | | 45,588 | | | 45,588 | |
| Dividends to stockholders | — | | | — | | | — | | | (51,607) | | | (51,607) | |
| Reclassification for certain permanent book-to-tax differences | — | | | — | | | (775) | | | 775 | | | — | |
Balances at December 31, 2022 | 40,053,000 | | | $ | 40 | | | $ | 684,205 | | | $ | (74,580) | | | $ | 609,665 | |
| Issuance of common stock | 540,093 | | | 1 | | | 8,499 | | | — | | | 8,500 | |
| Dividend reinvestment | 1,172,623 | | | 2 | | | 18,415 | | | — | | | 18,417 | |
| Common stock repurchased | (1,711,283) | | | (3) | | | (24,424) | | | — | | | (24,427) | |
| Net increase resulting from operations | — | | | — | | | — | | | 66,209 | | | 66,209 | |
| Dividends to stockholders | — | | | — | | | — | | | (56,057) | | | (56,057) | |
| Reclassification for certain permanent book-to-tax differences | — | | | — | | | (519) | | | 519 | | | — | |
Balances at December 31, 2023 | 40,054,433 | | | $ | 40 | | | $ | 686,176 | | | $ | (63,909) | | | $ | 622,307 | |
(1)As discussed in Note A.3 - Reverse Stock Split, the Company completed a two-for-one reverse stock split, effective as of December 16, 2024.
The accompanying notes are an integral part of these consolidated financial statements
MSC INCOME FUND, INC.
Consolidated Statements of Cash Flows
(dollars in thousands)
| | | | | | | | | | | | | | | | | |
| Year Ended December 31, |
| 2023 | | 2022 | | 2021 |
| CASH FLOWS FROM OPERATING ACTIVITIES | | | | | |
| Net increase in net assets resulting from operations | $ | 66,209 | | | $ | 45,588 | | | $ | 73,636 | |
| Adjustments to reconcile net increase in net assets resulting from operations to net cash provided by (used in) operating activities: | | | | | |
| Investments in portfolio companies | (236,404) | | | (217,226) | | | (546,882) | |
| Proceeds from sales and repayments of debt investments in portfolio companies | 223,154 | | | 247,455 | | | 312,806 | |
| Proceeds from sales and return of capital of equity investments in portfolio companies | 15,595 | | | — | | | — | |
| Net unrealized (appreciation) depreciation | (46,319) | | | 1,702 | | | (25,095) | |
| Net realized loss on portfolio investments | 34,010 | | | 3,936 | | | 498 | |
| Realized loss on extinguishment of debt | — | | | — | | | 2,430 | |
| Amortization of deferred financing costs | 2,053 | | | 1,463 | | | 1,277 | |
| Amortization of deferred offering costs | 129 | | | 276 | | | 230 | |
| Accretion of unearned income | (7,833) | | | (5,054) | | | (5,139) | |
| Payment-in-kind interest | (5,023) | | | (4,057) | | | (5,361) | |
| Cumulative dividends | (172) | | | (669) | | | — | |
| Deferred tax provision | 2,897 | | | 362 | | | — | |
| Changes in other assets and liabilities: | | | | | |
| Interest and dividend receivable | 116 | | | 1,074 | | | (4,688) | |
| Prepaid and other assets | 329 | | | (361) | | | 380 | |
| Management and incentive fees payable | 1,703 | | | 1,853 | | | 1,137 | |
| Interest payable | 823 | | | 2,350 | | | 2,807 | |
| Accounts payable and other liabilities | (1,037) | | | (2,016) | | | 816 | |
| Net cash provided by (used in) operating activities | 50,230 | | | 76,676 | | | (191,148) | |
| CASH FLOWS FROM FINANCING ACTIVITIES | | | | | |
| Issuance of common stock | 8,500 | | | 750 | | | 674 | |
| Redemption of common stock | (24,427) | | | (15,984) | | | (10,065) | |
| Payment of offering costs | (129) | | | (276) | | | (230) | |
| Dividends paid | (36,438) | | | (33,018) | | | (18,725) | |
| Proceeds from Credit Facilities | 150,000 | | | 115,000 | | | 489,688 | |
| Repayments on Credit Facilities | (136,000) | | | (220,000) | | | (364,816) | |
| Proceeds from Series A Notes due 2026 | — | | | 72,500 | | | 77,500 | |
| Proceeds from Main Street Term Loan | — | | | — | | | 60,000 | |
| Repayments of Main Street Term Loan | — | | | — | | | (60,000) | |
| Payment of deferred financing costs | (2,262) | | | (149) | | | (6,131) | |
| Net cash provided by (used in) financing activities | (40,756) | | | (81,177) | | | 167,895 | |
| Net increase (decrease) in cash and cash equivalents | 9,474 | | | (4,501) | | | (23,253) | |
| CASH AND CASH EQUIVALENTS AT BEGINNING OF PERIOD | 21,312 | | | 25,813 | | | 49,066 | |
| CASH AND CASH EQUIVALENTS AT END OF PERIOD | $ | 30,786 | | | $ | 21,312 | | | $ | 25,813 | |
| | | | | |
| Supplemental cash flow disclosures: | | | | | |
| Interest paid | $ | 33,594 | | | $ | 20,610 | | | $ | 10,385 | |
| Taxes paid | $ | 2,003 | | | $ | 2,469 | | | $ | 1,324 | |
| Non-cash financing activities: | | | | | |
| Dividends declared and unpaid | $ | 14,019 | | | $ | 12,816 | | | $ | 11,974 | |
| Value of shares issued pursuant to the DRIP | $ | 18,417 | | | $ | 17,750 | | | $ | 11,160 | |
The accompanying notes are an integral part of these consolidated financial statements
MSC INCOME FUND, INC.
Consolidated Schedule of Investments
December 31, 2023
(dollars in thousands)
| | | | | | | | | | | | | | | | | | | | | | | | | | | | | | | | | | | | | | | | | | | | |
| Portfolio Company (1) (20) | | Business Description | Type of Investment (2) (3) (15) | | Investment Date (22) | Shares/Units | Total Rate | Reference Rate and Spread (25) | PIK Rate (19) | Maturity Date | Principal (4) | Cost (4) | Fair Value (18) |
| Control Investments (5) | | | | | | | | | | | | | | |
| Copper Trail Fund Investments | (12) (13) | Investment Partnership | | | | | | | | | | | | |
| | | LP Interests (CTMH, LP) | (8) (24) | 7/17/2017 | 38.8% | | | | | | | $ | 693 | | $ | 568 | |
| | | | | | | | | | | | | | |
| GRT Rubber Technologies LLC | | Manufacturer of Engineered Rubber Products | | | | | | | | | | | | |
| | | Secured Debt | | 12/21/2018 | | 11.48% | SF+ | 6.00% | | 10/29/2026 | 1,182 | | 1,173 | | 1,182 | |
| | | Secured Debt | | 12/19/2014 | | 13.48% | SF+ | 8.00% | | 10/29/2026 | 19,944 | | 19,803 | | 19,944 | |
| | | Member Units | | 12/19/2014 | 2,896 | | | | | | | 6,435 | | 21,890 | |
| | | | | | | | | | | | | 27,411 | | 43,016 | |
| Harris Preston Fund Investments | (12) (13) | Investment Partnership | | | | | | | | | | | | |
| | | LP Interests (2717 MH, L.P.) | (8) (24) | 10/1/2017 | 49.3% | | | | | | | 3,345 | | 6,050 | |
| | | | | | | | | | | | | | |
| Volusion, LLC | | Provider of Online Software-as-a-Service eCommerce Solutions | | | | | | | | | | | | |
| | | Secured Debt | | 3/31/2023 | | 10.00% | | | | 3/31/2025 | 900 | | 900 | | 900 | |
| | | Preferred Member Units | | 3/31/2023 | 2,184,683 | | | | | | | 3,706 | | 3,110 | |
| | | Preferred Member Units | | 3/31/2023 | 61,077 | | | | | | | — | | — | |
| | | Preferred Member Units | | 1/26/2015 | 2,090,001 | | | | | | | 6,000 | | — | |
| | | Common Stock | | 3/31/2023 | 772,620 | | | | | | | 1,104 | | — | |
| | | | | | | | | | | | | 11,710 | | 4,010 | |
Subtotal Control Investments (8.6% of net assets at fair value) | | | | | | | | | | | | | $ | 43,159 | | $ | 53,644 | |
| Affiliate Investments (6) | | | | | | | | | | | | | | |
| Analytical Systems Keco Holdings, LLC | | Manufacturer of Liquid and Gas Analyzers | | | | | | | | | | | | |
| | | Secured Debt | (9) | 8/16/2019 | | 15.38% | SF+ | 10.00% | | 8/16/2024 | $ | 55 | | $ | 54 | | $ | 54 | |
| | | Secured Debt | (9) | 8/16/2019 | | 15.38% | SF+ | 10.00% | | 8/16/2024 | 1,031 | | 1,020 | | 1,020 | |
| | | Preferred Member Units | | 5/20/2021 | 607 | | | | | | | 607 | | 1,210 | |
| | | Preferred Member Units | | 8/16/2019 | 800 | 14.13% | | | | | | 800 | | — | |
| | | Warrants | (27) | 8/16/2019 | 105 | | | | | 8/16/2029 | | 79 | | — | |
| | | | | | | | | | | | | 2,560 | | 2,284 | |
| Barfly Ventures, LLC | (10) | Casual Restaurant Group | | | | | | | | | | | | |
| | | Member Units | | 10/26/2020 | 12 | | | | | | | 528 | | 1,380 | |
| | | | | | | | | | | | | | |
| Batjer TopCo, LLC | | HVAC Mechanical Contractor | | | | | | | | | | | | |
| | | Secured Debt | (37) | 3/7/2022 | | | | | | 3/7/2027 | — | | (1) | | — | |
| | | Secured Debt | | 3/7/2022 | | 10.00% | | | | 3/7/2027 | 30 | | 30 | | 30 | |
| | | Secured Debt | | 3/7/2022 | | 10.00% | | | | 3/7/2027 | 1,175 | | 1,160 | | 1,175 | |
| | | Preferred Stock | (8) | 3/7/2022 | 453 | | | | | | | 455 | | 680 | |
| | | | | | | | | | | | | 1,644 | | 1,885 | |
MSC INCOME FUND, INC.
Consolidated Schedule of Investments (Continued)
December 31, 2023
(dollars in thousands)
| | | | | | | | | | | | | | | | | | | | | | | | | | | | | | | | | | | | | | | | | | | | |
| Portfolio Company (1) (20) | | Business Description | Type of Investment (2) (3) (15) | | Investment Date (22) | Shares/Units | Total Rate | Reference Rate and Spread (25) | PIK Rate (19) | Maturity Date | Principal (4) | Cost (4) | Fair Value (18) |
| Brewer Crane Holdings, LLC | | Provider of Crane Rental and Operating Services | | | | | | | | | | | | |
| | | Secured Debt | (9) | 1/9/2018 | | 15.46% | L+ | 10.00% | | 1/9/2025 | 1,375 | | 1,375 | | 1,374 | |
| | | Preferred Member Units | (8) | 1/9/2018 | 737 | | | | | | | 1,070 | | 1,400 | |
| | | | | | | | | | | | | 2,445 | | 2,774 | |
| Centre Technologies Holdings, LLC | | Provider of IT Hardware Services and Software Solutions | | | | | | | | | | | | |
| | | Secured Debt | (9) (37) | 1/4/2019 | | | SF+ | 9.00% | | 1/4/2026 | — | | — | | — | |
| | | Secured Debt | (9) | 1/4/2019 | | 14.48% | SF+ | 9.00% | | 1/4/2026 | 4,394 | | 4,364 | | 4,394 | |
| | | Preferred Member Units | | 1/4/2019 | 3,327 | | | | | | | 1,531 | | 2,760 | |
| | | | | | | | | | | | | 5,895 | | 7,154 | |
| Chamberlin Holding LLC | | Roofing and Waterproofing Specialty Contractor | | | | | | | | | | | | |
| | | Secured Debt | (9) (37) | 2/26/2018 | | | SF+ | 6.00% | | 2/26/2026 | — | | (49) | | — | |
| | | Secured Debt | (9) | 2/26/2018 | | 13.49% | SF+ | 8.00% | | 2/26/2026 | 3,905 | | 3,903 | | 3,905 | |
| | | Member Units | (8) | 2/26/2018 | 1,087 | | | | | | | 2,860 | | 7,330 | |
| | | Member Units | (8) (23) | 11/2/2018 | 261,786 | | | | | | | 443 | | 715 | |
| | | | | | | | | | | | | 7,157 | | 11,950 | |
| Charps, LLC | | Pipeline Maintenance and Construction | | | | | | | | | | | | |
| | | Preferred Member Units | (8) | 2/3/2017 | 457 | | | | | | | 491 | | 3,920 | |
| | | | | | | | | | | | | | |
| Clad-Rex Steel, LLC | | Specialty Manufacturer of Vinyl-Clad Metal | | | | | | | | | | | | |
| | | Secured Debt | | 12/20/2016 | | 11.50% | | | | 1/15/2024 | 2,140 | | 2,140 | | 2,103 | |
| | | Secured Debt | | 12/20/2016 | | 10.00% | | | | 12/20/2036 | 253 | | 251 | | 251 | |
| | | Member Units | (8) | 12/20/2016 | 179 | | | | | | | 1,820 | | 1,300 | |
| | | Member Units | (23) | 12/20/2016 | 200 | | | | | | | 127 | | 282 | |
| | | | | | | | | | | | | 4,338 | | 3,936 | |
| Cody Pools, Inc. | | Designer of Residential and Commercial Pools | | | | | | | | | | | | |
| | | Secured Debt | (37) | 3/6/2020 | | | | | | 12/17/2026 | — | | (2) | | — | |
| | | Secured Debt | | 3/6/2020 | | 12.50% | | | | 12/17/2026 | 7,111 | | 7,089 | | 7,111 | |
| | | Preferred Member Units | (8) (23) | 3/6/2020 | 147 | | | | | | | 2,079 | | 18,120 | |
| | | | | | | | | | | | | 9,166 | | 25,231 | |
| Colonial Electric Company LLC | | Provider of Electrical Contracting Services | | | | | | | | | | | | |
| | | Secured Debt | (37) | 3/31/2021 | | | | | | 3/31/2026 | — | | — | | — | |
| | | Secured Debt | | 3/31/2021 | | 12.00% | | | | 3/31/2026 | 5,513 | | 5,448 | | 5,407 | |
| | | Preferred Member Units | | 6/27/2023 | 240 | | | | | | | 240 | | 600 | |
| | | Preferred Member Units | | 3/31/2021 | 4,320 | | | | | | | 1,920 | | 1,920 | |
| | | | | | | | | | | | | 7,608 | | 7,927 | |
| Compass Systems & Sales, LLC | | Designer of End-to-End Material Handling Solutions | | | | | | | | | | | | |
MSC INCOME FUND, INC.
Consolidated Schedule of Investments (Continued)
December 31, 2023
(dollars in thousands)
| | | | | | | | | | | | | | | | | | | | | | | | | | | | | | | | | | | | | | | | | | | | |
| Portfolio Company (1) (20) | | Business Description | Type of Investment (2) (3) (15) | | Investment Date (22) | Shares/Units | Total Rate | Reference Rate and Spread (25) | PIK Rate (19) | Maturity Date | Principal (4) | Cost (4) | Fair Value (18) |
| | | Secured Debt | (37) | 11/22/2023 | | | | | | 11/22/2028 | — | | — | | — | |
| | | Secured Debt | | 11/22/2023 | | 13.50% | | | | 11/22/2028 | 4,300 | | 4,175 | | 4,175 | |
| | | Preferred Equity | | 11/22/2023 | 1,863 | | | | | | | 1,863 | | 1,863 | |
| | | | | | | | | | | | | 6,038 | | 6,038 | |
| Datacom, LLC | | Technology and Telecommunications Provider | | | | | | | | | | | | |
| | | Secured Debt | | 3/1/2022 | | 7.50% | | | | 12/31/2025 | 50 | | 49 | | 49 | |
| | | Secured Debt | | 3/31/2021 | | 10.00% | | | | 12/31/2025 | 928 | | 887 | | 844 | |
| | | Preferred Member Units | | 3/31/2021 | 1,000 | | | | | | | 290 | | 10 | |
| | | | | | | | | | | | | 1,226 | | 903 | |
| Digital Products Holdings LLC | | Designer and Distributor of Consumer Electronics | | | | | | | | | | | | |
| | | Secured Debt | (9) | 4/1/2018 | | 15.38% | SF+ | 10.00% | | 4/27/2026 | 3,718 | | 3,689 | | 3,673 | |
| | | Preferred Member Units | (8) | 4/1/2018 | 964 | | | | | | | 2,375 | | 2,459 | |
| | | | | | | | | | | | | 6,064 | | 6,132 | |
| Direct Marketing Solutions, Inc. | | Provider of Omni-Channel Direct Marketing Services | | | | | | | | | | | | |
| | | Secured Debt | | 2/13/2018 | | 14.00% | | | | 2/13/2026 | 217 | | 213 | | 217 | |
| | | Secured Debt | | 12/27/2022 | | 14.00% | | | | 2/13/2026 | 5,002 | | 4,974 | | 5,002 | |
| | | Preferred Stock | (8) | 2/13/2018 | 2,100 | | | | | | | 2,100 | | 5,180 | |
| | | | | | | | | | | | | 7,287 | | 10,399 | |
| Flame King Holdings, LLC | | Propane Tank and Accessories Distributor | | | | | | | | | | | | |
| | | Preferred Equity | (8) | 10/29/2021 | 2,340 | | | | | | | 2,600 | | 6,970 | |
| | | | | | | | | | | | | | |
| Freeport Financial Funds | (12) (13) | Investment Partnership | | | | | | | | | | | | |
| | | LP Interests (Freeport First Lien Loan Fund III LP) | (8) (24) | 7/31/2015 | 6.0% | | | | | | 4,160 | | 4,160 | | 3,705 | |
| | | | | | | | | | | | | | |
| Gamber-Johnson Holdings, LLC | | Manufacturer of Ruggedized Computer Mounting Systems | | | | | | | | | | | | |
| | | Secured Debt | (9) (36) (37) | 6/24/2016 | | | SF+ | 7.50% | | 1/1/2028 | — | | — | | — | |
| | | Secured Debt | (9) (36) | 12/15/2022 | | 10.50% | SF+ | 7.50% | | 1/1/2028 | 13,520 | | 13,336 | | 13,520 | |
| | | Member Units | (8) | 6/24/2016 | 2,261 | | | | | | | 4,423 | | 24,180 | |
| | | | | | | | | | | | | 17,759 | | 37,700 | |
| GFG Group, LLC | | Grower and Distributor of a Variety of Plants and Products to Other Wholesalers, Retailers and Garden Centers | | | | | | | | | | | | |
| | | Secured Debt | | 3/31/2021 | | 8.00% | | | | 3/31/2026 | 2,336 | | 2,304 | | 2,336 | |
| | | Preferred Member Units | (8) | 3/31/2021 | 56 | | | | | | | 1,225 | | 2,870 | |
| | | | | | | | | | | | | 3,529 | | 5,206 | |
MSC INCOME FUND, INC.
Consolidated Schedule of Investments (Continued)
December 31, 2023
(dollars in thousands)
| | | | | | | | | | | | | | | | | | | | | | | | | | | | | | | | | | | | | | | | | | | | |
| Portfolio Company (1) (20) | | Business Description | Type of Investment (2) (3) (15) | | Investment Date (22) | Shares/Units | Total Rate | Reference Rate and Spread (25) | PIK Rate (19) | Maturity Date | Principal (4) | Cost (4) | Fair Value (18) |
| Gulf Publishing Holdings, LLC | | Energy Industry Focused Media and Publishing | | | | | | | | | | | | |
| | | Secured Debt | (9) (37) | 9/29/2017 | | | SF+ | 9.50% | | 7/1/2027 | — | | — | | — | |
| | | Secured Debt | | 7/1/2022 | | 12.50% | | | | 7/1/2027 | 600 | | 600 | | 571 | |
| | | Preferred Equity | | 7/1/2022 | 15,930 | | | | | | | 1,400 | | 620 | |
| | | Member Units | | 4/29/2016 | 920 | | | | | | | 920 | | — | |
| | | | | | | | | | | | | 2,920 | | 1,191 | |
| Harris Preston Fund Investments | (12) (13) | Investment Partnership | | | | | | | | | | | | |
| | | LP Interests (HPEP 3, L.P.) | (24) | 8/9/2017 | 8.2% | | | | | | 2,296 | | 2,296 | | 4,225 | |
| | | | | | | | | | | | | | |
| IG Investor, LLC | | Military and Other Tactical Gear | | | | | | | | | | | | |
| | | Secured Debt | (37) | 6/21/2023 | | | | | | 6/21/2028 | — | | (27) | | (27) | |
| | | Secured Debt | | 6/21/2023 | | 13.00% | | | | 6/21/2028 | 9,316 | | 9,069 | | 9,069 | |
| | | Common Equity | | 6/21/2023 | 3,600 | | | | | | | 3,600 | | 3,600 | |
| | | | | | | | | | | | | 12,642 | | 12,642 | |
| Independent Pet Partners Intermediate Holdings, LLC | (10) | Omnichannel Retailer of Specialty Pet Products | | | | | | | | | | | | |
| | | Common Equity | | 4/7/2023 | 6,436,566 | | | | | | | 6,540 | | 6,320 | |
| | | | | | | | | | | | | | |
| Integral Energy Services | (10) | Nuclear Power Staffing Services | | | | | | | | | | | | |
| | | Secured Debt | (9) | 8/20/2021 | | 13.16% | SF+ | 7.50% | | 8/20/2026 | 16,925 | | 16,737 | | 16,232 | |
| | | Preferred Equity | | 12/7/2023 | 3,725 | 10.00% | | | 10.00% | | | 265 | | 350 | |
| | | Common Stock | | 8/20/2021 | 11,647 | | | | | | | 1,584 | | 190 | |
| | | | | | | | | | | | | 18,586 | | 16,772 | |
| Kickhaefer Manufacturing Company, LLC | | Precision Metal Parts Manufacturing | | | | | | | | | | | | |
| | | Secured Debt | | 10/31/2018 | | 12.00% | | | | 10/31/2026 | 4,950 | | 4,933 | | 4,933 | |
| | | Secured Debt | | 10/31/2018 | | 9.00% | | | | 10/31/2048 | 960 | | 951 | | 951 | |
| | | Preferred Equity | | 10/31/2018 | 145 | | | | | | | 3,060 | | 2,420 | |
| | | Member Units | (23) | 10/31/2018 | 200 | | | | | | | 248 | | 683 | |
| | | | | | | | | | | | | 9,192 | | 8,987 | |
| MH Corbin Holding LLC | | Manufacturer and Distributor of Traffic Safety Products | | | | | | | | | | | | |
| | | Secured Debt | (17) | 8/31/2015 | | 13.00% | | | | 12/31/2022 | 1,350 | | 1,350 | | 1,256 | |
| | | Preferred Member Units | | 3/15/2019 | 16,500 | | | | | | | 1,100 | | 80 | |
| | | Preferred Member Units | | 9/1/2015 | 1,000 | | | | | | | 1,500 | | — | |
| | | | | | | | | | | | | 3,950 | | 1,336 | |
| Mystic Logistics Holdings, LLC | | Logistics and Distribution Services Provider for Large Volume Mailers | | | | | | | | | | | | |
| | | Secured Debt | (37) | 8/18/2014 | | | | | | 1/31/2024 | — | | — | | — | |
| | | Secured Debt | | 8/18/2014 | | 10.00% | | | | 1/31/2024 | 1,436 | | 1,436 | | 1,436 | |
MSC INCOME FUND, INC.
Consolidated Schedule of Investments (Continued)
December 31, 2023
(dollars in thousands)
| | | | | | | | | | | | | | | | | | | | | | | | | | | | | | | | | | | | | | | | | | | | |
| Portfolio Company (1) (20) | | Business Description | Type of Investment (2) (3) (15) | | Investment Date (22) | Shares/Units | Total Rate | Reference Rate and Spread (25) | PIK Rate (19) | Maturity Date | Principal (4) | Cost (4) | Fair Value (18) |
| | | Common Stock | (8) | 8/18/2014 | 1,468 | | | | | | | 680 | | 6,598 | |
| | | | | | | | | | | | | 2,116 | | 8,034 | |
| NexRev LLC | | Provider of Energy Efficiency Products & Services | | | | | | | | | | | | |
| | | Secured Debt | (37) | 2/28/2018 | | | | | | 2/28/2025 | — | | — | | — | |
| | | Secured Debt | | 2/28/2018 | | 10.00% | | | | 2/28/2025 | 2,453 | | 2,435 | | 2,435 | |
| | | Preferred Member Units | (8) | 2/28/2018 | 25,786,046 | | | | | | | 2,053 | | 1,590 | |
| | | | | | | | | | | | | 4,488 | | 4,025 | |
| NuStep, LLC | | Designer, Manufacturer and Distributor of Fitness Equipment | | | | | | | | | | | | |
| | | Secured Debt | (9) | 1/31/2017 | | 11.98% | SF+ | 6.50% | | 1/31/2025 | 900 | | 899 | | 899 | |
| | | Secured Debt | | 1/31/2017 | | 12.00% | | | | 1/31/2025 | 4,610 | | 4,606 | | 4,606 | |
| | | Preferred Member Units | | 11/2/2022 | 515 | | | | | | | 515 | | 1,290 | |
| | | Preferred Member Units | | 1/31/2017 | 102 | | | | | | | 2,550 | | 2,310 | |
| | | | | | | | | | | | | 8,570 | | 9,105 | |
| Oneliance, LLC | | Construction Cleaning Company | | | | | | | | | | | | |
| | | Secured Debt | (9) | 8/6/2021 | | 16.48% | SF+ | 11.00% | | 8/6/2026 | 1,360 | | 1,346 | | 1,339 | |
| | | Preferred Stock | | 8/6/2021 | 282 | | | | | | | 282 | | 282 | |
| | | | | | | | | | | | | 1,628 | | 1,621 | |
| Orttech Holdings, LLC | | Distributor of Industrial Clutches, Brakes and Other Components | | | | | | | | | | | | |
| | | Secured Debt | (9) (37) | 7/30/2021 | | | SF+ | 11.00% | | 7/31/2026 | — | | (2) | | — | |
| | | Secured Debt | (9) | 7/30/2021 | | 16.48% | SF+ | 11.00% | | 7/31/2026 | 5,510 | | 5,452 | | 5,510 | |
| | | Preferred Stock | (8) (23) | 7/30/2021 | 2,500 | | | | | | | 2,500 | | 4,260 | |
| | | | | | | | | | | | | 7,950 | | 9,770 | |
| Pinnacle TopCo, LLC | | Manufacturer and Distributor of Garbage Can Liners, Poly Bags, Produce Bags, and Other Similar Products | | | | | | | | | | | | |
| | | Secured Debt | | 12/21/2023 | | 8.00% | | | | 12/31/2028 | 115 | | 105 | | 105 | |
| | | Secured Debt | | 12/21/2023 | | 13.00% | | | | 12/31/2028 | 7,660 | | 7,472 | | 7,472 | |
| | | Preferred Equity | | 12/21/2023 | 110 | | | | | | | 3,135 | | 3,135 | |
| | | | | | | | | | | | | 10,712 | | 10,712 | |
| Robbins Bros. Jewelry, Inc. | | Bridal Jewelry Retailer | | | | | | | | | | | | |
| | | Secured Debt | (37) | 12/15/2021 | | | | | | 12/15/2026 | — | | (6) | | (6) | |
| | | Secured Debt | | 12/15/2021 | | 12.50% | | | | 12/15/2026 | 3,790 | | 3,745 | | 3,421 | |
| | | Preferred Equity | | 12/15/2021 | 1,230 | | | | | | | 1,230 | | — | |
| | | | | | | | | | | | | 4,969 | | 3,415 | |
| SI East, LLC | | Rigid Industrial Packaging Manufacturing | | | | | | | | | | | | |
| | | Secured Debt | | 8/31/2018 | | 11.25% | | | | 6/16/2028 | 375 | | 370 | | 375 | |
| | | Secured Debt | | 6/16/2023 | | 12.47% | | | | 6/16/2028 | 18,179 | | 18,019 | | 18,179 | |
| | | Preferred Member Units | (8) | 8/31/2018 | 55 | | | | | | | 508 | | 6,390 | |
MSC INCOME FUND, INC.
Consolidated Schedule of Investments (Continued)
December 31, 2023
(dollars in thousands)
| | | | | | | | | | | | | | | | | | | | | | | | | | | | | | | | | | | | | | | | | | | | |
| Portfolio Company (1) (20) | | Business Description | Type of Investment (2) (3) (15) | | Investment Date (22) | Shares/Units | Total Rate | Reference Rate and Spread (25) | PIK Rate (19) | Maturity Date | Principal (4) | Cost (4) | Fair Value (18) |
| | | | | | | | | | | | | 18,897 | | 24,944 | |
| Student Resource Center, LLC | (10) | Higher Education Services | | | | | | | | | | | | |
| | | Secured Debt | (14) | 12/31/2022 | | 8.50% | | | 8.50% | 12/31/2027 | 5,918 | | 5,426 | | 3,543 | |
| | | Preferred Equity | | 12/31/2022 | 6,564,055 | | | | | | | — | | — | |
| | | | | | | | | | | | | 5,426 | | 3,543 | |
| Tedder Industries, LLC | | Manufacturer of Firearm Holsters and Accessories | | | | | | | | | | | | |
| | | Secured Debt | (17) | 8/31/2018 | | 12.00% | | | | 8/31/2023 | 460 | | 460 | | 432 | |
| | | Secured Debt | (17) | 8/31/2018 | | 12.00% | | | | 8/31/2023 | 3,800 | | 3,800 | | 3,565 | |
| | | Preferred Member Units | | 8/28/2023 | 1,651 | | | | | | | 165 | | — | |
| | | Preferred Member Units | | 2/1/2023 | 1,411 | | | | | | | 141 | | — | |
| | | Preferred Member Units | | 8/31/2018 | 136 | | | | | | | 2,311 | | — | |
| | | | | | | | | | | | | 6,877 | | 3,997 | |
| Trantech Radiator Topco, LLC | | Transformer Cooling Products and Services | | | | | | | | | | | | |
| | | Secured Debt | (37) | 5/31/2019 | | | | | | 5/31/2024 | — | | (1) | | — | |
| | | Secured Debt | | 5/31/2019 | | 12.00% | | | | 5/31/2024 | 1,980 | | 1,975 | | 1,980 | |
| | | Common Stock | (8) | 5/31/2019 | 154 | | | | | | | 1,164 | | 3,180 | |
| | | | | | | | | | | | | 3,138 | | 5,160 | |
| VVS Holdco LLC | | Omnichannel Retailer of Animal Health Products | | | | | | | | | | | | |
| | | Secured Debt | (9) (17) (37) | 12/1/2021 | | | SF+ | 6.00% | | 12/1/2023 | — | | — | | — | |
| | | Secured Debt | | 12/1/2021 | | 11.50% | | | | 12/1/2026 | 7,050 | | 6,926 | | 6,926 | |
| | | Preferred Equity | (8) (23) | 12/1/2021 | 3,060 | | | | | | | 3,060 | | 3,060 | |
| | | | | | | | | | | | | 9,986 | | 9,986 | |
Subtotal Affiliate Investments (46.8% of net assets at fair value) | | | | | | | | | | | | | $ | 231,378 | | $ | 291,279 | |
| Non-Control/Non-Affiliate Investments (7) | | | | | | | | | | | | | | |
| AAC Holdings, Inc. | (11) | Substance Abuse Treatment Service Provider | | | | | | | | | | | | |
| | | Secured Debt | | 1/31/2023 | | 18.00% | | | 18.00% | 6/25/2025 | $ | 151 | | $ | 149 | | $ | 149 | |
| | | Secured Debt | | 12/11/2020 | | 18.00% | | | 18.00% | 6/25/2025 | 5,014 | | 4,888 | | 4,958 | |
| | | Common Stock | | 12/11/2020 | 593,927 | | | | | | | 3,148 | | — | |
| | | Warrants | (27) | 12/11/2020 | 197,717 | | | | | 12/11/2025 | | — | | — | |
| | | | | | | | | | | | | 8,185 | | 5,107 | |
| AB Centers Acquisition Corporation | (10) | Applied Behavior Analysis Therapy Provider | | | | | | | | | | | | |
| | | Secured Debt | (9) (37) | 9/6/2022 | | | P+ | 5.00% | | 9/6/2028 | — | | (20) | | — | |
| | | Secured Debt | (9) | 9/6/2022 | | 11.43% | SF+ | 6.00% | | 9/6/2028 | 1,081 | | 1,066 | | 1,081 | |
| | | Secured Debt | (9) | 9/6/2022 | | 11.43% | SF+ | 6.00% | | 9/6/2028 | 2,304 | | 2,219 | | 2,304 | |
| | | Secured Debt | (9) | 6/21/2023 | | 11.43% | SF+ | 6.00% | | 9/6/2028 | 772 | | 743 | | 772 | |
| | | | | | | | | | | | | 4,008 | | 4,157 | |
| Acumera, Inc. | (10) | Managed Security Service Provider | | | | | | | | | | | | |
| | | Secured Debt | (9) (37) | 6/7/2023 | | | SF+ | 7.50% | | 6/7/2028 | — | | (8) | | (8) | |
| | | Secured Debt | (9) | 6/7/2023 | | 12.98% | SF+ | 7.50% | | 6/7/2028 | 11,922 | | 11,825 | | 11,922 | |
MSC INCOME FUND, INC.
Consolidated Schedule of Investments (Continued)
December 31, 2023
(dollars in thousands)
| | | | | | | | | | | | | | | | | | | | | | | | | | | | | | | | | | | | | | | | | | | | |
| Portfolio Company (1) (20) | | Business Description | Type of Investment (2) (3) (15) | | Investment Date (22) | Shares/Units | Total Rate | Reference Rate and Spread (25) | PIK Rate (19) | Maturity Date | Principal (4) | Cost (4) | Fair Value (18) |
| | | Warrants | (40) | 6/7/2023 | 14,953 | | | | | 5/19/2028 | | — | | 90 | |
| | | | | | | | | | | | | 11,817 | | 12,004 | |
| Adams Publishing Group, LLC | (10) | Local Newspaper Operator | | | | | | | | | | | | |
| | | Secured Debt | (9) (36) | 3/11/2022 | | 11.00% | SF+ | 7.00% | 1.00% | 3/11/2027 | 936 | | 936 | | 917 | |
| | | Secured Debt | (9) (36) | 3/11/2022 | | 11.00% | SF+ | 7.00% | 1.00% | 3/11/2027 | 2,531 | | 2,527 | | 2,481 | |
| | | | | | | | | | | | | 3,463 | | 3,398 | |
| ADS Tactical, Inc. | (11) | Value-Added Logistics and Supply Chain Provider to the Defense Industry | | | | | | | | | | | | |
| | | Secured Debt | (9) | 3/29/2021 | | 11.22% | SF+ | 5.75% | | 3/19/2026 | 4,250 | | 4,210 | | 4,214 | |
| | | | | | | | | | | | | | |
| AMEREQUIP LLC | (10) | Full Services Provider Including Design, Engineering and Manufacturing of Commercial and Agricultural Equipment | | | | | | | | | | | | |
| | | Secured Debt | (9) (37) | 8/31/2022 | | | SF+ | 7.40% | | 8/31/2027 | — | | — | | — | |
| | | Secured Debt | (9) | 8/31/2022 | | 12.76% | SF+ | 7.40% | | 8/31/2027 | 1,538 | | 1,538 | | 1,538 | |
| | | Common Stock | (8) | 8/31/2022 | 11 | | | | | | | 83 | | 100 | |
| | | | | | | | | | | | | 1,621 | | 1,638 | |
| American Health Staffing Group, Inc. | (10) | Healthcare Temporary Staffing | | | | | | | | | | | | |
| | | Secured Debt | (9) (37) | 11/19/2021 | | | P+ | 5.00% | | 11/19/2026 | — | | (10) | | (10) | |
| | | Secured Debt | (9) | 11/19/2021 | | 13.50% | P+ | 5.00% | | 11/19/2026 | 8,188 | | 8,140 | | 8,188 | |
| | | | | | | | | | | | | 8,130 | | 8,178 | |
| American Nuts, LLC | (10) | Roaster, Mixer and Packager of Bulk Nuts and Seeds | | | | | | | | | | | | |
| | | Secured Debt | (9) | 3/11/2022 | | 15.29% | SF+ | 9.75% | 15.29% | 4/10/2026 | 4,833 | | 4,812 | | 4,102 | |
| | | Secured Debt | (9) | 3/11/2022 | | 15.29% | SF+ | 9.75% | 15.29% | 4/10/2026 | — | | — | | — | |
| | | Secured Debt | (9) (14) | 3/11/2022 | | 17.29% | SF+ | 11.75% | 17.29% | 4/10/2026 | 4,270 | | 4,244 | | 2,522 | |
| | | Secured Debt | (9) (14) | 3/11/2022 | | 17.29% | SF+ | 11.75% | 17.29% | 4/10/2026 | — | | — | | — | |
| | | | | | | | | | | | | 9,056 | | 6,624 | |
| American Teleconferencing Services, Ltd. | (11) | Provider of Audio Conferencing and Video Collaboration Solutions | | | | | | | | | | | | |
| | | Secured Debt | (14) (17) | 9/17/2021 | | | | | | 4/7/2023 | 2,425 | | 2,375 | | 109 | |
| | | Secured Debt | (14) (17) | 5/19/2016 | | | | | | 6/8/2023 | 11,693 | | 11,451 | | 526 | |
| | | | | | | | | | | | | 13,826 | | 635 | |
| ArborWorks, LLC | (10) | Vegetation Management Services | | | | | | | | | | | | |
| | | Secured Debt | | 11/6/2023 | | 15.00% | | | 15.00% | 11/6/2028 | 1,007 | | 1,007 | | 1,007 | |
| | | Secured Debt | (9) | 11/6/2023 | | 12.04% | SF+ | 6.50% | 12.04% | 11/6/2028 | 3,765 | | 3,765 | | 3,765 | |
| | | Preferred Equity | | 11/6/2023 | 17,265 | | | | | | | 7,468 | | 7,468 | |
| | | Preferred Equity | | 11/6/2023 | 17,265 | | | | | | | — | | — | |
| | | Common Equity | | 11/9/2021 | 2,070 | | | | | | | 124 | | — | |
| | | | | | | | | | | | | 12,364 | | 12,240 | |
MSC INCOME FUND, INC.
Consolidated Schedule of Investments (Continued)
December 31, 2023
(dollars in thousands)
| | | | | | | | | | | | | | | | | | | | | | | | | | | | | | | | | | | | | | | | | | | | |
| Portfolio Company (1) (20) | | Business Description | Type of Investment (2) (3) (15) | | Investment Date (22) | Shares/Units | Total Rate | Reference Rate and Spread (25) | PIK Rate (19) | Maturity Date | Principal (4) | Cost (4) | Fair Value (18) |
| Archer Systems, LLC | (10) | Mass Tort Settlement Administration Solutions Provider | | | | | | | | | | | | |
| | | Common Stock | | 8/11/2022 | 62,402 | | | | | | | 62 | | 100 | |
| | | | | | | | | | | | | | |
| ATS Operating, LLC | (10) | For-Profit Thrift Retailer | | | | | | | | | | | | |
| | | Secured Debt | (9) | 1/18/2022 | | 12.16% | SF+ | 6.50% | | 1/18/2027 | 50 | | 50 | | 50 | |
| | | Secured Debt | (9) | 1/18/2022 | | 11.16% | SF+ | 5.50% | | 1/18/2027 | 925 | | 911 | | 925 | |
| | | Secured Debt | (9) | 1/18/2022 | | 13.16% | SF+ | 7.50% | | 1/18/2027 | 925 | | 911 | | 925 | |
| | | Common Stock | | 1/18/2022 | 100,000 | | | | | | | 100 | | 90 | |
| | | | | | | | | | | | | 1,972 | | 1,990 | |
| AVEX Aviation Holdings, LLC | (10) | Specialty Aircraft Dealer & MRO Provider | | | | | | | | | | | | |
| | | Secured Debt | (9) (37) | 12/23/2022 | | | SF+ | 7.25% | | 12/23/2027 | — | | (17) | | (5) | |
| | | Secured Debt | (9) | 12/23/2022 | | 12.76% | SF+ | 7.25% | | 12/23/2027 | 3,417 | | 3,321 | | 3,344 | |
| | | Common Equity | (8) | 12/15/2021 | 137 | | | | | | | 134 | | 124 | |
| | | | | | | | | | | | | 3,438 | | 3,463 | |
| Berry Aviation, Inc. | (10) | Charter Airline Services | | | | | | | | | | | | |
| | | Preferred Member Units | (23) | 11/12/2019 | 122,416 | | | | | | | — | | 200 | |
| | | Preferred Member Units | (8) (23) | 7/6/2018 | 1,548,387 | | | | | | | — | | 2,560 | |
| | | | | | | | | | | | | — | | 2,760 | |
| Bettercloud, Inc. | (10) | SaaS Provider of Workflow Management and Business Application Solutions | | | | | | | | | | | | |
| | | Secured Debt | (9) (37) | 6/30/2022 | | | SF+ | 7.25% | | 6/30/2028 | — | | (18) | | (18) | |
| | | Secured Debt | (9) | 6/30/2022 | | 12.64% | SF+ | 7.25% | 6.25% | 6/30/2028 | 8,535 | | 8,419 | | 7,998 | |
| | | | | | | | | | | | | 8,401 | | 7,980 | |
| Binswanger Enterprises, LLC | (10) | Glass Repair and Installation Service Provider | | | | | | | | | | | | |
| | | Member Units | | 3/10/2017 | 1,050,000 | | | | | | | 1,050 | | 120 | |
| | | | | | | | | | | | | | |
| Bluestem Brands, Inc. | (11) | Multi-Channel Retailer of General Merchandise | | | | | | | | | | | | |
| | | Secured Debt | (9) | 10/19/2022 | | 16.00% | P+ | 7.50% | 15.00% | 8/28/2025 | 2,035 | | 2,035 | | 1,907 | |
| | | Secured Debt | (9) | 8/28/2020 | | 13.96% | SF+ | 8.50% | 12.96% | 8/28/2025 | 3,941 | | 3,305 | | 3,695 | |
| | | Common Stock | | 10/1/2020 | 700,446 | | | | | | | — | | 533 | |
| | | Warrants | (27) | 10/19/2022 | 175,110 | | | | | 10/19/2032 | | 1,111 | | 129 | |
| | | | | | | | | | | | | 6,451 | | 6,264 | |
| Boccella Precast Products LLC | | Manufacturer of Precast Hollow Core Concrete | | | | | | | | | | | | |
| | | Secured Debt | | 9/23/2021 | | 10.00% | | | | 2/28/2027 | 80 | | 80 | | 80 | |
| | | Member Units | | 6/30/2017 | 540,000 | | | | | | | 564 | | 498 | |
| | | | | | | | | | | | | 644 | | 578 | |
| Bond Brand Loyalty ULC | (10) (13) (21) | Provider of Loyalty Marketing Services | | | | | | | | | | | | |
| | | Secured Debt | (9) (37) | 5/1/2023 | | | SF+ | 7.00% | | 5/1/2028 | — | | (16) | | (16) | |
| | | Secured Debt | (9) | 5/1/2023 | | 11.54% | SF+ | 6.00% | | 5/1/2028 | 4,040 | | 3,970 | | 4,040 | |
MSC INCOME FUND, INC.
Consolidated Schedule of Investments (Continued)
December 31, 2023
(dollars in thousands)
| | | | | | | | | | | | | | | | | | | | | | | | | | | | | | | | | | | | | | | | | | | | |
| Portfolio Company (1) (20) | | Business Description | Type of Investment (2) (3) (15) | | Investment Date (22) | Shares/Units | Total Rate | Reference Rate and Spread (25) | PIK Rate (19) | Maturity Date | Principal (4) | Cost (4) | Fair Value (18) |
| | | Secured Debt | (9) | 5/1/2023 | | 13.54% | SF+ | 8.00% | | 5/1/2028 | 4,040 | | 3,970 | | 4,040 | |
| | | Preferred Equity | | 5/1/2023 | 360 | | | | | | | 360 | | 310 | |
| | | Common Equity | | 5/1/2023 | 360 | | | | | | | — | | — | |
| | | | | | | | | | | | | 8,284 | | 8,374 | |
| Brightwood Capital Fund Investments | (12) (13) | Investment Partnership | | | | | | | | | | | | |
| | | LP Interests (Brightwood Capital Fund III, LP) | (24) | 7/21/2014 | 0.5% | | | | | | 2,270 | | 2,270 | | 1,360 | |
| | | LP Interests (Brightwood Capital Fund IV, LP) | (8) (24) | 10/26/2016 | 1.2% | | | | | | 8,737 | | 8,737 | | 8,716 | |
| | | | | | | | | | | | | 11,007 | | 10,076 | |
| Buca C, LLC | | Casual Restaurant Group | | | | | | | | | | | | |
| | | Secured Debt | (17) | 6/30/2015 | | 12.00% | | | | 8/31/2023 | 11,490 | | 11,490 | | 8,218 | |
| | | Preferred Member Units | | 6/30/2015 | 4 | 6.00% | | | 6.00% | | | 3,040 | | — | |
| | | | | | | | | | | | | 14,530 | | 8,218 | |
| Burning Glass Intermediate Holding Company, Inc. | (10) | Provider of Skills-Based Labor Market Analytics | | | | | | | | | | | | |
| | | Secured Debt | (9) | 6/14/2021 | | 10.46% | SF+ | 5.00% | | 6/10/2026 | 310 | | 296 | | 310 | |
| | | Secured Debt | (9) | 6/14/2021 | | 10.46% | SF+ | 5.00% | | 6/10/2028 | 13,121 | | 12,970 | | 13,121 | |
| | | | | | | | | | | | | 13,266 | | 13,431 | |
| CAI Software LLC | | Provider of Specialized Enterprise Resource Planning Software | | | | | | | | | | | | |
| | | Preferred Equity | | 12/13/2021 | 379,338 | | | | | | | 379 | | 379 | |
| | | Preferred Equity | | 12/13/2021 | 126,446 | | | | | | | — | | — | |
| | | | | | | | | | | | | 379 | | 379 | |
| Career Team Holdings, LLC | | Provider of Workforce Training and Career Development Services | | | | | | | | | | | | |
| | | Secured Debt | (9) | 12/17/2021 | | 11.38% | SF+ | 6.00% | | 12/17/2026 | 100 | | 96 | | 96 | |
| | | Secured Debt | | 12/17/2021 | | 13.00% | | | | 12/17/2026 | 2,225 | | 2,185 | | 2,185 | |
| | | Common Stock | | 12/17/2021 | 50,000 | | | | | | | 500 | | 500 | |
| | | | | | | | | | | | | 2,781 | | 2,781 | |
| CaseWorthy, Inc. | (10) | SaaS Provider of Case Management Solutions | | | | | | | | | | | | |
| | | Secured Debt | (9) (37) | 5/18/2022 | | | SF+ | 6.00% | | 5/18/2027 | — | | (3) | | (3) | |
| | | Secured Debt | (9) | 5/18/2022 | | 11.61% | SF+ | 6.00% | | 5/18/2027 | 2,581 | | 2,561 | | 2,581 | |
| | | Secured Debt | (9) | 5/18/2022 | | 11.61% | SF+ | 6.00% | | 5/18/2027 | 1,985 | | 1,971 | | 1,985 | |
| | | Common Equity | | 12/30/2022 | 80,000 | | | | | | | 80 | | 80 | |
| | | | | | | | | | | | | 4,609 | | 4,643 | |
| Channel Partners Intermediateco, LLC | (10) | Outsourced Consumer Services Provider | | | | | | | | | | | | |
| | | Secured Debt | (9) (44) | 2/7/2022 | | 12.60% | SF+ | 7.00% | | 2/7/2027 | 190 | | 175 | | 183 | |
| | | Secured Debt | (9) | 2/7/2022 | | 12.66% | SF+ | 7.00% | | 2/7/2027 | 3,360 | | 3,317 | | 3,224 | |
| | | Secured Debt | (9) | 6/24/2022 | | 12.66% | SF+ | 7.00% | | 2/7/2027 | 186 | | 184 | | 179 | |
| | | Secured Debt | (9) | 3/27/2023 | | 12.66% | SF+ | 7.00% | | 2/7/2027 | 450 | | 440 | | 432 | |
MSC INCOME FUND, INC.
Consolidated Schedule of Investments (Continued)
December 31, 2023
(dollars in thousands)
| | | | | | | | | | | | | | | | | | | | | | | | | | | | | | | | | | | | | | | | | | | | |
| Portfolio Company (1) (20) | | Business Description | Type of Investment (2) (3) (15) | | Investment Date (22) | Shares/Units | Total Rate | Reference Rate and Spread (25) | PIK Rate (19) | Maturity Date | Principal (4) | Cost (4) | Fair Value (18) |
| | | | | | | | | | | | | 4,116 | | 4,018 | |
| Clarius BIGS, LLC | (10) | Prints & Advertising Film Financing | | | | | | | | | | | | |
| | | Secured Debt | (14) (17) | 9/23/2014 | | | | | | 1/5/2015 | 2,694 | | 2,350 | | 16 | |
| | | | | | | | | | | | | | |
| Classic H&G Holdings, LLC | | Provider of Engineered Packaging Solutions | | | | | | | | | | | | |
| | | Secured Debt | (9) | 3/12/2020 | | 11.69% | SF+ | 6.00% | | 3/12/2025 | 1,140 | | 1,133 | | 1,140 | |
| | | Secured Debt | | 3/12/2020 | | 8.00% | | | | 3/12/2025 | 4,819 | | 4,781 | | 4,819 | |
| | | Preferred Member Units | (8) | 3/12/2020 | 39 | | | | | | | 1,440 | | 4,000 | |
| | | | | | | | | | | | | 7,354 | | 9,959 | |
| Computer Data Source, LLC | (10) | Third Party Maintenance Provider to the Data Center Ecosystem | | | | | | | | | | | | |
| | | Secured Debt | (9) (30) | 8/6/2021 | | 13.52% | SF+ | 8.00% | | 8/6/2026 | 4,167 | | 4,123 | | 4,040 | |
| | | Secured Debt | (9) | 8/6/2021 | | 13.52% | SF+ | 8.00% | | 8/6/2026 | 15,260 | | 15,098 | | 14,797 | |
| | | | | | | | | | | | | 19,221 | | 18,837 | |
| Construction Supply Investments, LLC | (10) | Distribution Platform of Specialty Construction Materials to Professional Concrete and Masonry Contractors | | | | | | | | | | | | |
| | | Member Units | | 12/29/2016 | 861,618 | | | | | | | 3,335 | | 23,135 | |
| | | | | | | | | | | | | | |
| CQ Fluency, LLC | (10) | Global Language Services Provider | | | | | | | | | | | | |
| | | Secured Debt | (9) (37) | 12/27/2023 | | | SF+ | 7.00% | | 6/27/2027 | — | | (44) | | (44) | |
| | | Secured Debt | (9) (37) | 12/27/2023 | | | SF+ | 7.00% | | 6/27/2027 | — | | (44) | | (44) | |
| | | Secured Debt | (9) | 12/27/2023 | | 12.45% | SF+ | 7.00% | | 6/27/2027 | 7,500 | | 7,280 | | 7,280 | |
| | | | | | | | | | | | | 7,192 | | 7,192 | |
| Dalton US Inc. | (10) | Provider of Supplemental Labor Services | | | | | | | | | | | | |
| | | Common Stock | | 8/16/2022 | 37 | | | | | | | 52 | | 60 | |
| | | | | | | | | | | | | | |
| DMA Industries, LLC | | Distributor of Aftermarket Ride Control Products | | | | | | | | | | | | |
| | | Secured Debt | | 11/19/2021 | | 12.00% | | | | 11/19/2026 | 4,700 | | 4,642 | | 4,700 | |
| | | Preferred Equity | | 11/19/2021 | 1,486 | | | | | | | 1,486 | | 1,920 | |
| | | | | | | | | | | | | 6,128 | | 6,620 | |
| DTE Enterprises, LLC | (10) | Industrial Powertrain Repair and Services | | | | | | | | | | | | |
| | | Class AA Preferred Member Units (non-voting) | (8) | 4/13/2018 | | 10.00% | | | 10.00% | | | 1,284 | | 1,283 | |
| | | Class A Preferred Member Units | | 4/13/2018 | 776,316 | 8.00% | | | 8.00% | | | 776 | | 260 | |
| | | | | | | | | | | | | 2,060 | | 1,543 | |
MSC INCOME FUND, INC.
Consolidated Schedule of Investments (Continued)
December 31, 2023
(dollars in thousands)
| | | | | | | | | | | | | | | | | | | | | | | | | | | | | | | | | | | | | | | | | | | | |
| Portfolio Company (1) (20) | | Business Description | Type of Investment (2) (3) (15) | | Investment Date (22) | Shares/Units | Total Rate | Reference Rate and Spread (25) | PIK Rate (19) | Maturity Date | Principal (4) | Cost (4) | Fair Value (18) |
| Dynamic Communities, LLC | (10) | Developer of Business Events and Online Community Groups | | | | | | | | | | | | |
| | | Secured Debt | (9) | 12/20/2022 | | 10.45% | SF+ | 5.00% | 10.45% | 12/31/2026 | 2,070 | | 1,912 | | 1,912 | |
| | | Secured Debt | (9) | 12/20/2022 | | 12.45% | SF+ | 7.00% | 12.45% | 12/31/2026 | 2,113 | | 1,879 | | 1,859 | |
| | | Preferred Equity | | 12/20/2022 | 125,000 | | | | | | | 128 | | 60 | |
| | | Preferred Equity | | 12/20/2022 | 2,376,241 | | | | | | | — | | — | |
| | | Common Equity | | 12/20/2022 | 1,250,000 | | | | | | | — | | — | |
| | | | | | | | | | | | | 3,919 | | 3,831 | |
| Elgin AcquireCo, LLC | | Manufacturer and Distributor of Engine and Chassis Components | | | | | | | | | | | | |
| | | Secured Debt | (9) (37) | 10/3/2022 | | | SF+ | 6.00% | | 10/3/2027 | — | | — | | — | |
| | | Secured Debt | | 10/3/2022 | | 12.00% | | | | 10/3/2027 | 1,227 | | 1,200 | | 1,200 | |
| | | Secured Debt | | 10/3/2022 | | 9.00% | | | | 10/3/2052 | 412 | | 409 | | 409 | |
| | | Common Stock | | 10/3/2022 | 19 | | | | | | | 374 | | 390 | |
| | | Common Stock | (23) | 10/3/2022 | 61 | | | | | | | 102 | | 109 | |
| | | | | | | | | | | | | 2,085 | | 2,108 | |
| Emerald Technologies Acquisition Co, Inc. | (11) | Design & Manufacturing | | | | | | | | | | | | |
| | | Secured Debt | (9) | 2/10/2022 | | 11.79% | SF+ | 6.25% | | 12/29/2027 | 2,391 | | 2,357 | | 2,175 | |
| | | | | | | | | | | | | | |
| Engineering Research & Consulting, LLC | (10) | Provider of Engineering & Consulting Services to US Department of Defense | | | | | | | | | | | | |
| | | Secured Debt | (9) (37) | 5/23/2022 | | | P+ | 5.50% | | 5/23/2027 | — | | (11) | | — | |
| | | Secured Debt | (9) | 5/23/2022 | | 11.98% | SF+ | 6.50% | | 5/23/2028 | 5,095 | | 5,023 | | 5,095 | |
| | | | | | | | | | | | | 5,012 | | 5,095 | |
| Escalent, Inc. | (10) | Market Research and Consulting Firm | | | | | | | | | | | | |
| | | Secured Debt | (9) (37) | 4/7/2023 | | | SF+ | 8.00% | | 4/7/2029 | — | | (9) | | (9) | |
| | | Secured Debt | (9) | 4/7/2023 | | 13.45% | SF+ | 8.00% | | 4/7/2029 | 6,924 | | 6,742 | | 6,924 | |
| | | Common Equity | | 4/7/2023 | 170,998 | | | | | | | 174 | | 190 | |
| | | | | | | | | | | | | 6,907 | | 7,105 | |
| Event Holdco, LLC | (10) | Event and Learning Management Software for Healthcare Organizations and Systems | | | | | | | | | | | | |
| | | Secured Debt | (9) | 12/22/2021 | | 12.61% | SF+ | 7.00% | | 12/22/2026 | 308 | | 306 | | 302 | |
| | | Secured Debt | (9) | 12/22/2021 | | 12.61% | SF+ | 7.00% | | 12/22/2026 | 3,681 | | 3,659 | | 3,614 | |
| | | | | | | | | | | | | 3,965 | | 3,916 | |
| Garyline, LLC | (10) | Manufacturer of Consumer Plastic Products | | | | | | | | | | | | |
| | | Secured Debt | (9) (37) | 11/10/2023 | | | SF+ | 6.75% | | 11/10/2028 | — | | (76) | | (76) | |
| | | Secured Debt | (9) | 11/10/2023 | | 12.22% | SF+ | 6.75% | | 11/10/2028 | 9,664 | | 9,384 | | 9,384 | |
| | | Common Equity | | 11/10/2023 | 210,084 | | | | | | | 210 | | 210 | |
| | | | | | | | | | | | | 9,518 | | 9,518 | |
| Hawk Ridge Systems, LLC | | Value-Added Reseller of Engineering Design and Manufacturing Solutions | | | | | | | | | | | | |
MSC INCOME FUND, INC.
Consolidated Schedule of Investments (Continued)
December 31, 2023
(dollars in thousands)
| | | | | | | | | | | | | | | | | | | | | | | | | | | | | | | | | | | | | | | | | | | | |
| Portfolio Company (1) (20) | | Business Description | Type of Investment (2) (3) (15) | | Investment Date (22) | Shares/Units | Total Rate | Reference Rate and Spread (25) | PIK Rate (19) | Maturity Date | Principal (4) | Cost (4) | Fair Value (18) |
| | | Secured Debt | (9) | 12/2/2016 | | 11.65% | SF+ | 6.00% | | 1/15/2026 | 494 | | 492 | | 494 | |
| | | Secured Debt | | 12/2/2016 | | 12.50% | | | | 1/15/2026 | 9,744 | | 9,697 | | 9,744 | |
| | | Preferred Member Units | | 12/2/2016 | 56 | | | | | | | 713 | | 4,370 | |
| | | Preferred Member Units | (23) | 12/2/2016 | 56 | | | | | | | 38 | | 230 | |
| | | | | | | | | | | | | 10,940 | | 14,838 | |
| HDC/HW Intermediate Holdings | (10) | Managed Services and Hosting Provider | | | | | | | | | | | | |
| | | Secured Debt | (9) (17) | 12/21/2018 | | 14.34% | SF+ | 9.50% | 14.34% | 12/21/2023 | 205 | | 205 | | 186 | |
| | | Secured Debt | (9) (17) | 12/21/2018 | | 14.34% | SF+ | 9.50% | 14.34% | 12/21/2023 | 2,036 | | 2,036 | | 1,849 | |
| | | | | | | | | | | | | 2,241 | | 2,035 | |
| HEADLANDS OP-CO LLC | (10) | Clinical Trial Sites Operator | | | | | | | | | | | | |
| | | Secured Debt | (9) (37) | 8/1/2022 | | | SF+ | 6.50% | | 8/1/2027 | — | | (14) | | (14) | |
| | | Secured Debt | (9) | 8/1/2022 | | 11.86% | SF+ | 6.50% | | 8/1/2027 | 1,995 | | 1,962 | | 1,995 | |
| | | Secured Debt | (9) | 8/1/2022 | | 11.86% | SF+ | 6.50% | | 8/1/2027 | 4,925 | | 4,854 | | 4,925 | |
| | | | | | | | | | | | | 6,802 | | 6,906 | |
| Hybrid Promotions, LLC | (10) | Wholesaler of Licensed, Branded and Private Label Apparel | | | | | | | | | | | | |
| | | Secured Debt | (9) | 6/30/2021 | | 15.91% | SF+ | 8.25% | 2.00% | 6/30/2026 | 7,964 | | 7,813 | | 7,313 | |
| | | | | | | | | | | | | | |
| IG Parent Corporation | (11) | Software Engineering | | | | | | | | | | | | |
| | | Secured Debt | (9) (37) | 7/30/2021 | | | SF+ | 5.75% | | 7/30/2026 | — | | (13) | | — | |
| | | Secured Debt | (9) | 7/30/2021 | | 10.96% | SF+ | 5.50% | | 7/30/2028 | 6,266 | | 6,200 | | 6,266 | |
| | | Secured Debt | (9) | 7/30/2021 | | 10.96% | SF+ | 5.50% | | 7/30/2028 | 1,942 | | 1,921 | | 1,942 | |
| | | | | | | | | | | | | 8,108 | | 8,208 | |
| Imaging Business Machines, L.L.C. | (10) | Technology Hardware & Equipment | | | | | | | | | | | | |
| | | Secured Debt | (9) (29) | 6/8/2023 | | 12.41% | SF+ | 7.00% | | 6/30/2028 | 791 | | 791 | | 786 | |
| | | Secured Debt | (9) | 6/8/2023 | | 12.45% | SF+ | 7.00% | | 6/30/2028 | 10,384 | | 10,068 | | 10,318 | |
| | | Common Equity | | 6/8/2023 | 422 | | | | | | | 580 | | 550 | |
| | | | | | | | | | | | | 11,439 | | 11,654 | |
| Implus Footcare, LLC | (10) | Provider of Footwear and Related Accessories | | | | | | | | | | | | |
| | | Secured Debt | (9) | 6/1/2017 | | 14.25% | SF+ | 7.75% | 1.00% | 7/31/2024 | 17,012 | | 17,010 | | 15,816 | |
| | | | | | | | | | | | | | |
| Industrial Services Acquisition, LLC | (10) | Industrial Cleaning Services | | | | | | | | | | | | |
| | | Secured Debt | (9) (32) | 8/13/2021 | | 12.22% | SF+ | 6.75% | | 8/13/2026 | 752 | | 734 | | 752 | |
| | | Secured Debt | (9) | 8/13/2021 | | 12.22% | SF+ | 6.75% | | 8/13/2026 | 11,436 | | 11,330 | | 11,436 | |
| | | Preferred Member Units | (8) (23) | 1/31/2018 | 336 | 10.00% | | | 10.00% | | | 321 | | 415 | |
| | | Preferred Member Units | (8) (23) | 5/17/2019 | 187 | 20.00% | | | 20.00% | | | 240 | | 279 | |
| | | Member Units | (23) | 6/17/2016 | 2,100 | | | | | | | 2,100 | | 1,610 | |
| | | | | | | | | | | | | 14,725 | | 14,492 | |
| Infinity X1 Holdings, LLC | | Manufacturer and Supplier of Personal Lighting Products | | | | | | | | | | | | |
MSC INCOME FUND, INC.
Consolidated Schedule of Investments (Continued)
December 31, 2023
(dollars in thousands)
| | | | | | | | | | | | | | | | | | | | | | | | | | | | | | | | | | | | | | | | | | | | |
| Portfolio Company (1) (20) | | Business Description | Type of Investment (2) (3) (15) | | Investment Date (22) | Shares/Units | Total Rate | Reference Rate and Spread (25) | PIK Rate (19) | Maturity Date | Principal (4) | Cost (4) | Fair Value (18) |
| | | Secured Debt | | 3/31/2023 | | 13.00% | | | | 3/31/2028 | 4,388 | | 4,314 | | 4,314 | |
| | | Preferred Equity | | 3/31/2023 | 20,000 | | | | | | | 1,000 | | 1,000 | |
| | | | | | | | | | | | | 5,314 | | 5,314 | |
| Infolinks Media Buyco, LLC | (10) | Exclusive Placement Provider to the Advertising Ecosystem | | | | | | | | | | | | |
| | | Secured Debt | (9) | 11/1/2021 | | 11.21% | SF+ | 5.75% | | 11/1/2026 | 1,881 | | 1,829 | | 1,881 | |
| | | Secured Debt | (9) | 11/1/2021 | | 11.21% | SF+ | 5.75% | | 11/1/2026 | 9,690 | | 9,579 | | 9,690 | |
| | | | | | | | | | | | | 11,408 | | 11,571 | |
| Insight Borrower Corporation | (10) | Test, Inspection, and Certification Instrument Provider | | | | | | | | | | | | |
| | | Secured Debt | (9) (37) | 7/19/2023 | | | SF+ | 6.25% | | 7/19/2028 | — | | (40) | | (40) | |
| | | Secured Debt | (9) (37) | 7/19/2023 | | | SF+ | 6.25% | | 7/19/2029 | — | | (33) | | (33) | |
| | | Secured Debt | (9) | 7/19/2023 | | 11.65% | SF+ | 6.25% | | 7/19/2029 | 8,373 | | 8,143 | | 8,287 | |
| | | Common Equity | | 7/19/2023 | 47,847 | | | | | | | 239 | | 239 | |
| | | | | | | | | | | | | 8,309 | | 8,453 | |
| Inspire Aesthetics Management, LLC | (10) | Surgical and Non-Surgical Plastic Surgery and Aesthetics Provider | | | | | | | | | | | | |
| | | Secured Debt | (9) (31) | 4/3/2023 | | 13.53% | SF+ | 8.00% | | 4/3/2028 | 676 | | 659 | | 664 | |
| | | Secured Debt | (9) | 4/3/2023 | | 13.55% | SF+ | 8.00% | | 4/3/2028 | 6,256 | | 6,115 | | 6,144 | |
| | | Secured Debt | (9) | 6/14/2023 | | 13.55% | SF+ | 8.00% | | 4/3/2028 | 1,260 | | 1,231 | | 1,237 | |
| | | Common Equity | | 4/3/2023 | 101,719 | | | | | | | 322 | | 190 | |
| | | | | | | | | | | | | 8,327 | | 8,235 | |
| Interface Security Systems, L.L.C | (10) | Commercial Security & Alarm Services | | | | | | | | | | | | |
| | | Secured Debt | (17) (28) | 12/9/2021 | | 15.48% | SF+ | 10.00% | | 8/7/2023 | 1,835 | | 1,835 | | 1,781 | |
| | | Secured Debt | (9) (14) (17) | 8/7/2019 | | 12.46% | SF+ | 7.00% | 12.46% | 8/7/2023 | 7,334 | | 7,254 | | 433 | |
| | | Common Stock | | 12/7/2021 | 2,143 | | | | | | | — | | — | |
| | | | | | | | | | | | | 9,089 | | 2,214 | |
| Intermedia Holdings, Inc. | (11) | Unified Communications as a Service | | | | | | | | | | | | |
| | | Secured Debt | (9) | 8/3/2018 | | 11.47% | SF+ | 6.00% | | 7/19/2025 | 5,544 | | 5,539 | | 5,370 | |
| | | | | | | | | | | | | | |
| Invincible Boat Company, LLC. | (10) | Manufacturer of Sport Fishing Boats | | | | | | | | | | | | |
| | | Secured Debt | (9) | 8/28/2019 | | 12.00% | SF+ | 6.50% | | 8/28/2025 | 519 | | 516 | | 509 | |
| | | Secured Debt | (9) | 8/28/2019 | | 12.00% | SF+ | 6.50% | | 8/28/2025 | 16,812 | | 16,751 | | 16,515 | |
| | | | | | | | | | | | | 17,267 | | 17,024 | |
| INW Manufacturing, LLC | (11) | Manufacturer of Nutrition and Wellness Products | | | | | | | | | | | | |
| | | Secured Debt | (9) | 5/19/2021 | | 11.36% | SF+ | 5.75% | | 3/25/2027 | 6,656 | | 6,537 | | 5,325 | |
| | | | | | | | | | | | | | |
| Iron-Main Investments, LLC | | Consumer Reporting Agency Providing Employment Background Checks and Drug Testing | | | | | | | | | | | | |
MSC INCOME FUND, INC.
Consolidated Schedule of Investments (Continued)
December 31, 2023
(dollars in thousands)
| | | | | | | | | | | | | | | | | | | | | | | | | | | | | | | | | | | | | | | | | | | | |
| Portfolio Company (1) (20) | | Business Description | Type of Investment (2) (3) (15) | | Investment Date (22) | Shares/Units | Total Rate | Reference Rate and Spread (25) | PIK Rate (19) | Maturity Date | Principal (4) | Cost (4) | Fair Value (18) |
| | | Secured Debt | | 8/2/2021 | | 13.50% | | | | 1/31/2028 | 1,128 | | 1,108 | | 1,108 | |
| | | Secured Debt | | 9/1/2021 | | 13.50% | | | | 1/31/2028 | 735 | | 722 | | 722 | |
| | | Secured Debt | | 11/15/2021 | | 13.50% | | | | 1/31/2028 | 2,236 | | 2,236 | | 2,236 | |
| | | Secured Debt | | 11/15/2021 | | 13.50% | | | | 1/31/2028 | 4,906 | | 4,815 | | 4,815 | |
| | | Secured Debt | | 1/31/2023 | | 13.50% | | | | 1/31/2028 | 2,641 | | 2,525 | | 2,525 | |
| | | Common Stock | | 8/3/2021 | 50,753 | | | | | | | 689 | | 670 | |
| | | | | | | | | | | | | 12,095 | | 12,076 | |
| Isagenix International, LLC | (11) | Direct Marketer of Health & Wellness Products | | | | | | | | | | | | |
| | | Secured Debt | (9) | 4/13/2023 | | 11.04% | SF+ | 5.50% | 8.54% | 4/14/2028 | 2,615 | | 2,374 | | 2,301 | |
| | | Common Equity | | 4/13/2023 | 186,322 | | | | | | | — | | — | |
| | | | | | | | | | | | | 2,374 | | 2,301 | |
| ITA Holdings Group, LLC | | Air Ambulance Services | | | | | | | | | | | | |
| | | Secured Debt | (9) | 6/21/2023 | | 16.59% | SF+ | 9.00% | 2.00% | 6/21/2027 | 207 | | 201 | | 201 | |
| | | Secured Debt | (9) | 6/21/2023 | | 16.59% | SF+ | 9.00% | 2.00% | 6/21/2027 | 178 | | 174 | | 174 | |
| | | Secured Debt | (9) | 6/21/2023 | | 15.59% | SF+ | 8.00% | 2.00% | 6/21/2027 | 1,084 | | 842 | | 842 | |
| | | Secured Debt | (9) | 6/21/2023 | | 17.59% | SF+ | 10.00% | 2.00% | 6/21/2027 | 1,091 | | 848 | | 848 | |
| | | Warrants | (27) | 6/21/2023 | 48,327 | | | | | 6/21/2033 | | 523 | | 523 | |
| | | | | | | | | | | | | 2,588 | | 2,588 | |
| Jackmont Hospitality, Inc. | (10) | Franchisee of Casual Dining Restaurants | | | | | | | | | | | | |
| | | Secured Debt | (9) (26) | 10/26/2022 | | 12.46% | SF+ | 7.00% | | 11/4/2024 | 1,675 | | 1,649 | | 1,675 | |
| | | Secured Debt | (9) | 11/8/2021 | | 12.46% | SF+ | 7.00% | | 11/4/2024 | 3,948 | | 3,948 | | 3,948 | |
| | | Preferred Equity | | 11/8/2021 | 5,653,333 | | | | | | | 216 | | 2,190 | |
| | | | | | | | | | | | | 5,813 | | 7,813 | |
| Joerns Healthcare, LLC | (11) | Manufacturer and Distributor of Health Care Equipment & Supplies | | | | | | | | | | | | |
| | | Secured Debt | (9) (14) | 11/15/2021 | | 23.63% | SF+ | 18.00% | 23.63% | 1/31/2024 | 2,048 | | 2,048 | | 1,747 | |
| | | Secured Debt | (9) (14) | 8/21/2019 | | 21.63% | SF+ | 16.00% | 21.63% | 8/21/2024 | 1,708 | | 1,701 | | 121 | |
| | | Secured Debt | (9) (14) | 8/21/2019 | | 21.63% | SF+ | 16.00% | 21.63% | 8/21/2024 | 1,643 | | 1,635 | | 117 | |
| | | Common Stock | | 8/21/2019 | 392,514 | | | | | | | 3,678 | | — | |
| | | | | | | | | | | | | 9,062 | | 1,985 | |
| Johnson Downie Opco, LLC | | Executive Search Services | | | | | | | | | | | | |
| | | Secured Debt | (37) | 12/10/2021 | | | | | | 12/10/2026 | — | | (4) | | — | |
| | | Secured Debt | | 12/10/2021 | | 15.00% | | | | 12/10/2026 | 2,690 | | 2,645 | | 2,690 | |
| | | Preferred Equity | | 12/10/2021 | 368 | | | | | | | 404 | | 1,070 | |
| | | | | | | | | | | | | 3,045 | | 3,760 | |
| JorVet Holdings, LLC | | Supplier and Distributor of Veterinary Equipment and Supplies | | | | | | | | | | | | |
| | | Secured Debt | | 3/28/2022 | | 12.00% | | | | 3/28/2027 | 2,850 | | 2,814 | | 2,814 | |
| | | Preferred Equity | (8) | 3/28/2022 | 11,934 | | | | | | | 1,193 | | 1,193 | |
| | | | | | | | | | | | | 4,007 | | 4,007 | |
| JTI Electrical & Mechanical, LLC | (10) | Electrical, Mechanical and Automation Services | | | | | | | | | | | | |
| | | Secured Debt | (9) (41) | 12/22/2021 | | 11.64% | SF+ | 6.00% | | 12/22/2026 | 261 | | 253 | | 261 | |
| | | Secured Debt | (9) | 12/22/2021 | | 11.61% | SF+ | 6.00% | | 12/22/2026 | 3,000 | | 2,963 | | 3,000 | |
MSC INCOME FUND, INC.
Consolidated Schedule of Investments (Continued)
December 31, 2023
(dollars in thousands)
| | | | | | | | | | | | | | | | | | | | | | | | | | | | | | | | | | | | | | | | | | | | |
| Portfolio Company (1) (20) | | Business Description | Type of Investment (2) (3) (15) | | Investment Date (22) | Shares/Units | Total Rate | Reference Rate and Spread (25) | PIK Rate (19) | Maturity Date | Principal (4) | Cost (4) | Fair Value (18) |
| | | Common Equity | | 12/22/2021 | 140,351 | | | | | | | 140 | | 140 | |
| | | | | | | | | | | | | 3,356 | | 3,401 | |
| KMS, LLC | (10) | Wholesaler of Closeout and Value-priced Products | | | | | | | | | | | | |
| | | Secured Debt | (9) | 10/4/2021 | | 14.75% | SF+ | 9.25% | | 10/4/2026 | 1,292 | | 1,235 | | 1,180 | |
| | | Secured Debt | (9) | 10/4/2021 | | 14.75% | SF+ | 9.25% | | 10/4/2026 | 9,310 | | 9,205 | | 8,475 | |
| | | | | | | | | | | | | 10,440 | | 9,655 | |
| Lightbox Holdings, L.P. | (11) | Provider of Commercial Real Estate Software | | | | | | | | | | | | |
| | | Secured Debt | | 5/9/2019 | | 10.62% | SF+ | 5.00% | | 5/9/2026 | 5,765 | | 5,736 | | 5,592 | |
| | | | | | | | | | | | | | |
| LL Management, Inc. | (10) | Medical Transportation Service Provider | | | | | | | | | | | | |
| | | Secured Debt | (9) | 5/2/2019 | | 12.71% | SF+ | 7.25% | | 9/25/2024 | 7,960 | | 7,933 | | 7,960 | |
| | | Secured Debt | (9) | 5/2/2019 | | 12.71% | SF+ | 7.25% | | 9/25/2024 | 5,246 | | 5,228 | | 5,246 | |
| | | Secured Debt | (9) | 11/20/2020 | | 12.71% | SF+ | 7.25% | | 9/25/2024 | — | | — | | — | |
| | | Secured Debt | (9) | 2/26/2021 | | 12.71% | SF+ | 7.25% | | 9/25/2024 | 871 | | 868 | | 871 | |
| | | Secured Debt | (9) | 5/12/2022 | | 12.71% | SF+ | 7.25% | | 9/25/2024 | 8,822 | | 8,781 | | 8,822 | |
| | | | | | | | | | | | | 22,810 | | 22,899 | |
| LLFlex, LLC | (10) | Provider of Metal-Based Laminates | | | | | | | | | | | | |
| | | Secured Debt | (9) | 8/16/2021 | | 15.54% | SF+ | 9.00% | 1.00% | 8/16/2026 | 4,920 | | 4,861 | | 4,417 | |
| | | | | | | | | | | | | | |
| Logix Acquisition Company, LLC | (10) | Competitive Local Exchange Carrier | | | | | | | | | | | | |
| | | Secured Debt | (9) | 1/8/2018 | | 13.25% | P+ | 4.75% | | 12/22/2024 | 11,552 | | 11,285 | | 9,069 | |
| | | | | | | | | | | | | | |
| Mako Steel, LP | (10) | Self-Storage Design & Construction | | | | | | | | | | | | |
| | | Secured Debt | (9) (37) | 3/15/2021 | | | SF+ | 6.75% | | 3/15/2026 | — | | (36) | | — | |
| | | Secured Debt | (9) | 3/15/2021 | | 12.28% | SF+ | 6.75% | | 3/15/2026 | 16,721 | | 16,568 | | 16,721 | |
| | | | | | | | | | | | | 16,532 | | 16,721 | |
| MB2 Dental Solutions, LLC | (11) | Dental Partnership Organization | | | | | | | | | | | | |
| | | Secured Debt | (9) | 1/28/2021 | | 11.46% | SF+ | 6.00% | | 1/29/2027 | 2,803 | | 2,771 | | 2,803 | |
| | | Secured Debt | (9) | 1/28/2021 | | 11.46% | SF+ | 6.00% | | 1/29/2027 | 3,925 | | 3,880 | | 3,925 | |
| | | Secured Debt | (9) | 1/28/2021 | | 11.46% | SF+ | 6.00% | | 1/29/2027 | 3,464 | | 3,424 | | 3,464 | |
| | | Secured Debt | (9) | 1/28/2021 | | 11.46% | SF+ | 6.00% | | 1/29/2027 | 7,796 | | 7,725 | | 7,796 | |
| | | | | | | | | | | | | 17,800 | | 17,988 | |
| Metalforming Holdings, LLC | | Distributor of Sheet Metal Folding and Metal Forming Equipment | | | | | | | | | | | | |
| | | Secured Debt | (37) | 10/19/2022 | | | | | | 10/19/2024 | — | | — | | — | |
| | | Secured Debt | | 10/19/2022 | | 12.75% | | | | 10/19/2027 | 1,748 | | 1,707 | | 1,707 | |
| | | Preferred Equity | (8) | 10/19/2022 | 434,331 | 8.00% | | | 8.00% | | | 443 | | 443 | |
| | | Common Stock | | 10/19/2022 | 112,865 | | | | | | | 113 | | 110 | |
| | | | | | | | | | | | | 2,263 | | 2,260 | |
MSC INCOME FUND, INC.
Consolidated Schedule of Investments (Continued)
December 31, 2023
(dollars in thousands)
| | | | | | | | | | | | | | | | | | | | | | | | | | | | | | | | | | | | | | | | | | | | |
| Portfolio Company (1) (20) | | Business Description | Type of Investment (2) (3) (15) | | Investment Date (22) | Shares/Units | Total Rate | Reference Rate and Spread (25) | PIK Rate (19) | Maturity Date | Principal (4) | Cost (4) | Fair Value (18) |
| Microbe Formulas, LLC | (10) | Nutritional Supplements Provider | | | | | | | | | | | | |
| | | Secured Debt | (9) (37) | 4/4/2022 | | | SF+ | 6.25% | | 4/3/2028 | — | | (6) | | (6) | |
| | | Secured Debt | (9) | 4/4/2022 | | 11.46% | SF+ | 6.00% | | 4/3/2028 | 2,671 | | 2,632 | | 2,671 | |
| | | | | | | | | | | | | 2,626 | | 2,665 | |
| Mills Fleet Farm Group, LLC | (10) | Omnichannel Retailer of Work, Farm and Lifestyle Merchandise | | | | | | | | | | | | |
| | | Secured Debt | (9) | 10/24/2018 | | 12.52% | SF+ | 7.00% | | 12/31/2026 | 18,152 | | 17,863 | | 17,524 | |
| | | | | | | | | | | | | | |
| Mini Melts of America, LLC | (10) | Manufacturer and Distributor of Branded Premium Beaded Ice Cream | | | | | | | | | | | | |
| | | Secured Debt | (9) (37) | 11/30/2023 | | | SF+ | 6.25% | | 11/30/2028 | — | | (28) | | (28) | |
| | | Secured Debt | (9) (37) | 11/30/2023 | | | SF+ | 6.25% | | 11/30/2028 | — | | (10) | | (10) | |
| | | Secured Debt | (9) | 11/30/2023 | | 10.64% | SF+ | 5.25% | | 11/30/2028 | 3,225 | | 3,149 | | 3,149 | |
| | | Secured Debt | (9) | 11/30/2023 | | 12.64% | SF+ | 7.25% | | 11/30/2028 | 3,225 | | 3,146 | | 3,146 | |
| | | Common Equity | | 11/30/2023 | 300,000 | | | | | | | 300 | | 300 | |
| | | | | | | | | | | | | 6,557 | | 6,557 | |
| MonitorUS Holding, LLC | (10) (13) (21) | SaaS Provider of Media Intelligence Services | | | | | | | | | | | | |
| | | Secured Debt | | 5/24/2022 | | 14.00% | | | 4.00% | 5/24/2027 | 1,120 | | 1,106 | | 1,133 | |
| | | Secured Debt | | 5/24/2022 | | 14.00% | | | 4.00% | 5/24/2027 | 2,912 | | 2,870 | | 3,184 | |
| | | Secured Debt | | 5/24/2022 | | 14.00% | | | 4.00% | 5/24/2027 | 4,957 | | 4,890 | | 4,957 | |
| | | Common Stock | | 8/30/2022 | 12,798,820 | | | | | | | 256 | | 197 | |
| | | | | | | | | | | | | 9,122 | | 9,471 | |
| NinjaTrader, LLC | (10) | Operator of Futures Trading Platform | | | | | | | | | | | | |
| | | Secured Debt | (9) (37) | 12/18/2019 | | | SF+ | 7.00% | | 12/18/2026 | — | | (4) | | (3) | |
| | | Secured Debt | (9) (37) | 12/18/2019 | | | SF+ | 7.00% | | 12/18/2026 | — | | (12) | | (12) | |
| | | Secured Debt | (9) | 12/18/2019 | | 12.54% | SF+ | 7.00% | | 12/18/2026 | 10,991 | | 10,888 | | 10,991 | |
| | | Secured Debt | (9) | 12/18/2023 | | 12.52% | SF+ | 7.00% | | 12/18/2026 | 3,878 | | 3,807 | | 3,878 | |
| | | | | | | | | | | | | 14,679 | | 14,854 | |
| Obra Capital, Inc. (f/k/a Vida Capital, Inc.) | (11) | Alternative Asset Manager | | | | | | | | | | | | |
| | | Secured Debt | | 10/10/2019 | | 11.47% | SF+ | 6.00% | | 10/1/2026 | 7,043 | | 6,711 | | 6,039 | |
| | | | | | | | | | | | | | |
| Paragon Healthcare, Inc. | (10) | Infusion Therapy Treatment Provider | | | | | | | | | | | | |
| | | Secured Debt | (9) (37) | 1/19/2022 | | | SF+ | 5.75% | | 1/19/2027 | — | | (11) | | — | |
| | | Secured Debt | (9) (43) | 1/19/2022 | | 11.24% | SF+ | 5.75% | | 1/19/2027 | 423 | | 414 | | 421 | |
| | | Secured Debt | (9) | 1/19/2022 | | 11.25% | SF+ | 5.75% | | 1/19/2027 | 2,456 | | 2,412 | | 2,442 | |
| | | | | | | | | | | | | 2,815 | | 2,863 | |
| Power System Solutions | (10) | Backup Power Generation | | | | | | | | | | | | |
| | | Secured Debt | (9) (37) | 6/7/2023 | | | SF+ | 6.75% | | 6/7/2028 | — | | (35) | | (35) | |
| | | Secured Debt | (9) (37) | 6/7/2023 | | | SF+ | 6.75% | | 6/7/2028 | — | | (35) | | (35) | |
| | | Secured Debt | (9) | 6/7/2023 | | 12.12% | SF+ | 6.75% | | 6/7/2028 | 7,939 | | 7,729 | | 7,939 | |
| | | Common Equity | | 6/7/2023 | 532 | | | | | | | 532 | | 500 | |
MSC INCOME FUND, INC.
Consolidated Schedule of Investments (Continued)
December 31, 2023
(dollars in thousands)
| | | | | | | | | | | | | | | | | | | | | | | | | | | | | | | | | | | | | | | | | | | | |
| Portfolio Company (1) (20) | | Business Description | Type of Investment (2) (3) (15) | | Investment Date (22) | Shares/Units | Total Rate | Reference Rate and Spread (25) | PIK Rate (19) | Maturity Date | Principal (4) | Cost (4) | Fair Value (18) |
| | | | | | | | | | | | | 8,191 | | 8,369 | |
| PrimeFlight Aviation Services | (10) | Air Freight & Logistics | | | | | | | | | | | | |
| | | Secured Debt | (9) | 5/1/2023 | | 12.28% | SF+ | 6.85% | | 5/1/2029 | 5,970 | | 5,813 | | 5,970 | |
| | | Secured Debt | (9) | 9/7/2023 | | 12.20% | SF+ | 6.85% | | 5/1/2029 | 570 | | 553 | | 570 | |
| | | | | | | | | | | | | 6,366 | | 6,540 | |
| PTL US Bidco, Inc | (10) (13) (21) | Manufacturers of Equipment, Including Drilling Rigs and Equipment, and Providers of Supplies and Services to Companies Involved In the Drilling, Evaluation and Completion of Oil and Gas Wells | | | | | | | | | | | | |
| | | Secured Debt | (9) (45) | 8/19/2022 | | 12.80% | SF+ | 7.25% | | 8/19/2027 | 198 | | 189 | | 196 | |
| | | Secured Debt | (9) | 8/19/2022 | | 12.88% | SF+ | 7.25% | | 8/19/2027 | 1,734 | | 1,707 | | 1,720 | |
| | | | | | | | | | | | | 1,896 | | 1,916 | |
| Purge Rite, LLC | (10) | HVAC Flushing and Filtration Services | | | | | | | | | | | | |
| | | Secured Debt | (9) (37) | 10/2/2023 | | | SF+ | 8.00% | | 10/2/2028 | — | | (19) | | (19) | |
| | | Secured Debt | (9) | 10/2/2023 | | 13.70% | SF+ | 8.00% | | 10/2/2028 | 3,906 | | 3,813 | | 3,813 | |
| | | Preferred Equity | | 10/2/2023 | 1,302,083 | | | | | | | 1,302 | | 1,302 | |
| | | | | | | | | | | | | 5,096 | | 5,096 | |
| RA Outdoors LLC | (10) | Software Solutions Provider for Outdoor Activity Management | | | | | | | | | | | | |
| | | Secured Debt | (9) (32) | 4/8/2021 | | 12.22% | SF+ | 6.75% | | 4/8/2026 | 796 | | 789 | | 745 | |
| | | Secured Debt | (9) | 4/8/2021 | | 12.21% | SF+ | 6.75% | | 4/8/2026 | 12,917 | | 12,829 | | 12,089 | |
| | | | | | | | | | | | | 13,618 | | 12,834 | |
| Research Now Group, Inc. and Survey Sampling International, LLC | (11) | Provider of Outsourced Online Surveying | | | | | | | | | | | | |
| | | Secured Debt | (9) | 12/29/2017 | | 11.14% | SF+ | 5.50% | | 12/20/2024 | 9,691 | | 9,691 | | 7,237 | |
| | | | | | | | | | | | | | |
| Richardson Sales Solutions | (10) | Business Services | | | | | | | | | | | | |
| | | Secured Debt | (9) (34) | 8/24/2023 | | 18.47% | SF+ | 6.50% | | 8/24/2028 | 833 | | 781 | | 818 | |
| | | Secured Debt | (9) | 8/24/2023 | | 11.88% | SF+ | 6.50% | | 8/24/2028 | 10,553 | | 10,261 | | 10,362 | |
| | | | | | | | | | | | | 11,042 | | 11,180 | |
| Roof Opco, LLC | (10) | Residential Re-Roofing/Repair | | | | | | | | | | | | |
| | | Secured Debt | (9) (37) | 8/27/2021 | | | SF+ | 6.50% | | 8/27/2026 | — | | (10) | | — | |
| | | Secured Debt | (9) | 8/27/2021 | | 12.16% | SF+ | 6.50% | | 8/27/2026 | 4,219 | | 4,150 | | 4,142 | |
| | | Secured Debt | (9) | 8/27/2021 | | 14.16% | SF+ | 8.50% | | 8/27/2026 | 4,219 | | 4,150 | | 4,082 | |
| | | | | | | | | | | | | 8,290 | | 8,224 | |
| Rug Doctor, LLC. | (10) | Carpet Cleaning Products and Machinery | | | | | | | | | | | | |
| | | Secured Debt | (9) | 7/16/2021 | | 13.54% | SF+ | 6.00% | 2.00% | 11/16/2025 | 6,410 | | 6,389 | | 6,383 | |
| | | Secured Debt | (9) | 7/16/2021 | | 13.54% | SF+ | 6.00% | 2.00% | 11/16/2025 | 9,022 | | 8,991 | | 8,984 | |
| | | | | | | | | | | | | 15,380 | | 15,367 | |
| Slick Innovations, LLC | | Text Message Marketing Platform | | | | | | | | | | | | |
| | | Secured Debt | | 9/13/2018 | | 14.00% | | | | 12/22/2027 | 2,860 | | 2,777 | | 2,860 | |
| | | Common Stock | | 9/13/2018 | 17,500 | | | | | | | 114 | | 600 | |
MSC INCOME FUND, INC.
Consolidated Schedule of Investments (Continued)
December 31, 2023
(dollars in thousands)
| | | | | | | | | | | | | | | | | | | | | | | | | | | | | | | | | | | | | | | | | | | | |
| Portfolio Company (1) (20) | | Business Description | Type of Investment (2) (3) (15) | | Investment Date (22) | Shares/Units | Total Rate | Reference Rate and Spread (25) | PIK Rate (19) | Maturity Date | Principal (4) | Cost (4) | Fair Value (18) |
| | | | | | | | | | | | | 2,891 | | 3,460 | |
| South Coast Terminals Holdings, LLC | (10) | Specialty Toll Chemical Manufacturer | | | | | | | | | | | | |
| | | Secured Debt | (9) | 12/10/2021 | | 11.46% | SF+ | 6.00% | | 12/13/2026 | 38 | | 34 | | 34 | |
| | | Secured Debt | (9) | 12/10/2021 | | 11.70% | SF+ | 6.00% | | 12/13/2026 | 2,979 | | 2,943 | | 2,979 | |
| | | Common Equity | | 12/10/2021 | 60,606 | | | | | | | 61 | | 59 | |
| | | | | | | | | | | | | 3,038 | | 3,072 | |
| SPAU Holdings, LLC | (10) | Digital Photo Product Provider | | | | | | | | | | | | |
| | | Secured Debt | (9) (37) | 7/1/2022 | | | SF+ | 8.00% | | 7/1/2027 | — | | (14) | | — | |
| | | Secured Debt | (9) | 7/1/2022 | | 13.72% | SF+ | 8.00% | | 7/1/2027 | 4,925 | | 4,857 | | 4,925 | |
| | | Common Stock | | 7/1/2022 | 200,000 | | | | | | | 200 | | 160 | |
| | | | | | | | | | | | | 5,043 | | 5,085 | |
| Tex Tech Tennis, LLC | (10) | Sporting Goods & Textiles | | | | | | | | | | | | |
| | | Preferred Equity | (23) | 7/7/2021 | 1,000,000 | | | | | | | 1,000 | | 2,840 | |
| | | | | | | | | | | | | | |
| The Affiliati Network, LLC | | Performance Marketing Solutions | | | | | | | | | | | | |
| | | Secured Debt | | 8/9/2021 | | 13.00% | | | | 8/9/2026 | 40 | | 37 | | 37 | |
| | | Secured Debt | | 8/9/2021 | | 13.00% | | | | 8/9/2026 | 1,880 | | 1,858 | | 1,841 | |
| | | Preferred Stock | | 9/1/2023 | 43,027 | | | | | | | 43 | | 43 | |
| | | Preferred Stock | (8) | 8/9/2021 | 320,000 | | | | | | | 1,600 | | 1,600 | |
| | | | | | | | | | | | | 3,538 | | 3,521 | |
| U.S. TelePacific Corp. | (11) | Provider of Communications and Managed Services | | | | | | | | | | | | |
| | | Secured Debt | (9) (14) | 6/1/2023 | | 12.53% | SF+ | 7.15% | 6.00% | 5/2/2027 | 6,802 | | 2,623 | | 2,438 | |
| | | Secured Debt | (14) | 6/1/2023 | | | | | | 5/2/2027 | 692 | | 15 | | — | |
| | | | | | | | | | | | | 2,638 | | 2,438 | |
| USA DeBusk LLC | (10) | Provider of Industrial Cleaning Services | | | | | | | | | | | | |
| | | Secured Debt | (9) | 10/22/2019 | | 11.46% | SF+ | 6.00% | | 9/8/2026 | 12,405 | | 12,308 | | 12,405 | |
| | | Secured Debt | (9) | 7/19/2023 | | 11.96% | SF+ | 6.50% | | 9/8/2026 | 4,825 | | 4,742 | | 4,825 | |
| | | Secured Debt | (9) | 11/21/2023 | | 11.96% | SF+ | 6.50% | | 9/8/2026 | 2,515 | | 2,468 | | 2,515 | |
| | | | | | | | | | | | | 19,518 | | 19,745 | |
| UserZoom Technologies, Inc. | (10) | Provider of User Experience Research Automation Software | | | | | | | | | | | | |
| | | Secured Debt | (9) | 1/11/2023 | | 12.99% | SF+ | 7.50% | | 4/5/2029 | 3,000 | | 2,923 | | 3,000 | |
| | | | | | | | | | | | | | |
| Vistar Media, Inc. | (10) | Operator of Digital Out-of-Home Advertising Platform | | | | | | | | | | | | |
| | | Preferred Stock | | 4/3/2019 | 70,207 | | | | | | | 767 | | 2,180 | |
| | | | | | | | | | | | | | |
| Vitesse Systems | (10) | Component Manufacturing and Machining Platform | | | | | | | | | | | | |
| | | Secured Debt | (9) | 12/22/2023 | | 12.63% | SF+ | 7.00% | | 12/22/2028 | 12,500 | | 12,193 | | 12,193 | |
MSC INCOME FUND, INC.
Consolidated Schedule of Investments (Continued)
December 31, 2023
(dollars in thousands)
| | | | | | | | | | | | | | | | | | | | | | | | | | | | | | | | | | | | | | | | | | | | |
| Portfolio Company (1) (20) | | Business Description | Type of Investment (2) (3) (15) | | Investment Date (22) | Shares/Units | Total Rate | Reference Rate and Spread (25) | PIK Rate (19) | Maturity Date | Principal (4) | Cost (4) | Fair Value (18) |
| | | | | | | | | | | | | | |
| VORTEQ Coil Finishers, LLC | (10) | Specialty Coating of Aluminum and Light-Gauge Steel | | | | | | | | | | | | |
| | | Common Equity | (8) | 11/30/2021 | 769,231 | | | | | | | 769 | | 1,911 | |
| | | | | | | | | | | | | | |
| Wall Street Prep, Inc. | (10) | Financial Training Services | | | | | | | | | | | | |
| | | Secured Debt | (9) (37) | 7/19/2021 | | | SF+ | 7.00% | | 7/19/2026 | — | | (5) | | (5) | |
| | | Secured Debt | (9) | 7/19/2021 | | 12.54% | SF+ | 7.00% | | 7/19/2026 | 4,654 | | 4,600 | | 4,654 | |
| | | Common Stock | | 7/19/2021 | 500,000 | | | | | | | 500 | | 910 | |
| | | | | | | | | | | | | 5,095 | | 5,559 | |
| Watterson Brands, LLC | (10) | Facility Management Services | | | | | | | | | | | | |
| | | Secured Debt | (9) (41) | 12/17/2021 | | 11.50% | SF+ | 6.00% | | 12/17/2026 | 253 | | 249 | | 253 | |
| | | Secured Debt | (9) | 12/17/2021 | | 11.50% | SF+ | 6.00% | | 12/17/2026 | 53 | | 47 | | 53 | |
| | | Secured Debt | (9) | 12/17/2021 | | 11.50% | SF+ | 6.00% | | 12/17/2026 | 2,166 | | 2,146 | | 2,166 | |
| | | Secured Debt | (9) | 12/17/2021 | | 11.50% | SF+ | 6.00% | | 12/17/2026 | 1,955 | | 1,936 | | 1,955 | |
| | | | | | | | | | | | | 4,378 | | 4,427 | |
| West Star Aviation Acquisition, LLC | (10) | Aircraft, Aircraft Engine and Engine Parts | | | | | | | | | | | | |
| | | Secured Debt | (9) (42) | 3/1/2022 | | 11.34% | SF+ | 6.00% | | 3/1/2028 | 665 | | 654 | | 665 | |
| | | Secured Debt | (9) | 3/1/2022 | | 11.35% | SF+ | 6.00% | | 3/1/2028 | 2,948 | | 2,907 | | 2,947 | |
| | | Secured Debt | (9) | 11/3/2023 | | 11.35% | SF+ | 6.00% | | 3/1/2028 | 1,467 | | 1,438 | | 1,467 | |
| | | Common Stock | | 3/1/2022 | 200,000 | | | | | | | 200 | | 390 | |
| | | | | | | | | | | | | 5,199 | | 5,469 | |
| Winter Services LLC | (10) | Provider of Snow Removal and Ice Management Services | | | | | | | | | | | | |
| | | Secured Debt | (9) (35) | 11/19/2021 | | 12.64% | SF+ | 7.00% | | 11/19/2026 | 2,778 | | 2,745 | | 2,778 | |
| | | Secured Debt | (9) | 11/19/2021 | | 12.66% | SF+ | 7.00% | | 11/19/2026 | 2,583 | | 2,528 | | 2,583 | |
| | | Secured Debt | (9) | 11/19/2021 | | 12.66% | SF+ | 7.00% | | 11/19/2026 | 11,625 | | 11,479 | | 11,625 | |
| | | | | | | | | | | | | 16,752 | | 16,986 | |
| World Micro Holdings, LLC | | Supply Chain Management | | | | | | | | | | | | |
| | | Secured Debt | | 12/12/2022 | | 13.00% | | | | 12/12/2027 | 1,627 | | 1,601 | | 1,601 | |
| | | Preferred Equity | (8) | 12/12/2022 | 530 | | | | | | | 530 | | 530 | |
| | | | | | | | | | | | | 2,131 | | 2,131 | |
| Xenon Arc, Inc. | (10) | Tech-enabled Distribution Services to Chemicals and Food Ingredients Primary Producers | | | | | | | | | | | | |
| | | Secured Debt | (9) (37) | 12/17/2021 | | | SF+ | 5.25% | | 12/17/2026 | — | | (5) | | — | |
| | | Secured Debt | (9) | 12/17/2021 | | 11.22% | SF+ | 5.75% | | 12/17/2027 | 1,188 | | 1,163 | | 1,188 | |
| | | Secured Debt | (9) | 12/17/2021 | | 11.25% | SF+ | 5.75% | | 12/17/2027 | 2,352 | | 2,321 | | 2,352 | |
| | | | | | | | | | | | | 3,479 | | 3,540 | |
| YS Garments, LLC | (11) | Designer and Provider of Branded Activewear | | | | | | | | | | | | |
| | | Secured Debt | (9) | 8/22/2018 | | 13.00% | SF+ | 7.50% | | 8/9/2026 | 5,584 | | 5,485 | | 5,110 | |
| | | | | | | | | | | | | | |
MSC INCOME FUND, INC.
Consolidated Schedule of Investments (Continued)
December 31, 2023
(dollars in thousands)
| | | | | | | | | | | | | | | | | | | | | | | | | | | | | | | | | | | | | | | | | | | | |
| Portfolio Company (1) (20) | | Business Description | Type of Investment (2) (3) (15) | | Investment Date (22) | Shares/Units | Total Rate | Reference Rate and Spread (25) | PIK Rate (19) | Maturity Date | Principal (4) | Cost (4) | Fair Value (18) |
| Zips Car Wash, LLC | (10) | Express Car Wash Operator | | | | | | | | | | | | |
| | | Secured Debt | (9) (33) | 2/11/2022 | | 12.71% | SF+ | 7.25% | | 3/1/2024 | 2,356 | | 2,352 | | 2,234 | |
| | | Secured Debt | (9) (33) | 2/11/2022 | | 12.71% | SF+ | 7.25% | | 3/1/2024 | 591 | | 589 | | 555 | |
| | | | | | | | | | | | | 2,941 | | 2,789 | |
Subtotal Non-Control/Non-Affiliate Investments (120.2% of net assets at fair value) | | | | | | | | | | | | | $ | 763,781 | | $ | 747,972 | |
Total Portfolio Investments, December 31, 2023 (175.6% of net assets at fair value) | | | | | | | | | | | | | $ | 1,038,318 | | $ | 1,092,895 | |
| Money market funds (included in cash and cash equivalents) (16) | | | | | | | | | | | | | | |
| Fidelity Government Portfolio Class III Fund (38) | | | | | | | | | | | | | $ | 3,188 | | $ | 3,188 | |
| First American Treasury Obligations Fund Class Z (39) | | | | | | | | | | | | | 17,656 | | 17,656 | |
| Total money market funds | | | | | | | | | | | | | $ | 20,844 | | $ | 20,844 | |
_____________________________
(1)All investments are Lower Middle Market portfolio investments, unless otherwise noted. See Note C — Fair Value Hierarchy for Investments — Portfolio Composition for a description of Lower Middle Market portfolio investments. All of the Company’s investments, unless otherwise noted, are encumbered as security for one of the Company’s Credit Facilities.
(2)Debt investments are income producing, unless otherwise noted by footnote (14), as described below. Equity and warrants are non-income producing, unless otherwise noted by footnote (8), as described below.
(3)See Note C — Fair Value Hierarchy for Investments — Portfolio Composition and Schedule 12-14 for a summary of geographic location of portfolio companies.
(4)Principal is net of repayments. Cost is net of repayments and accumulated unearned income. Negative cost is the result of the capitalized discount being greater than the principal amount outstanding on the loan.
(5)Control investments are defined by the 1940 Act as investments in which more than 25% of the voting securities are owned or where the ability to nominate greater than 50% of the board representation is maintained.
(6)Affiliate investments are defined by the 1940 Act as investments in which between 5% and 25% (inclusive) of the voting securities are owned and the investments are not classified as Control investments.
(7)Non-Control/Non-Affiliate investments are defined by the 1940 Act as investments that are neither Control investments nor Affiliate investments.
(8)Income producing through dividends or distributions.
(9)Index based floating interest rate is subject to contractual minimum interest rate. As noted in this schedule, 95% of these floating rate loans (based on the par amount) contain LIBOR or SOFR floors which range between 0.75% and 2.00%, with a weighted-average floor of 1.17%.
(10)Private Loan portfolio investment. See Note C — Fair Value Hierarchy for Investments — Portfolio Composition for a description of Private Loan portfolio investments.
(11)Middle Market portfolio investment. See Note C — Fair Value Hierarchy for Investments — Portfolio Composition for a description of Middle Market portfolio investments.
(12)Other Portfolio investment. See Note C — Fair Value Hierarchy for Investments — Portfolio Composition for a description of Other Portfolio investments.
(13)Investment is not a qualifying asset as defined under Section 55(a) of the 1940 Act. Qualifying assets must represent at least 70% of total assets at the time of acquisition of any additional non-qualifying assets.
(14)Non-accrual and non-income producing debt investment.
(15)All of the Company’s portfolio investments are generally subject to restrictions on resale as “restricted securities.”
(16)Money market fund interests included in cash and cash equivalents.
MSC INCOME FUND, INC.
Consolidated Schedule of Investments (Continued)
December 31, 2023
(dollars in thousands)
(17)Maturity date is under on-going negotiations with the portfolio company and other lenders, if applicable.
(18)Investment fair value was determined using significant unobservable inputs, unless otherwise noted. See Note C — Fair Value Hierarchy for Investments—Portfolio Composition for further discussion. Negative fair value is the result of the capitalized discount on the loan or the unfunded commitment being valued below par.
(19)Investments may have a portion, or all, of their income received from PIK interest or dividends. PIK interest income and cumulative dividend income represent income not paid currently in cash. The difference between the Total Rate and PIK Rate represents the cash rate as of December 31, 2023.
(20)All portfolio company headquarters are based in the United States, unless otherwise noted.
(21)Portfolio company headquarters are located outside of the United States.
(22)Investment date represents the date of initial investment in the security position.
(23)Shares/Units represent ownership in a related Real Estate or HoldCo entity.
(24)Investment is not unitized. Presentation is made in percent of fully diluted ownership unless otherwise indicated.
(25)A majority of the variable rate loans in the Company’s Investment Portfolio bear interest at a rate that may be determined by reference to either LIBOR (“L”), SOFR (“SF”) or an alternate base rate (commonly based on the Federal Funds Rate or the Prime rate (“P”)), which typically resets every one, three, or six months at the borrower’s option. SOFR based contracts may include a credit spread adjustment (the “Adjustment”) that is charged in addition to the stated spread. The Adjustment is applied when the SOFR rate, plus the Adjustment, exceeds the stated floor rate, as applicable. As of December 31, 2023, SOFR based contracts in the portfolio had Adjustments ranging from 0.10% to 0.43%.
(26)As of December 31, 2023, borrowings under the loan facility bear interest at SOFR+7.00% (Floor 1.00%). Each new draw or funding on the facility has a different floating rate reset date. The rate presented represents a weighted-average rate for borrowings under the facility, as of December 31, 2023.
(27)Warrants are presented in equivalent shares/units with a strike price of $0.01 per share/unit.
(28)As of December 31, 2023, borrowings under the loan facility bore interest at SOFR+10.00%. RLOC facility permits the borrower to make an interest rate election regarding the base rate on each draw under the facility. The rate presented represents a weighted-average rate for borrowings under the facility, as of December 31, 2023.
(29)As of December 31, 2023, borrowings under the loan facility bore interest at SOFR+7.00% (Floor 1.50%). RLOC facility permits the borrower to make an interest rate election regarding the base rate on each draw under the facility. The rate presented represents a weighted-average rate for borrowings under the facility, as of December 31, 2023.
(30)As of December 31, 2023, borrowings under the loan facility bore interest at SOFR+8.00% (Floor 1.00%). RLOC facility permits the borrower to make an interest rate election regarding the base rate on each draw under the facility. The rate presented represents a weighted-average rate for borrowings under the facility, as of December 31, 2023.
(31)As of December 31, 2023, borrowings under the loan facility bore interest at SOFR+8.00% (Floor 2.00%). RLOC facility permits the borrower to make an interest rate election regarding the base rate on each draw under the facility. The rate presented represents a weighted-average rate for borrowings under the facility, as of December 31, 2023.
(32)As of December 31, 2023, borrowings under the loan facility bore interest at SOFR+6.75% (Floor 1.00%). RLOC facility permits the borrower to make an interest rate election regarding the base rate on each draw under the facility. The rate presented represents a weighted-average rate for borrowings under the facility, as of December 31, 2023.
(33)As of December 31, 2023, borrowings under the loan facility bore interest at SOFR+7.25% (Floor 1.00%). Each new draw or funding on the facility has a different floating rate reset date. The rate presented represents a weighted-average rate for borrowings under the facility, as of December 31, 2023.
(34)As of December 31, 2023, borrowings under the loan facility bore interest at SOFR+6.50% (Floor 2.00%). RLOC facility permits the borrower to make an interest rate election regarding the base rate on each draw under the facility. The rate presented represents a weighted-average rate for borrowings under the facility, as of December 31, 2023.
MSC INCOME FUND, INC.
Consolidated Schedule of Investments (Continued)
December 31, 2023
(dollars in thousands)
(35)As of December 31, 2023, borrowings under the loan facility bore interest at SOFR+7.00% (Floor 1.00%). RLOC facility permits the borrower to make an interest rate election regarding the base rate on each draw under the facility. The rate presented represents a weighted-average rate for borrowings under the facility, as of December 31, 2023.
(36)Index based floating interest rate is subject to contractual maximum base rate of 3.00%.
(37)The position is unfunded and no interest income is being earned as of December 31, 2023. The position may earn a nominal unused facility fee on committed amounts.
(38)Effective yield as of December 31, 2023 was approximately 5.25% on the Fidelity Government Portfolio Class III Fund.
(39)Effective yield as of December 31, 2023 was approximately 5.23% on the First American Treasury Obligations Fund Class Z.
(40)Warrants are presented in equivalent shares/units with a strike price of $1.00 per share/unit.
(41)As of December 31, 2023, borrowings under the loan facility bore interest at SOFR+6.00% (Floor 1.00%). RLOC facility permits the borrower to make an interest rate election regarding the base rate on each draw under the facility. The rate presented represents a weighted-average rate for borrowings under the facility, as of December 31, 2023.
(42)As of December 31, 2023, borrowings under the loan facility bore interest at SOFR+6.00% (Floor 0.75%). Each new draw or funding on the facility has a different floating rate reset date. The rate presented represents a weighted-average rate for borrowings under the facility, as of December 31, 2023.
(43)As of December 31, 2023, borrowings under the loan facility bore interest at SOFR+5.75% (Floor 1.00%). Each new draw or funding on the facility has a different floating rate reset date. The rate presented represents a weighted-average rate for borrowings under the facility, as of December 31, 2023.
(44)As of December 31, 2023, borrowings under the loan facility bore interest at SOFR+7.00% (Floor 2.00%). RLOC facility permits the borrower to make an interest rate election regarding the base rate on each draw under the facility. The rate presented represents a weighted-average rate for borrowings under the facility, as of December 31, 2023.
(45)As of December 31, 2023, borrowings under the loan facility bore interest at SOFR+7.25% (Floor 1.00%). RLOC facility permits the borrower to make an interest rate election regarding the base rate on each draw under the facility. The rate presented represents a weighted-average rate for borrowings under the facility, as of December 31, 2023.
MSC INCOME FUND, INC.
Consolidated Schedule of Investments
December 31, 2022
(dollars in thousands)
| | | | | | | | | | | | | | | | | | | | | | | | | | | | | | | | | | | | | | | | | | | | |
| Portfolio Company (1) (20) | | Business Description | Type of Investment (2) (3) (15) | | Investment Date (22) | Shares/Units | Total Rate | Reference Rate and Spread (25) | PIK Rate (19) | Maturity Date | Principal (4) | Cost (4) | Fair Value (18) |
| Control Investments (5) | | | | | | | | | | | | | | |
| Copper Trail Fund Investments | (12) (13) | Investment Partnership | | | | | | | | | | | | |
| | | LP Interests (CTMH, LP) | (24) | 07/17/2017 | 39.0% | | | | | | | $ | 713 | | $ | 588 | |
| | | | | | | | | | | | | | |
| GRT Rubber Technologies LLC | | Manufacturer of Engineered Rubber Products | | | | | | | | | | | | |
| | | Secured Debt | | 12/21/2018 | | 10.12% | L+ | 6.00% | | 12/21/2023 | 330 | | 324 | | 330 | |
| | | Secured Debt | | 12/19/2014 | | 12.12% | L+ | 8.00% | | 10/29/2026 | 19,944 | | 19,753 | | 19,943 | |
| | | Member Units | (8) | 12/19/2014 | 2,896 | | | | | | | 6,435 | | 21,890 | |
| | | | | | | | | | | | | 26,512 | | 42,163 | |
| Harris Preston Fund Investments | (12) (13) | Investment Partnership | | | | | | | | | | | | |
| | | LP Interests (2717 MH, L.P.) | (24) | 10/01/2017 | 49.3% | | | | | | | 3,895 | | 7,552 | |
| | | | | | | | | | | | | | |
Subtotal Control Investments (8.3% of net assets at fair value) | | | | | | | | | | | | | $ | 31,120 | | $ | 50,303 | |
| Affiliate Investments (6) | | | | | | | | | | | | | | |
| AFG Capital Group, LLC | | Provider of Rent-to-Own Financing Solutions and Services | | | | | | | | | | | | |
| | | Preferred Member Units | (8) | 11/07/2014 | 46 | | | | | | | $ | 300 | | $ | 2,350 | |
| | | | | | | | | | | | | | |
| Analytical Systems Keco Holdings, LLC | | Manufacturer of Liquid and Gas Analyzers | | | | | | | | | | | | |
| | | Secured Debt | (9) | 08/16/2019 | | | L+ | 10.00% | | 8/16/2024 | — | | (2) | | (2) | |
| | | Secured Debt | (9) | 08/16/2019 | | 14.13% | L+ | 10.00% | | 8/16/2024 | 1,166 | | 1,135 | | 1,135 | |
| | | Preferred Member Units | | 05/20/2021 | 607 | | | | | | | 607 | | 880 | |
| | | Preferred Member Units | | 08/16/2019 | 800 | 14.13% | | | | | | 800 | | — | |
| | | Warrants | (27) | 08/16/2019 | 105 | | | | | 8/16/2029 | | 79 | | — | |
| | | | | | | | | | | | | 2,619 | | 2,013 | |
| ATX Networks Corp. | (11) | Provider of Radio Frequency Management Equipment | | | | | | | | | | | | |
| | | Secured Debt | (9) | 09/01/2021 | | 12.23% | L+ | 7.50% | | 9/1/2026 | 6,811 | | 6,266 | | 6,368 | |
| | | Unsecured Debt | | 09/01/2021 | | 10.00% | | | 10.00% | 9/1/2028 | 3,417 | | 2,337 | | 2,614 | |
| | | Common Stock | | 09/01/2021 | 585 | | | | | | | — | | 3,290 | |
| | | | | | | | | | | | | 8,603 | | 12,272 | |
| Barfly Ventures, LLC | (10) | Casual Restaurant Group | | | | | | | | | | | | |
| | | Member Units | | 10/26/2020 | 12 | | | | | | | 528 | | 1,107 | |
| | | | | | | | | | | | | | |
| Batjer TopCo, LLC | | HVAC Mechanical Contractor | | | | | | | | | | | | |
| | | Secured Debt | | 03/07/2022 | | | | | | 3/31/2027 | — | | (1) | | (1) | |
| | | Secured Debt | | 03/07/2022 | | 11.00% | | | | 3/31/2027 | 1,225 | | 1,205 | | 1,205 | |
| | | Preferred Stock | (8) | 03/07/2022 | 453 | | | | | | | 455 | | 455 | |
MSC INCOME FUND, INC.
Consolidated Schedule of Investments (Continued)
December 31, 2022
(dollars in thousands)
| | | | | | | | | | | | | | | | | | | | | | | | | | | | | | | | | | | | | | | | | | | | |
| Portfolio Company (1) (20) | | Business Description | Type of Investment (2) (3) (15) | | Investment Date (22) | Shares/Units | Total Rate | Reference Rate and Spread (25) | PIK Rate (19) | Maturity Date | Principal (4) | Cost (4) | Fair Value (18) |
| | | | | | | | | | | | | 1,659 | | 1,659 | |
| Brewer Crane Holdings, LLC | | Provider of Crane Rental and Operating Services | | | | | | | | | | | | |
| | | Secured Debt | (9) | 01/09/2018 | | 14.12% | L+ | 10.00% | | 1/9/2023 | 1,491 | | 1,491 | | 1,491 | |
| | | Preferred Member Units | (8) | 01/09/2018 | 737 | | | | | | | 1,070 | | 1,770 | |
| | | | | | | | | | | | | 2,561 | | 3,261 | |
| Centre Technologies Holdings, LLC | | Provider of IT Hardware Services and Software Solutions | | | | | | | | | | | | |
| | | Secured Debt | (9) | 01/04/2019 | | | L+ | 9.00% | | 1/4/2026 | — | | — | | — | |
| | | Secured Debt | (9) | 01/04/2019 | | 13.13% | L+ | 9.00% | | 1/4/2026 | 3,758 | | 3,731 | | 3,731 | |
| | | Preferred Member Units | | 01/04/2019 | 3,327 | | | | | | | 1,531 | | 2,170 | |
| | | | | | | | | | | | | 5,262 | | 5,901 | |
| Chamberlin Holding LLC | | Roofing and Waterproofing Specialty Contractor | | | | | | | | | | | | |
| | | Secured Debt | (9) | 02/26/2018 | | | L+ | 6.00% | | 2/26/2023 | — | | — | | — | |
| | | Secured Debt | (9) | 02/26/2018 | | 12.13% | L+ | 8.00% | | 2/26/2023 | 4,236 | | 4,228 | | 4,236 | |
| | | Member Units | (8) | 02/26/2018 | 1,087 | | | | | | | 2,860 | | 5,728 | |
| | | Member Units | (8) (23) | 11/02/2018 | 261,786 | | | | | | | 443 | | 678 | |
| | | | | | | | | | | | | 7,531 | | 10,642 | |
| Charps, LLC | | Pipeline Maintenance and Construction | | | | | | | | | | | | |
| | | Preferred Member Units | (8) | 02/03/2017 | 457 | | | | | | | 491 | | 3,330 | |
| | | | | | | | | | | | | | |
| Clad-Rex Steel, LLC | | Specialty Manufacturer of Vinyl-Clad Metal | | | | | | | | | | | | |
| | | Secured Debt | (9) | 12/20/2016 | | 13.23% | SF+ | 9.00% | | 1/15/2024 | 2,620 | | 2,620 | | 2,620 | |
| | | Secured Debt | | 12/20/2016 | | 10.00% | | | | 12/20/2036 | 262 | | 260 | | 260 | |
| | | Member Units | (8) | 12/20/2016 | 179 | | | | | | | 1,820 | | 2,060 | |
| | | Member Units | (23) | 12/20/2016 | 200 | | | | | | | 53 | | 152 | |
| | | | | | | | | | | | | 4,753 | | 5,092 | |
| Cody Pools, Inc. | | Designer of Residential and Commercial Pools | | | | | | | | | | | | |
| | | Secured Debt | (9) | 03/06/2020 | | 15.38% | L+ | 10.50% | | 12/17/2026 | 273 | | 261 | | 273 | |
| | | Secured Debt | (9) | 03/06/2020 | | 15.38% | L+ | 10.50% | | 12/17/2026 | 6,882 | | 6,786 | | 6,882 | |
| | | Preferred Member Units | (8) (23) | 03/06/2020 | 147 | | | | | | | 2,079 | | 14,550 | |
| | | | | | | | | | | | | 9,126 | | 21,705 | |
| Colonial Electric Company LLC | | Provider of Electrical Contracting Services | | | | | | | | | | | | |
| | | Secured Debt | | 03/31/2021 | | | | | | 3/31/2026 | — | | — | | — | |
| | | Secured Debt | | 03/31/2021 | | 12.00% | | | | 3/31/2026 | 5,828 | | 5,729 | | 5,729 | |
| | | Preferred Member Units | (8) | 03/31/2021 | 4,320 | | | | | | | 1,920 | | 2,290 | |
| | | | | | | | | | | | | 7,649 | | 8,019 | |
| Datacom, LLC | | Technology and Telecommunications Provider | | | | | | | | | | | | |
| | | Secured Debt | | 03/01/2022 | | 7.50% | | | | 12/31/2025 | 25 | | 25 | | 25 | |
MSC INCOME FUND, INC.
Consolidated Schedule of Investments (Continued)
December 31, 2022
(dollars in thousands)
| | | | | | | | | | | | | | | | | | | | | | | | | | | | | | | | | | | | | | | | | | | | |
| Portfolio Company (1) (20) | | Business Description | Type of Investment (2) (3) (15) | | Investment Date (22) | Shares/Units | Total Rate | Reference Rate and Spread (25) | PIK Rate (19) | Maturity Date | Principal (4) | Cost (4) | Fair Value (18) |
| | | Secured Debt | | 03/31/2021 | | 7.50% | | | | 12/31/2025 | 958 | | 895 | | 865 | |
| | | Preferred Member Units | (8) | 03/31/2021 | 1,000 | | | | | | | 290 | | 300 | |
| | | | | | | | | | | | | 1,210 | | 1,190 | |
| Digital Products Holdings LLC | | Designer and Distributor of Consumer Electronics | | | | | | | | | | | | |
| | | Secured Debt | (9) | 04/01/2018 | | 14.13% | L+ | 10.00% | | 4/1/2023 | 3,883 | | 3,878 | | 3,878 | |
| | | Preferred Member Units | (8) | 04/01/2018 | 964 | | | | | | | 2,375 | | 2,459 | |
| | | | | | | | | | | | | 6,253 | | 6,337 | |
| Direct Marketing Solutions, Inc. | | Provider of Omni-Channel Direct Marketing Services | | | | | | | | | | | | |
| | | Secured Debt | (9) | 02/13/2018 | | | L+ | 11.00% | | 2/13/2026 | — | | (5) | | — | |
| | | Secured Debt | (9) | 12/27/2022 | | 15.13% | L+ | 11.00% | | 2/13/2026 | 5,352 | | 5,306 | | 5,352 | |
| | | Preferred Stock | (8) | 02/13/2018 | 2,100 | | | | | | | 2,100 | | 5,558 | |
| | | | | | | | | | | | | 7,401 | | 10,910 | |
| Flame King Holdings, LLC | | Propane Tank and Accessories Distributor | | | | | | | | | | | | |
| | | Secured Debt | (9) | 10/29/2021 | | 10.75% | L+ | 6.50% | | 10/31/2026 | 1,900 | | 1,885 | | 1,900 | |
| | | Secured Debt | (9) | 10/29/2021 | | 13.25% | L+ | 9.00% | | 10/31/2026 | 5,300 | | 5,175 | | 5,300 | |
| | | Preferred Equity | (8) | 10/29/2021 | 2,340 | | | | | | | 2,600 | | 4,400 | |
| | | | | | | | | | | | | 9,660 | | 11,600 | |
| Freeport Financial Funds | (12) (13) | Investment Partnership | | | | | | | | | | | | |
| | | LP Interests (Freeport First Lien Loan Fund III LP) | (8) (24) | 07/31/2015 | 6.0% | | | | | | | 6,303 | | 5,848 | |
| | | | | | | | | | | | | | |
| Gamber-Johnson Holdings, LLC | | Manufacturer of Ruggedized Computer Mounting Systems | | | | | | | | | | | | |
| | | Secured Debt | (9) | 06/24/2016 | | | SF+ | 8.50% | | 1/1/2028 | — | | — | | — | |
| | | Secured Debt | (9) | 12/15/2022 | | 11.50% | SF+ | 8.50% | | 1/1/2028 | 16,020 | | 15,747 | | 16,020 | |
| | | Member Units | (8) | 06/24/2016 | 2,261 | | | | | | | 4,423 | | 12,720 | |
| | | | | | | | | | | | | 20,170 | | 28,740 | |
| GFG Group, LLC | | Grower and Distributor of a Variety of Plants and Products to Other Wholesalers, Retailers and Garden Centers | | | | | | | | | | | | |
| | | Secured Debt | | 03/31/2021 | | 9.00% | | | | 3/31/2026 | 2,836 | | 2,779 | | 2,836 | |
| | | Preferred Member Units | (8) | 03/31/2021 | 56 | | | | | | | 1,225 | | 1,790 | |
| | | | | | | | | | | | | 4,004 | | 4,626 | |
| Gulf Publishing Holdings, LLC | | Energy Industry Focused Media and Publishing | | | | | | | | | | | | |
| | | Secured Debt | (9) | 09/29/2017 | | | L+ | 9.50% | | 7/1/2027 | — | | — | | — | |
| | | Secured Debt | | 07/01/2022 | | 12.50% | | | | 7/1/2027 | 600 | | 600 | | 571 | |
| | | Preferred Equity | | 07/01/2022 | 15,930 | | | | | | | 1,400 | | 950 | |
| | | Member Units | | 04/29/2016 | 920 | | | | | | | 920 | | — | |
| | | | | | | | | | | | | 2,920 | | 1,521 | |
| Harris Preston Fund Investments | (12) (13) | Investment Partnership | | | | | | | | | | | | |
MSC INCOME FUND, INC.
Consolidated Schedule of Investments (Continued)
December 31, 2022
(dollars in thousands)
| | | | | | | | | | | | | | | | | | | | | | | | | | | | | | | | | | | | | | | | | | | | |
| Portfolio Company (1) (20) | | Business Description | Type of Investment (2) (3) (15) | | Investment Date (22) | Shares/Units | Total Rate | Reference Rate and Spread (25) | PIK Rate (19) | Maturity Date | Principal (4) | Cost (4) | Fair Value (18) |
| | | LP Interests (HPEP 3, L.P.) | (24) | 08/09/2017 | 8.2% | | | | | | | 2,558 | | 4,331 | |
| | | | | | | | | | | | | | |
| Kickhaefer Manufacturing Company, LLC | | Precision Metal Parts Manufacturing | | | | | | | | | | | | |
| | | Secured Debt | | 10/31/2018 | | 11.50% | | | | 10/31/2023 | 5,104 | | 5,075 | | 5,093 | |
| | | Secured Debt | | 10/31/2018 | | 9.00% | | | | 10/31/2048 | 970 | | 961 | | 961 | |
| | | Preferred Equity | | 10/31/2018 | 145 | | | | | | | 3,060 | | 1,800 | |
| | | Member Units | (8) (23) | 10/31/2018 | 200 | | | | | | | 248 | | 713 | |
| | | | | | | | | | | | | 9,344 | | 8,567 | |
| Market Force Information, LLC | | Provider of Customer Experience Management Services | | | | | | | | | | | | |
| | | Secured Debt | (14) | 07/28/2017 | | 12.00% | | | 12.00% | 7/28/2023 | 6,520 | | 6,463 | | 403 | |
| | | Member Units | | 07/28/2017 | 185,980 | | | | | | | 4,160 | | — | |
| | | | | | | | | | | | | 10,623 | | 403 | |
| MH Corbin Holding LLC | | Manufacturer and Distributor of Traffic Safety Products | | | | | | | | | | | | |
| | | Secured Debt | | 08/31/2015 | | 13.00% | | | | 12/31/2022 | 1,539 | | 1,539 | | 1,137 | |
| | | Preferred Member Units | | 03/15/2019 | 16,500 | | | | | | | 1,100 | | — | |
| | | Preferred Member Units | | 09/01/2015 | 1,000 | | | | | | | 1,500 | | — | |
| | | | | | | | | | | | | 4,139 | | 1,137 | |
| Mystic Logistics Holdings, LLC | | Logistics and Distribution Services Provider for Large Volume Mailers | | | | | | | | | | | | |
| | | Secured Debt | | 08/18/2014 | | | | | | 1/31/2024 | — | | — | | — | |
| | | Secured Debt | | 08/18/2014 | | 10.00% | | | | 1/31/2024 | 1,436 | | 1,436 | | 1,436 | |
| | | Common Stock | (8) | 08/18/2014 | 1,468 | | | | | | | 680 | | 5,708 | |
| | | | | | | | | | | | | 2,116 | | 7,144 | |
| NexRev LLC | | Provider of Energy Efficiency Products & Services | | | | | | | | | | | | |
| | | Secured Debt | | 02/28/2018 | | | | | | 2/28/2025 | — | | — | | — | |
| | | Secured Debt | | 02/28/2018 | | 11.00% | | | | 2/28/2025 | 2,866 | | 2,828 | | 2,119 | |
| | | Preferred Member Units | (8) | 02/28/2018 | 25,786,046 | | | | | | | 2,053 | | 280 | |
| | | | | | | | | | | | | 4,881 | | 2,399 | |
| NuStep, LLC | | Designer, Manufacturer and Distributor of Fitness Equipment | | | | | | | | | | | | |
| | | Secured Debt | (9) | 01/31/2017 | | 10.63% | L+ | 6.50% | | 1/31/2025 | 1,100 | | 1,097 | | 1,100 | |
| | | Secured Debt | | 01/31/2017 | | 12.00% | | | | 1/31/2025 | 4,610 | | 4,603 | | 4,603 | |
| | | Preferred Member Units | | 11/02/2022 | 515 | | | | | | | 515 | | 1,290 | |
| | | Preferred Member Units | | 01/31/2017 | 102 | | | | | | | 2,550 | | 2,010 | |
| | | | | | | | | | | | | 8,765 | | 9,003 | |
| Oneliance, LLC | | Construction Cleaning Company | | | | | | | | | | | | |
| | | Secured Debt | (9) | 08/06/2021 | | 15.13% | L+ | 11.00% | | 8/6/2026 | 1,400 | | 1,380 | | 1,380 | |
MSC INCOME FUND, INC.
Consolidated Schedule of Investments (Continued)
December 31, 2022
(dollars in thousands)
| | | | | | | | | | | | | | | | | | | | | | | | | | | | | | | | | | | | | | | | | | | | |
| Portfolio Company (1) (20) | | Business Description | Type of Investment (2) (3) (15) | | Investment Date (22) | Shares/Units | Total Rate | Reference Rate and Spread (25) | PIK Rate (19) | Maturity Date | Principal (4) | Cost (4) | Fair Value (18) |
| | | Preferred Stock | | 08/06/2021 | 264 | | | | | | | 264 | | 264 | |
| | | | | | | | | | | | | 1,644 | | 1,644 | |
| Orttech Holdings, LLC | | Distributor of Industrial Clutches, Brakes and Other Components | | | | | | | | | | | | |
| | | Secured Debt | (9) | 07/30/2021 | | | L+ | 11.00% | | 7/31/2026 | — | | (2) | | (2) | |
| | | Secured Debt | (9) | 07/30/2021 | | 15.13% | L+ | 11.00% | | 7/31/2026 | 5,900 | | 5,814 | | 5,814 | |
| | | Preferred Stock | (8) (23) | 07/30/2021 | 2,500 | | | | | | | 2,500 | | 2,940 | |
| | | | | | | | | | | | | 8,312 | | 8,752 | |
| Robbins Bros. Jewelry, Inc. | | Bridal Jewelry Retailer | | | | | | | | | | | | |
| | | Secured Debt | (9) | 12/15/2021 | | | | | | 12/15/2026 | — | | (8) | | (8) | |
| | | Secured Debt | (9) | 12/15/2021 | | 12.50% | | | | 12/15/2026 | 3,965 | | 3,902 | | 3,902 | |
| | | Preferred Equity | | 12/15/2021 | 1,230 | | | | | | | 1,230 | | 1,650 | |
| | | | | | | | | | | | | 5,124 | | 5,544 | |
| SI East, LLC | | Rigid Industrial Packaging Manufacturing | | | | | | | | | | | | |
| | | Secured Debt | | 08/31/2018 | | | | | | 8/31/2023 | — | | — | | — | |
| | | Secured Debt | | 08/31/2018 | | 9.50% | | | | 8/31/2023 | 29,929 | | 29,795 | | 29,929 | |
| | | Preferred Member Units | (8) | 08/31/2018 | 52 | | | | | | | 406 | | 4,550 | |
| | | | | | | | | | | | | 30,201 | | 34,479 | |
| Sonic Systems International, LLC | (10) | Nuclear Power Staffing Services | | | | | | | | | | | | |
| | | Secured Debt | (9) | 08/20/2021 | | 11.24% | L+ | 7.50% | | 8/20/2026 | 18,425 | | 18,143 | | 18,425 | |
| | | Common Stock | | 08/20/2021 | 11,647 | | | | | | | 1,584 | | 1,490 | |
| | | | | | | | | | | | | 19,727 | | 19,915 | |
| Student Resource Center, LLC | (10) | Higher Education Services | | | | | | | | | | | | |
| | | Secured Debt | | 12/31/2022 | | 13.27% | L+ | 8.50% | | 12/31/2027 | 5,556 | | 5,063 | | 5,063 | |
| | | Preferred Equity | | 12/31/2022 | 6,564,055 | | | | | | | — | | — | |
| | | | | | | | | | | | | 5,063 | | 5,063 | |
| Tedder Industries, LLC | | Manufacturer of Firearm Holsters and Accessories | | | | | | | | | | | | |
| | | Secured Debt | | 08/31/2018 | | 12.00% | | | | 8/31/2023 | 460 | | 460 | | 460 | |
| | | Secured Debt | | 08/31/2018 | | 12.00% | | | | 8/31/2023 | 3,800 | | 3,797 | | 3,780 | |
| | | Preferred Member Units | | 08/31/2018 | 136 | | | | | | | 2,311 | | 1,920 | |
| | | | | | | | | | | | | 6,568 | | 6,160 | |
| Trantech Radiator Topco, LLC | | Transformer Cooling Products and Services | | | | | | | | | | | | |
| | | Secured Debt | | 05/31/2019 | | | | | | 5/31/2024 | — | | (3) | | — | |
| | | Secured Debt | | 05/31/2019 | | 12.00% | | | | 5/31/2024 | 1,980 | | 1,960 | | 1,980 | |
| | | Common Stock | (8) | 05/31/2019 | 154 | | | | | | | 1,164 | | 1,950 | |
| | | | | | | | | | | | | 3,121 | | 3,930 | |
| VVS Holdco LLC | | Omnichannel Retailer of Animal Health Products | | | | | | | | | | | | |
| | | Secured Debt | (9) (23) | 12/01/2021 | | | L+ | 6.00% | | 12/1/2023 | — | | (5) | | (5) | |
| | | Secured Debt | (23) | 12/01/2021 | | 11.50% | | | | 12/1/2026 | 7,600 | | 7,421 | | 7,421 | |
| | | Preferred Equity | (8) (23) | 12/01/2021 | 2,960 | | | | | | | 2,960 | | 2,990 | |
| | | | | | | | | | | | | 10,376 | | 10,406 | |
MSC INCOME FUND, INC.
Consolidated Schedule of Investments (Continued)
December 31, 2022
(dollars in thousands)
| | | | | | | | | | | | | | | | | | | | | | | | | | | | | | | | | | | | | | | | | | | | |
| Portfolio Company (1) (20) | | Business Description | Type of Investment (2) (3) (15) | | Investment Date (22) | Shares/Units | Total Rate | Reference Rate and Spread (25) | PIK Rate (19) | Maturity Date | Principal (4) | Cost (4) | Fair Value (18) |
Subtotal Affiliate Investments (45.4% of net assets at fair value) | | | | | | | | | | | | | $ | 241,565 | | $ | 277,000 | |
| Non-Control Investments (7) | | | | | | | | | | | | | | |
| AAC Holdings, Inc. | (11) | Substance Abuse Treatment Service Provider | | | | | | | | | | | | |
| | | Secured Debt | | 12/11/2020 | | 18.00% | | | 18.00% | 6/25/2025 | $ | 4,173 | | $ | 3,963 | | $ | 4,110 | |
| | | Common Stock | | 12/11/2020 | 593,927 | | | | | | | 3,148 | | — | |
| | | Warrants | (27) | 12/11/2020 | 197,717 | | | | | 12/11/2025 | | — | | — | |
| | | | | | | | | | | | | 7,111 | | 4,110 | |
| AB Centers Acquisition Corporation | (10) | Applied Behavior Analysis Therapy Provider | | | | | | | | | | | | |
| | | Secured Debt | (9) | 09/06/2022 | | | SF+ | 6.00% | | 9/6/2028 | — | | (5) | | (5) | |
| | | Secured Debt | (9) | 09/06/2022 | | 10.20% | SF+ | 6.00% | | 9/6/2028 | 86 | | 77 | | 86 | |
| | | Secured Debt | (9) | 09/06/2022 | | 10.58% | SF+ | 6.00% | | 9/6/2028 | 1,983 | | 1,930 | | 1,983 | |
| | | | | | | | | | | | | 2,002 | | 2,064 | |
| Acumera, Inc. | (10) | Managed Security Service Provider | | | | | | | | | | | | |
| | | Secured Debt | (9) | 06/28/2022 | | 13.88% | L+ | 9.50% | | 10/26/2027 | 4,616 | | 4,511 | | 4,616 | |
| | | Secured Debt | (9) | 06/28/2022 | | 13.57% | L+ | 9.00% | | 10/26/2027 | 1,379 | | 1,348 | | 1,379 | |
| | | | | | | | | | | | | 5,859 | | 5,995 | |
| Adams Publishing Group, LLC | (10) | Local Newspaper Operator | | | | | | | | | | | | |
| | | Secured Debt | (9) (28) | 03/11/2022 | | 10.00% | L+ | 6.00% | | 3/11/2027 | 565 | | 565 | | 565 | |
| | | Secured Debt | (9) (28) | 03/11/2022 | | 10.00% | L+ | 7.50% | | 3/11/2027 | 2,826 | | 2,819 | | 2,826 | |
| | | | | | | | | | | | | 3,384 | | 3,391 | |
| ADS Tactical, Inc. | (11) | Value-Added Logistics and Supply Chain Provider to the Defense Industry | | | | | | | | | | | | |
| | | Secured Debt | (9) | 03/29/2021 | | 10.14% | L+ | 5.75% | | 3/19/2026 | 9,125 | | 8,996 | | 8,213 | |
| | | | | | | | | | | | | | |
| AMEREQUIP LLC. | (10) | Full Service Provider of Comprehensive Commercial Production Services, Including the Design, Engineering, and Manufacturing of Products It | | | | | | | | | | | | |
| | | Secured Debt | (9) | 08/31/2022 | | | SF+ | 7.40% | | 8/31/2027 | — | | — | | — | |
| | | Secured Debt | (9) | 08/31/2022 | | 11.72% | SF+ | 7.40% | | 8/31/2027 | 2,026 | | 2,026 | | 2,025 | |
| | | Common Stock | | 08/31/2022 | 11 | | | | | | | 80 | | 80 | |
| | | | | | | | | | | | | 2,106 | | 2,105 | |
| American Health Staffing Group, Inc. | (10) | Healthcare Temporary Staffing | | | | | | | | | | | | |
| | | Secured Debt | (9) | 11/19/2021 | | | L+ | 6.00% | | 11/19/2026 | — | | (13) | | (13) | |
| | | Secured Debt | (9) | 11/19/2021 | | 11.12% | L+ | 6.00% | | 11/19/2026 | 8,271 | | 8,206 | | 8,271 | |
| | | | | | | | | | | | | 8,193 | | 8,258 | |
| American Nuts, LLC | (10) | Roaster, Mixer and Packager of Bulk Nuts and Seeds | | | | | | | | | | | | |
| | | Secured Debt | (9) | 03/11/2022 | | 10.46% | SF+ | 6.75% | | 4/10/2026 | 4,438 | | 4,416 | | 4,148 | |
| | | Secured Debt | (9) | 03/11/2022 | | 12.46% | SF+ | 8.75% | | 4/10/2026 | 4,438 | | 4,417 | | 4,161 | |
| | | | | | | | | | | | | 8,833 | | 8,309 | |
MSC INCOME FUND, INC.
Consolidated Schedule of Investments (Continued)
December 31, 2022
(dollars in thousands)
| | | | | | | | | | | | | | | | | | | | | | | | | | | | | | | | | | | | | | | | | | | | |
| Portfolio Company (1) (20) | | Business Description | Type of Investment (2) (3) (15) | | Investment Date (22) | Shares/Units | Total Rate | Reference Rate and Spread (25) | PIK Rate (19) | Maturity Date | Principal (4) | Cost (4) | Fair Value (18) |
| American Teleconferencing Services, Ltd. | (11) | Provider of Audio Conferencing and Video Collaboration Solutions | | | | | | | | | | | | |
| | | Secured Debt | (14) | 09/17/2021 | | 7.50% | L+ | 6.50% | | 1/31/2023 | 2,425 | | 2,375 | | 136 | |
| | | Secured Debt | (9) (14) | 05/19/2016 | | 7.50% | L+ | 6.50% | | 6/8/2023 | 11,693 | | 11,451 | | 658 | |
| | | | | | | | | | | | | 13,826 | | 794 | |
| ArborWorks, LLC | (10) | Vegetation Management Services | | | | | | | | | | | | |
| | | Secured Debt | (9) | 11/09/2021 | | 13.41% | L+ | 9.00% | | 11/9/2026 | 2,484 | | 2,427 | | 2,095 | |
| | | Secured Debt | (9) | 11/09/2021 | | 13.56% | L+ | 9.00% | | 11/9/2026 | 15,786 | | 15,540 | | 13,313 | |
| | | Common Equity | | 11/09/2021 | 124 | | | | | | | 124 | | — | |
| | | | | | | | | | | | | 18,091 | | 15,408 | |
| Archer Systems, LLC | (10) | Mass Tort Settlement Administration Solutions Provider | | | | | | | | | | | | |
| | | Secured Debt | (9) | 08/11/2022 | | | SF+ | 6.50% | | 8/11/2027 | — | | (4) | | (4) | |
| | | Secured Debt | (9) | 08/11/2022 | | 10.92% | SF+ | 6.50% | | 8/11/2027 | 2,205 | | 2,165 | | 2,170 | |
| | | Common Stock | | 08/11/2022 | 62,402 | | | | | | | 62 | | 62 | |
| | | | | | | | | | | | | 2,223 | | 2,228 | |
| ATS Operating, LLC | (10) | For-Profit Thrift Retailer | | | | | | | | | | | | |
| | | Secured Debt | (9) | 01/18/2022 | | | SF+ | 5.50% | | 1/18/2027 | — | | — | | — | |
| | | Secured Debt | (9) | 01/18/2022 | | 9.32% | SF+ | 5.50% | | 1/18/2027 | 925 | | 907 | | 914 | |
| | | Secured Debt | (9) | 01/18/2022 | | 11.32% | SF+ | 7.50% | | 1/18/2027 | 925 | | 907 | | 916 | |
| | | Common Stock | | 01/18/2022 | 100,000 | | | | | | | 100 | | 90 | |
| | | | | | | | | | | | | 1,914 | | 1,920 | |
| AVEX Aviation Holdings, LLC | (10) | Specialty Aircraft Dealer | | | | | | | | | | | | |
| | | Secured Debt | (9) | 12/23/2022 | | | SF+ | 7.25% | | 12/23/2027 | — | | (8) | | (8) | |
| | | Secured Debt | (9) | 12/23/2022 | | 12.17% | SF+ | 7.25% | | 12/23/2027 | 4,038 | | 3,876 | | 3,876 | |
| | | Common Equity | | 12/15/2021 | 50 | | | | | | | 50 | | 56 | |
| | | | | | | | | | | | | 3,918 | | 3,924 | |
| BBB Tank Services, LLC | | Maintenance, Repair and Construction Services to the Above-Ground Storage Tank Market | | | | | | | | | | | | |
| | | Unsecured Debt | (9) (17) | 04/08/2016 | | 15.12% | L+ | 11.00% | | 4/8/2021 | 200 | | 200 | | 200 | |
| | | Unsecured Debt | (9) (17) | 04/08/2016 | | 15.12% | L+ | 11.00% | | 4/8/2021 | 1,000 | | 1,000 | | 522 | |
| | | Preferred Stock (non-voting) | | 12/17/2018 | | 15.00% | | | | | | 41 | | — | |
| | | Member Units | | 04/08/2016 | 200,000 | | | | | | | 200 | | — | |
| | | | | | | | | | | | | 1,441 | | 722 | |
| Berry Aviation, Inc. | (10) | Charter Airline Services | | | | | | | | | | | | |
| | | Secured Debt | | 07/06/2018 | | 12.00% | | | 1.50% | 1/6/2024 | 190 | | 189 | | 190 | |
| | | Preferred Member Units | (8) (23) | 11/12/2019 | 122,416 | | | | 16.00% | | | — | | 270 | |
| | | Preferred Member Units | (8) (23) | 07/06/2018 | 1,548,387 | 8.00% | | | 8.00% | | | 1,161 | | 4,561 | |
| | | | | | | | | | | | | 1,350 | | 5,021 | |
| Bettercloud, Inc. | (10) | SaaS Provider of Workflow Management and Business Application Solutions | | | | | | | | | | | | |
| | | Secured Debt | (9) | 06/30/2022 | | | SF+ | 1.00% | 6.00% | 6/30/2028 | — | | (22) | | (22) | |
MSC INCOME FUND, INC.
Consolidated Schedule of Investments (Continued)
December 31, 2022
(dollars in thousands)
| | | | | | | | | | | | | | | | | | | | | | | | | | | | | | | | | | | | | | | | | | | | |
| Portfolio Company (1) (20) | | Business Description | Type of Investment (2) (3) (15) | | Investment Date (22) | Shares/Units | Total Rate | Reference Rate and Spread (25) | PIK Rate (19) | Maturity Date | Principal (4) | Cost (4) | Fair Value (18) |
| | | Secured Debt | (9) | 06/30/2022 | | 11.40% | SF+ | 1.00% | 6.00% | 6/30/2028 | 7,991 | | 7,848 | | 7,991 | |
| | | | | | | | | | | | | 7,826 | | 7,969 | |
| Binswanger Enterprises, LLC | (10) | Glass Repair and Installation Service Provider | | | | | | | | | | | | |
| | | Member Units | | 03/10/2017 | 1,050,000 | | | | | | | 1,050 | | 420 | |
| | | | | | | | | | | | | | |
| Bluestem Brands, Inc. | (11) | Multi-Channel Retailer of General Merchandise | | | | | | | | | | | | |
| | | Secured Debt | (9) | 10/19/2022 | | | L+ | 8.50% | | 8/28/2025 | — | | — | | — | |
| | | Secured Debt | (9) | 08/28/2020 | | 12.94% | L+ | 8.50% | | 8/28/2025 | 3,473 | | 2,455 | | 3,366 | |
| | | Common Stock | (8) | 10/01/2020 | 700,446 | | | | | | | — | | 4,708 | |
| | | Warrants | (27) | 10/19/2022 | 175,110 | | | | | 10/19/2032 | | 1,111 | | 1,173 | |
| | | | | | | | | | | | | 3,566 | | 9,247 | |
| Boccella Precast Products LLC | | Manufacturer of Precast Hollow Core Concrete | | | | | | | | | | | | |
| | | Secured Debt | | 09/23/2021 | | 10.00% | | | | 2/28/2027 | 80 | | 80 | | 80 | |
| | | Member Units | (8) | 06/30/2017 | 540,000 | | | | | | | 564 | | 741 | |
| | | | | | | | | | | | | 644 | | 821 | |
| Brightwood Capital Fund Investments | (12) (13) | Investment Partnership | | | | | | | | | | | | |
| | | LP Interests (Brightwood Capital Fund III, LP) | (8) (24) | 07/21/2014 | 0.5% | | | | | | | 2,449 | | 1,576 | |
| | | LP Interests (Brightwood Capital Fund IV, LP) | (8) (24) | 10/26/2016 | 1.2% | | | | | | | 8,737 | | 9,082 | |
| | | | | | | | | | | | | 11,186 | | 10,658 | |
| Buca C, LLC | | Casual Restaurant Group | | | | | | | | | | | | |
| | | Secured Debt | | 06/30/2015 | | 9.00% | | | | 6/30/2023 | 11,740 | | 11,740 | | 8,345 | |
| | | Preferred Member Units | | 06/30/2015 | 4 | 6.00% | | | 6.00% | | | 3,040 | | — | |
| | | | | | | | | | | | | 14,780 | | 8,345 | |
| Burning Glass Intermediate Holding Company, Inc. | (10) | Provider of Skills-Based Labor Market Analytics | | | | | | | | | | | | |
| | | Secured Debt | (9) | 06/14/2021 | | | L+ | 5.00% | | 6/10/2026 | — | | (19) | | — | |
| | | Secured Debt | (9) | 06/14/2021 | | 8.91% | L+ | 5.00% | | 6/10/2028 | 13,255 | | 13,070 | | 13,255 | |
| | | | | | | | | | | | | 13,051 | | 13,255 | |
| Cadence Aerospace LLC | (10) | Aerostructure Manufacturing | | | | | | | | | | | | |
| | | Secured Debt | (9) (30) | 11/14/2017 | | 11.99% | L+ | 8.50% | 0.01% | 11/14/2023 | 20,112 | | 20,066 | | 20,112 | |
| | | | | | | | | | | | | | |
| CAI Software LLC | | Provider of Specialized Enterprise Resource Planning Software | | | | | | | | | | | | |
| | | Preferred Equity | (8) | 12/13/2021 | 379,338 | | | | | | | 379 | | 379 | |
| | | Preferred Equity | | 12/13/2021 | 126,446 | | | | | | | — | | — | |
| | | | | | | | | | | | | 379 | | 379 | |
MSC INCOME FUND, INC.
Consolidated Schedule of Investments (Continued)
December 31, 2022
(dollars in thousands)
| | | | | | | | | | | | | | | | | | | | | | | | | | | | | | | | | | | | | | | | | | | | |
| Portfolio Company (1) (20) | | Business Description | Type of Investment (2) (3) (15) | | Investment Date (22) | Shares/Units | Total Rate | Reference Rate and Spread (25) | PIK Rate (19) | Maturity Date | Principal (4) | Cost (4) | Fair Value (18) |
| Camin Cargo Control, Inc. | (11) | Provider of Mission Critical Inspection, Testing and Fuel Treatment Services | | | | | | | | | | | | |
| | | Secured Debt | (9) | 06/14/2021 | | 10.88% | L+ | 6.50% | | 6/4/2026 | 7,609 | | 7,553 | | 7,342 | |
| | | | | | | | | | | | | | |
| Career Team Holdings, LLC | | Provider of Workforce Training and Career Development Services | | | | | | | | | | | | |
| | | Secured Debt | (9) | 12/17/2021 | | | L+ | 6.00% | | 12/17/2026 | — | | (3) | | (3) | |
| | | Secured Debt | | 12/17/2021 | | 12.50% | | | | 12/17/2026 | 2,250 | | 2,196 | | 2,196 | |
| | | Common Stock | | 12/17/2021 | 50,000 | | | | | | | 500 | | 500 | |
| | | | | | | | | | | | | 2,693 | | 2,693 | |
| CaseWorthy, Inc. | (10) | SaaS Provider of Case Management Solutions | | | | | | | | | | | | |
| | | Secured Debt | (9) | 05/18/2022 | | | L+ | 6.00% | | 5/18/2027 | — | | (4) | | (4) | |
| | | Secured Debt | (9) | 05/18/2022 | | 10.73% | L+ | 6.00% | | 5/18/2027 | 2,600 | | 2,574 | | 2,574 | |
| | | Secured Debt | (9) | 05/18/2022 | | 10.48% | L+ | 5.75% | | 5/18/2027 | 1,995 | | 1,977 | | 1,995 | |
| | | Common Equity | | 12/30/2022 | 80,000 | | | | | | | 80 | | 80 | |
| | | | | | | | | | | | | 4,627 | | 4,645 | |
| Channel Partners Intermediateco, LLC | (10) | Outsourced Consumer Services Provider | | | | | | | | | | | | |
| | | Secured Debt | (9) (34) | 02/07/2022 | | 10.72% | SF+ | 6.25% | | 2/7/2027 | 172 | | 162 | | 169 | |
| | | Secured Debt | (9) (35) | 02/07/2022 | | 10.71% | SF+ | 6.25% | | 2/7/2027 | 3,591 | | 3,530 | | 3,539 | |
| | | | | | | | | | | | | 3,692 | | 3,708 | |
| Clarius BIGS, LLC | (10) | Prints & Advertising Film Financing | | | | | | | | | | | | |
| | | Secured Debt | (14) (17) | 09/23/2014 | | 15.00% | | | 15.00% | 1/5/2015 | 2,747 | | 2,403 | | 19 | |
| | | | | | | | | | | | | | |
| Classic H&G Holdings, LLC | | Provider of Engineered Packaging Solutions | | | | | | | | | | | | |
| | | Secured Debt | (9) | 03/12/2020 | | 9.75% | L+ | 6.00% | | 3/12/2025 | 1,140 | | 1,127 | | 1,140 | |
| | | Secured Debt | | 03/12/2020 | | 8.00% | | | | 3/12/2025 | 4,819 | | 4,754 | | 4,819 | |
| | | Preferred Member Units | (8) | 03/12/2020 | 39 | | | | | | | 1,440 | | 6,160 | |
| | | | | | | | | | | | | 7,321 | | 12,119 | |
| Computer Data Source, LLC | (10) | Third Party Maintenance Provider to the Data Center Ecosystem | | | | | | | | | | | | |
| | | Secured Debt | (9) (36) | 08/06/2021 | | 12.56% | L+ | 8.00% | | 8/6/2026 | 4,167 | | 4,106 | | 3,851 | |
| | | Secured Debt | (9) | 08/06/2021 | | 12.56% | L+ | 8.00% | | 8/6/2026 | 15,604 | | 15,374 | | 14,421 | |
| | | | | | | | | | | | | 19,480 | | 18,272 | |
| Construction Supply Investments, LLC | (10) | Distribution Platform of Specialty Construction Materials to Professional Concrete and Masonry Contractors | | | | | | | | | | | | |
| | | Member Units | (8) | 12/29/2016 | 861,618 | | | | | | | 3,335 | | 21,165 | |
| | | | | | | | | | | | | | |
| Dalton US Inc. | (10) | Provider of Supplemental Labor Services | | | | | | | | | | | | |
MSC INCOME FUND, INC.
Consolidated Schedule of Investments (Continued)
December 31, 2022
(dollars in thousands)
| | | | | | | | | | | | | | | | | | | | | | | | | | | | | | | | | | | | | | | | | | | | |
| Portfolio Company (1) (20) | | Business Description | Type of Investment (2) (3) (15) | | Investment Date (22) | Shares/Units | Total Rate | Reference Rate and Spread (25) | PIK Rate (19) | Maturity Date | Principal (4) | Cost (4) | Fair Value (18) |
| | | Secured Debt | (9) | 08/16/2022 | | 11.90% | SF+ | 8.00% | | 8/16/2027 | 79 | | 63 | | 78 | |
| | | Secured Debt | (9) | 08/16/2022 | | | SF+ | 8.00% | | 8/16/2027 | — | | (5) | | (5) | |
| | | Secured Debt | (9) | 08/16/2022 | | 12.56% | SF+ | 8.00% | | 8/16/2027 | 1,035 | | 1,016 | | 1,020 | |
| | | Common Stock | | 08/16/2022 | 14 | | | | | | | 14 | | 14 | |
| | | | | | | | | | | | | 1,088 | | 1,107 | |
| DMA Industries, LLC | | Distributor of aftermarket ride control products | | | | | | | | | | | | |
| | | Secured Debt | | 11/19/2021 | | 12.00% | | | | 11/19/2026 | 5,300 | | 5,217 | | 5,300 | |
| | | Preferred Equity | | 11/19/2021 | 1,486 | | | | | | | 1,486 | | 1,820 | |
| | | | | | | | | | | | | 6,703 | | 7,120 | |
| DTE Enterprises, LLC | (10) | Industrial Powertrain Repair and Services | | | | | | | | | | | | |
| | | Secured Debt | (9) | 04/13/2018 | | | L+ | 7.50% | | 4/13/2023 | — | | (1) | | (1) | |
| | | Secured Debt | (9) | 04/13/2018 | | 12.24% | L+ | 7.50% | | 4/13/2023 | 6,119 | | 6,110 | | 5,978 | |
| | | Class AA Preferred Member Units (non-voting) | (8) | 04/13/2018 | | 10.00% | | | 10.00% | | | 1,161 | | 1,161 | |
| | | Class A Preferred Member Units | | 04/13/2018 | 776,316 | 8.00% | | | 8.00% | | | 776 | | 380 | |
| | | | | | | | | | | | | 8,046 | | 7,518 | |
| Dynamic Communities, LLC | (10) | Developer of Business Events and Online Community Groups | | | | | | | | | | | | |
| | | Secured Debt | (9) | 12/20/2022 | | 9.18% | SF+ | 4.50% | 9.18% | 12/31/2026 | 1,875 | | 1,717 | | 1,717 | |
| | | Secured Debt | (9) | 12/20/2022 | | 11.18% | SF+ | 6.50% | 11.18% | 12/31/2026 | 1,875 | | 1,642 | | 1,642 | |
| | | Preferred Equity | | 12/20/2022 | 125,000 | | | | | | | 128 | | 128 | |
| | | Preferred Equity | | 12/20/2022 | 2,376,241 | | | | | | | — | | — | |
| | | Common Equity | | 12/20/2022 | 1,250,000 | | | | | | | — | | — | |
| | | | | | | | | | | | | 3,487 | | 3,487 | |
| Elgin AcquireCo, LLC | | Manufacturer and Distributor of Engine and Chassis Components | | | | | | | | | | | | |
| | | Secured Debt | (9) | 10/03/2022 | | | SF+ | 6.00% | | 10/3/2027 | — | | (1) | | (1) | |
| | | Secured Debt | | 10/03/2022 | | 12.00% | | | | 10/3/2027 | 1,227 | | 1,192 | | 1,192 | |
| | | Secured Debt | | 10/03/2022 | | 9.00% | | | | 10/3/2052 | 415 | | 411 | | 411 | |
| | | Common Stock | | 10/03/2022 | 25 | | | | | | | 497 | | 497 | |
| | | Common Stock | (23) | 10/03/2022 | 61 | | | | | | | 102 | | 102 | |
| | | | | | | | | | | | | 2,201 | | 2,201 | |
| Emerald Technologies Acquisition Co, Inc. | (11) | Design & Manufacturing | | | | | | | | | | | | |
| | | Secured Debt | (9) | 02/10/2022 | | 10.67% | SF+ | 6.25% | | 2/10/2028 | 2,453 | | 2,411 | | 2,328 | |
| | | | | | | | | | | | | | |
| Engineering Research & Consulting, LLC | (10) | Provider of Engineering & Consulting Services to US Department of Defense | | | | | | | | | | | | |
| | | Secured Debt | (9) | 05/23/2022 | | 11.68% | SF+ | 6.50% | | 5/23/2027 | 41 | | 27 | | 41 | |
| | | Secured Debt | (9) | 05/23/2022 | | 10.92% | SF+ | 6.50% | | 5/23/2028 | 5,159 | | 5,070 | | 5,159 | |
| | | | | | | | | | | | | 5,097 | | 5,200 | |
MSC INCOME FUND, INC.
Consolidated Schedule of Investments (Continued)
December 31, 2022
(dollars in thousands)
| | | | | | | | | | | | | | | | | | | | | | | | | | | | | | | | | | | | | | | | | | | | |
| Portfolio Company (1) (20) | | Business Description | Type of Investment (2) (3) (15) | | Investment Date (22) | Shares/Units | Total Rate | Reference Rate and Spread (25) | PIK Rate (19) | Maturity Date | Principal (4) | Cost (4) | Fair Value (18) |
| EPIC Y-Grade Services, LP | (11) | NGL Transportation & Storage | | | | | | | | | | | | |
| | | Secured Debt | (9) | 06/22/2018 | | 10.70% | L+ | 6.00% | | 6/30/2027 | 6,840 | | 6,777 | | 6,156 | |
| | | | | | | | | | | | | | |
| Event Holdco, LLC | (10) | Event and Learning Management Software for Healthcare Organizations and Systems | | | | | | | | | | | | |
| | | Secured Debt | (9) (23) | 12/22/2021 | | 10.67% | L+ | 7.00% | | 12/22/2026 | 308 | | 305 | | 292 | |
| | | Secured Debt | (9) (23) | 12/22/2021 | | 10.67% | L+ | 7.00% | | 12/22/2026 | 3,692 | | 3,663 | | 3,507 | |
| | | | | | | | | | | | | 3,968 | | 3,799 | |
| Flip Electronics LLC | (10) | Distributor of Hard-to-Find and Obsolete Electronic Components | | | | | | | | | | | | |
| | | Secured Debt | (9) | 03/24/2022 | | 11.21% | SF+ | 7.50% | | 1/2/2026 | 818 | | 818 | | 818 | |
| | | Secured Debt | (9) | 01/04/2021 | | 12.19% | SF+ | 7.50% | | 1/2/2026 | 12,327 | | 12,055 | | 12,327 | |
| | | | | | | | | | | | | 12,873 | | 13,145 | |
| Hawk Ridge Systems, LLC | | Value-Added Reseller of Engineering Design and Manufacturing Solutions | | | | | | | | | | | | |
| | | Secured Debt | (9) | 12/02/2016 | | 10.13% | L+ | 6.00% | | 1/15/2026 | 796 | | 796 | | 796 | |
| | | Secured Debt | | 12/02/2016 | | 9.00% | | | | 1/15/2026 | 8,200 | | 8,147 | | 8,200 | |
| | | Preferred Member Units | (8) | 12/02/2016 | 56 | | | | | | | 713 | | 4,370 | |
| | | Preferred Member Units | (23) | 12/02/2016 | 56 | | | | | | | 38 | | 230 | |
| | | | | | | | | | | | | 9,694 | | 13,596 | |
| HDC/HW Intermediate Holdings | (10) | Managed Services and Hosting Provider | | | | | | | | | | | | |
| | | Secured Debt | (9) | 12/21/2018 | | 14.34% | SF+ | 9.50% | 2.00% | 12/21/2023 | 180 | | 179 | | 175 | |
| | | Secured Debt | (9) | 12/21/2018 | | 14.34% | SF+ | 9.50% | 2.00% | 12/21/2023 | 1,780 | | 1,772 | | 1,731 | |
| | | | | | | | | | | | | 1,951 | | 1,906 | |
| HEADLANDS OP-CO LLC | (10) | Clinical Trial Sites Operator | | | | | | | | | | | | |
| | | Secured Debt | (9) | 08/01/2022 | | | SF+ | 6.50% | | 8/1/2027 | — | | (18) | | (18) | |
| | | Secured Debt | (9) | 08/01/2022 | | | SF+ | 6.50% | | 8/1/2027 | — | | (18) | | (18) | |
| | | Secured Debt | (9) | 08/01/2022 | | 10.62% | SF+ | 6.50% | | 8/1/2027 | 4,975 | | 4,884 | | 4,975 | |
| | | | | | | | | | | | | 4,848 | | 4,939 | |
| Hybrid Promotions, LLC | (10) | Wholesaler of Licensed, Branded and Private Label Apparel | | | | | | | | | | | | |
| | | Secured Debt | | 06/30/2021 | | 12.07% | SF+ | 8.25% | | 6/30/2026 | 7,875 | | 7,762 | | 6,826 | |
| | | | | | | | | | | | | | |
| IG Parent Corporation | (11) | Software Engineering | | | | | | | | | | | | |
| | | Secured Debt | (9) (37) | 07/30/2021 | | 10.17% | SF+ | 5.75% | | 7/30/2026 | 465 | | 447 | | 465 | |
| | | Secured Debt | (9) | 07/30/2021 | | 10.17% | SF+ | 5.75% | | 7/30/2028 | 8,291 | | 8,186 | | 8,291 | |
| | | | | | | | | | | | | 8,633 | | 8,756 | |
| Implus Footcare, LLC | (10) | Provider of Footwear and Related Accessories | | | | | | | | | | | | |
| | | Secured Debt | (9) | 06/01/2017 | | 13.98% | L+ | 7.75% | 1.50% | 4/30/2024 | 16,921 | | 16,914 | | 15,961 | |
| | | | | | | | | | | | | | |
MSC INCOME FUND, INC.
Consolidated Schedule of Investments (Continued)
December 31, 2022
(dollars in thousands)
| | | | | | | | | | | | | | | | | | | | | | | | | | | | | | | | | | | | | | | | | | | | |
| Portfolio Company (1) (20) | | Business Description | Type of Investment (2) (3) (15) | | Investment Date (22) | Shares/Units | Total Rate | Reference Rate and Spread (25) | PIK Rate (19) | Maturity Date | Principal (4) | Cost (4) | Fair Value (18) |
| Independent Pet Partners Intermediate Holdings, LLC | (10) | Omnichannel Retailer of Specialty Pet Products | | | | | | | | | | | | |
| | | Secured Debt | | 11/28/2022 | | 14.42% | SF+ | 10.00% | 14.42% | 2/27/2023 | 481 | | 459 | | 459 | |
| | | Secured Debt | (14) | 12/10/2020 | | 6.00% | | | 6.00% | 11/20/2023 | 10,902 | | 10,443 | | 4,515 | |
| | | Preferred Stock (non-voting) | | 12/10/2020 | | 6.00% | | | 6.00% | | | 2,470 | | — | |
| | | Preferred Stock (non-voting) | | 12/10/2020 | | | | | | | | — | | — | |
| | | Member Units | | 11/20/2018 | 1,191,667 | | | | | | | 1,192 | | — | |
| | | Warrants | | 11/20/2018 | 185,757 | | | | | 11/19/2028 | | — | | — | |
| | | | | | | | | | | | | 14,564 | | 4,974 | |
| Industrial Services Acquisition, LLC | (10) | Industrial Cleaning Services | | | | | | | | | | | | |
| | | Secured Debt | (9) | 08/13/2021 | | 11.50% | L+ | 6.75% | | 8/13/2026 | 387 | | 359 | | 387 | |
| | | Secured Debt | (9) | 08/13/2021 | | 11.50% | L+ | 6.75% | | 8/13/2026 | 10,871 | | 10,738 | | 10,871 | |
| | | Preferred Member Units | (8) (23) | 01/31/2018 | 336 | 10.00% | | | 10.00% | | | 301 | | 338 | |
| | | Preferred Member Units | (8) (23) | 05/17/2019 | 187 | 20.00% | | | 20.00% | | | 215 | | 217 | |
| | | Member Units | (23) | 06/17/2016 | 2,100 | | | | | | | 2,100 | | 1,400 | |
| | | | | | | | | | | | | 13,713 | | 13,213 | |
| Infolinks Media Buyco, LLC | (10) | Exclusive Placement Provider to the Advertising Ecosystem | | | | | | | | | | | | |
| | | Secured Debt | (9) | 11/01/2021 | | | L+ | 5.50% | | 11/1/2026 | — | | (48) | | (48) | |
| | | Secured Debt | (9) | 11/01/2021 | | 10.23% | L+ | 5.50% | | 11/1/2026 | 10,742 | | 10,576 | | 10,742 | |
| | | | | | | | | | | | | 10,528 | | 10,694 | |
| Interface Security Systems, L.L.C | (10) | Commercial Security & Alarm Services | | | | | | | | | | | | |
| | | Secured Debt | (38) | 12/09/2021 | | 14.22% | L+ | 10.00% | | 8/7/2023 | 1,682 | | 1,682 | | 1,682 | |
| | | Secured Debt | (9) (14) | 08/07/2019 | | 12.07% | L+ | 7.00% | 1.00% | 8/7/2023 | 7,334 | | 7,254 | | 1,085 | |
| | | Common Stock | | 12/07/2021 | 2,143 | | | | | | | — | | — | |
| | | | | | | | | | | | | 8,936 | | 2,767 | |
| Intermedia Holdings, Inc. | (11) | Unified Communications as a Service | | | | | | | | | | | | |
| | | Secured Debt | (9) | 08/03/2018 | | 10.38% | L+ | 6.00% | | 7/19/2025 | 5,621 | | 5,613 | | 4,342 | |
| | | | | | | | | | | | | | |
| Invincible Boat Company, LLC. | (10) | Manufacturer of Sport Fishing Boats | | | | | | | | | | | | |
| | | Secured Debt | (9) | 08/28/2019 | | 10.14% | L+ | 6.50% | | 8/28/2025 | 622 | | 618 | | 622 | |
| | | Secured Debt | (9) | 08/28/2019 | | 10.17% | L+ | 6.50% | | 8/28/2025 | 17,148 | | 17,050 | | 17,148 | |
| | | | | | | | | | | | | 17,668 | | 17,770 | |
| INW Manufacturing, LLC | (11) | Manufacturer of Nutrition and Wellness Products | | | | | | | | | | | | |
| | | Secured Debt | (9) | 05/19/2021 | | 10.48% | L+ | 5.75% | | 3/25/2027 | 6,984 | | 6,825 | | 5,972 | |
| | | | | | | | | | | | | | |
| Iron-Main Investments, LLC | | Consumer Reporting Agency Providing Employment Background Checks and Drug Testing | | | | | | | | | | | | |
| | | Secured Debt | | 08/02/2021 | | 12.50% | | | | 11/15/2026 | 1,133 | | 1,108 | | 1,108 | |
| | | Secured Debt | | 09/01/2021 | | 12.50% | | | | 11/15/2026 | 788 | | 771 | | 771 | |
MSC INCOME FUND, INC.
Consolidated Schedule of Investments (Continued)
December 31, 2022
(dollars in thousands)
| | | | | | | | | | | | | | | | | | | | | | | | | | | | | | | | | | | | | | | | | | | | |
| Portfolio Company (1) (20) | | Business Description | Type of Investment (2) (3) (15) | | Investment Date (22) | Shares/Units | Total Rate | Reference Rate and Spread (25) | PIK Rate (19) | Maturity Date | Principal (4) | Cost (4) | Fair Value (18) |
| | | Secured Debt | | 11/15/2021 | | 12.50% | | | | 11/15/2026 | 2,236 | | 2,236 | | 2,236 | |
| | | Secured Debt | | 11/15/2021 | | 12.50% | | | | 11/15/2026 | 4,928 | | 4,813 | | 4,813 | |
| | | Common Stock | | 08/03/2021 | 44,944 | | | | | | | 449 | | 449 | |
| | | | | | | | | | | | | 9,377 | | 9,377 | |
| Isagenix International, LLC | (11) | Direct Marketer of Health & Wellness Products | | | | | | | | | | | | |
| | | Secured Debt | (9) (14) | 06/21/2018 | | 9.93% | L+ | 7.75% | | 6/14/2025 | 5,053 | | 5,034 | | 1,537 | |
| | | | | | | | | | | | | | |
| Jackmont Hospitality, Inc. | (10) | Franchisee of Casual Dining Restaurants | | | | | | | | | | | | |
| | | Secured Debt | (9) | 10/26/2022 | | 12.23% | L+ | 7.50% | | 11/4/2024 | 1,000 | | 965 | | 1,000 | |
| | | Secured Debt | (9) | 11/08/2021 | | 12.23% | L+ | 7.50% | | 11/4/2024 | 4,126 | | 4,126 | | 4,126 | |
| | | Preferred Equity | (8) | 11/08/2021 | 5,653,333 | 12.00% | | | 12.00% | | | 242 | | 1,247 | |
| | | | | | | | | | | | | 5,333 | | 6,373 | |
| Joerns Healthcare, LLC | (11) | Manufacturer and Distributor of Health Care Equipment & Supplies | | | | | | | | | | | | |
| | | Secured Debt | | 11/15/2021 | | 18.00% | | | | 1/31/2024 | 1,935 | | 1,935 | | 1,935 | |
| | | Secured Debt | (14) | 08/21/2019 | | 19.75% | | | 19.75% | 8/21/2024 | 3,351 | | 3,325 | | 418 | |
| | | Common Stock | | 08/21/2019 | 392,514 | | | | | | | 3,678 | | — | |
| | | | | | | | | | | | | 8,938 | | 2,353 | |
| Johnson Downie Opco, LLC | | Executive Search Services | | | | | | | | | | | | |
| | | Secured Debt | (9) | 12/10/2021 | | | L+ | 11.50% | | 12/10/2026 | — | | (3) | | — | |
| | | Secured Debt | (9) | 12/10/2021 | | 15.63% | L+ | 11.50% | | 12/10/2026 | 1,111 | | 1,093 | | 1,111 | |
| | | Preferred Equity | (8) | 12/10/2021 | 350 | | | | | | | 350 | | 620 | |
| | | | | | | | | | | | | 1,440 | | 1,731 | |
| JorVet Holdings, LLC | | Supplier and Distributor of Veterinary Equipment and Supplies | | | | | | | | | | | | |
| | | Secured Debt | | 03/28/2022 | | 12.00% | | | | 3/28/2027 | 2,850 | | 2,802 | | 2,802 | |
| | | Preferred Equity | (8) | 03/28/2022 | 11,934 | | | | | | | 1,193 | | 1,193 | |
| | | | | | | | | | | | | 3,995 | | 3,995 | |
| JTI Electrical & Mechanical, LLC | (10) | Electrical, Mechanical and Automation Services | | | | | | | | | | | | |
| | | Secured Debt | (9) | 12/22/2021 | | | L+ | 6.00% | | 12/22/2026 | — | | (11) | | (11) | |
| | | Secured Debt | (9) | 12/22/2021 | | 10.73% | L+ | 6.00% | | 12/22/2026 | 3,059 | | 3,010 | | 3,059 | |
| | | Common Equity | | 12/22/2021 | 140,351 | | | | | | | 140 | | 240 | |
| | | | | | | | | | | | | 3,139 | | 3,288 | |
| KMS, LLC | (10) | Wholesaler of Closeout and Value-priced Products | | | | | | | | | | | | |
| | | Secured Debt | (9) | 10/04/2021 | | 12.00% | L+ | 7.25% | | 10/4/2026 | 1,330 | | 1,250 | | 1,244 | |
| | | Secured Debt | (9) | 10/04/2021 | | 12.00% | L+ | 7.25% | | 10/4/2026 | 9,381 | | 9,238 | | 8,778 | |
| | | | | | | | | | | | | 10,488 | | 10,022 | |
| Lightbox Holdings, L.P. | (11) | Provider of Commercial Real Estate Software | | | | | | | | | | | | |
| | | Secured Debt | | 05/09/2019 | | 9.73% | L+ | 5.00% | | 5/9/2026 | 5,826 | | 5,783 | | 5,622 | |
| | | | | | | | | | | | | | |
MSC INCOME FUND, INC.
Consolidated Schedule of Investments (Continued)
December 31, 2022
(dollars in thousands)
| | | | | | | | | | | | | | | | | | | | | | | | | | | | | | | | | | | | | | | | | | | | |
| Portfolio Company (1) (20) | | Business Description | Type of Investment (2) (3) (15) | | Investment Date (22) | Shares/Units | Total Rate | Reference Rate and Spread (25) | PIK Rate (19) | Maturity Date | Principal (4) | Cost (4) | Fair Value (18) |
| LL Management, Inc. | (10) | Medical Transportation Service Provider | | | | | | | | | | | | |
| | | Secured Debt | (9) | 05/02/2019 | | 11.21% | SF+ | 7.25% | | 9/25/2023 | 8,003 | | 7,987 | | 7,945 | |
| | | Secured Debt | (9) | 05/02/2019 | | 11.67% | SF+ | 7.25% | | 9/25/2023 | 6,164 | | 6,148 | | 6,119 | |
| | | Secured Debt | (9) | 05/12/2022 | | 11.67% | SF+ | 7.25% | | 9/25/2023 | 8,884 | | 8,809 | | 8,820 | |
| | | | | | | | | | | | | 22,944 | | 22,884 | |
| LLFlex, LLC | (10) | Provider of Metal-Based Laminates | | | | | | | | | | | | |
| | | Secured Debt | (9) | 08/16/2021 | | 12.74% | L+ | 9.00% | | 8/16/2026 | 4,938 | | 4,856 | | 4,833 | |
| | | | | | | | | | | | | | |
| Logix Acquisition Company, LLC | (10) | Competitive Local Exchange Carrier | | | | | | | | | | | | |
| | | Secured Debt | (9) | 01/08/2018 | | 10.13% | L+ | 5.75% | | 12/22/2024 | 9,506 | | 9,476 | | 7,843 | |
| | | | | | | | | | | | | | |
| Mako Steel, LP | (10) | Self-Storage Design & Construction | | | | | | | | | | | | |
| | | Secured Debt | (9) (31) | 03/15/2021 | | 11.79% | L+ | 7.25% | | 3/15/2026 | 3,448 | | 3,395 | | 3,426 | |
| | | Secured Debt | (9) | 03/15/2021 | | 11.09% | L+ | 7.25% | | 3/15/2026 | 17,070 | | 16,845 | | 16,959 | |
| | | | | | | | | | | | | 20,240 | | 20,385 | |
| MB2 Dental Solutions, LLC | (11) | Dental Partnership Organization | | | | | | | | | | | | |
| | | Secured Debt | (9) | 01/28/2021 | | 10.42% | SF+ | 6.00% | | 1/29/2027 | 8,359 | | 8,223 | | 8,359 | |
| | | Secured Debt | (9) | 01/28/2021 | | 10.42% | SF+ | 6.00% | | 1/29/2027 | 7,876 | | 7,783 | | 7,876 | |
| | | | | | | | | | | | | 16,006 | | 16,235 | |
| MetalForming AcquireCo, LLC | | Distributor of Sheet Metal Folding and Metal Forming Equipment | | | | | | | | | | | | |
| | | Secured Debt | | 10/19/2022 | | | | | | 10/19/2024 | — | | (1) | | (1) | |
| | | Secured Debt | | 10/19/2022 | | 12.75% | | | | 10/19/2027 | 1,748 | | 1,697 | | 1,697 | |
| | | Preferred Equity | (8) | 10/19/2022 | 434,331 | 8.00% | | | 8.00% | | | 441 | | 441 | |
| | | Common Stock | | 10/19/2022 | 112,865 | | | | | | | 113 | | 113 | |
| | | | | | | | | | | | | 2,250 | | 2,250 | |
| Microbe Formulas, LLC | (10) | Nutritional Supplements Provider | | | | | | | | | | | | |
| | | Secured Debt | (9) | 04/04/2022 | | | SF+ | 6.25% | | 4/3/2028 | — | | (7) | | (7) | |
| | | Secured Debt | (9) | 04/04/2022 | | 9.86% | SF+ | 6.25% | | 4/3/2028 | 3,142 | | 3,085 | | 3,034 | |
| | | | | | | | | | | | | 3,078 | | 3,027 | |
| Mills Fleet Farm Group, LLC | (10) | Omnichannel Retailer of Work, Farm and Lifestyle Merchandise | | | | | | | | | | | | |
| | | Secured Debt | (9) | 10/24/2018 | | 10.66% | L+ | 6.25% | | 10/24/2024 | 18,769 | | 18,559 | | 18,338 | |
| | | | | | | | | | | | | | |
| MonitorUS Holding, LLC | (10) (13) (21) | SaaS Provider of Media Intelligence Services | | | | | | | | | | | | |
| | | Secured Debt | (9) | 05/24/2022 | | | L+ | 7.00% | | 5/24/2027 | — | | (19) | | (19) | |
| | | Secured Debt | (9) | 05/24/2022 | | 11.73% | L+ | 7.00% | | 5/24/2027 | 2,882 | | 2,828 | | 3,139 | |
| | | Secured Debt | (9) | 05/24/2022 | | 11.73% | L+ | 7.00% | | 5/24/2027 | 4,906 | | 4,820 | | 4,906 | |
| | | Common Stock | | 08/30/2022 | 12,798,820 | | | | | | | 256 | | 256 | |
| | | | | | | | | | | | | 7,885 | | 8,282 | |
MSC INCOME FUND, INC.
Consolidated Schedule of Investments (Continued)
December 31, 2022
(dollars in thousands)
| | | | | | | | | | | | | | | | | | | | | | | | | | | | | | | | | | | | | | | | | | | | |
| Portfolio Company (1) (20) | | Business Description | Type of Investment (2) (3) (15) | | Investment Date (22) | Shares/Units | Total Rate | Reference Rate and Spread (25) | PIK Rate (19) | Maturity Date | Principal (4) | Cost (4) | Fair Value (18) |
| NinjaTrader, LLC | (10) | Operator of Futures Trading Platform | | | | | | | | | | | | |
| | | Secured Debt | (9) | 12/18/2019 | | | L+ | 6.25% | | 12/18/2024 | — | | (1) | | — | |
| | | Secured Debt | (9) | 12/18/2019 | | | L+ | 6.25% | | 12/18/2024 | — | | (23) | | (23) | |
| | | Secured Debt | (9) | 12/18/2019 | | 9.99% | L+ | 6.25% | | 12/18/2024 | 11,634 | | 11,524 | | 11,634 | |
| | | | | | | | | | | | | 11,500 | | 11,611 | |
| NTM Acquisition Corp. | (11) | Provider of B2B Travel Information Content | | | | | | | | | | | | |
| | | Secured Debt | (9) | 07/12/2016 | | 9.50% | L+ | 6.25% | 1.00% | 6/7/2024 | 4,036 | | 4,034 | | 3,915 | |
| | | | | | | | | | | | | | |
| NWN Corporation | (10) | Value Added Reseller and Provider of Managed Services to a Diverse Set of Industries | | | | | | | | | | | | |
| | | Secured Debt | (9) (39) | 05/07/2021 | | 10.85% | SF+ | 8.00% | | 5/7/2026 | 1,570 | | 1,519 | | 1,482 | |
| | | Secured Debt | (9) | 05/07/2021 | | 12.56% | SF+ | 8.00% | | 5/7/2026 | 20,786 | | 20,476 | | 19,620 | |
| | | Secured Debt | | 12/16/2022 | | 20.00% | | | 20.00% | 8/6/2026 | 3,226 | | 3,065 | | 3,065 | |
| | | | | | | | | | | | | 25,060 | | 24,167 | |
| OVG Business Services, LLC | (10) | Venue Management Services | | | | | | | | | | | | |
| | | Secured Debt | (9) | 11/29/2021 | | 10.64% | L+ | 6.25% | | 11/19/2028 | 17,413 | | 17,265 | | 16,368 | |
| | | | | | | | | | | | | | |
| Paragon Healthcare, Inc. | (10) | Infusion Therapy Treatment Provider | | | | | | | | | | | | |
| | | Secured Debt | (9) | 01/19/2022 | | 10.26% | SF+ | 5.75% | | 1/19/2027 | 71 | | 57 | | 70 | |
| | | Secured Debt | (9) (29) | 01/19/2022 | | 9.96% | SF+ | 5.75% | | 1/19/2027 | 356 | | 343 | | 349 | |
| | | Secured Debt | (9) | 01/19/2022 | | 9.81% | SF+ | 5.75% | | 1/19/2027 | 2,363 | | 2,304 | | 2,317 | |
| | | | | | | | | | | | | 2,704 | | 2,736 | |
| PTL US Bidco, Inc | (13) (40) | Manufacturers of Equipment, Including Drilling Rigs and Equipment, and Providers of Supplies and Services to Companies Involved In the Drilling, Evaluation and Completion of Oil and Gas Wells. | | | | | | | | | | | | |
| | | Secured Debt | (9) | 08/19/2022 | | | SF+ | 7.25% | | 8/19/2027 | — | | (12) | | (12) | |
| | | Secured Debt | (9) | 08/19/2022 | | 11.80% | SF+ | 7.25% | | 8/19/2027 | 1,852 | | 1,817 | | 1,828 | |
| | | | | | | | | | | | | 1,805 | | 1,816 | |
| RA Outdoors LLC | (10) | Software Solutions Provider for Outdoor Activity Management | | | | | | | | | | | | |
| | | Secured Debt | (9) | 04/08/2021 | | | SF+ | 6.75% | | 4/8/2026 | — | | (11) | | (11) | |
| | | Secured Debt | (9) | 04/08/2021 | | 10.56% | SF+ | 6.75% | | 4/8/2026 | 12,917 | | 12,789 | | 11,685 | |
| | | | | | | | | | | | | 12,778 | | 11,674 | |
| Research Now Group, Inc. and Survey Sampling International, LLC | (11) | Provider of Outsourced Online Surveying | | | | | | | | | | | | |
| | | Secured Debt | (9) | 12/29/2017 | | 8.84% | L+ | 5.50% | | 12/20/2024 | 9,820 | | 9,820 | | 7,434 | |
| | | | | | | | | | | | | | |
| RM Bidder, LLC | (10) | Scripted and Unscripted TV and Digital Programming Provider | | | | | | | | | | | | |
MSC INCOME FUND, INC.
Consolidated Schedule of Investments (Continued)
December 31, 2022
(dollars in thousands)
| | | | | | | | | | | | | | | | | | | | | | | | | | | | | | | | | | | | | | | | | | | | |
| Portfolio Company (1) (20) | | Business Description | Type of Investment (2) (3) (15) | | Investment Date (22) | Shares/Units | Total Rate | Reference Rate and Spread (25) | PIK Rate (19) | Maturity Date | Principal (4) | Cost (4) | Fair Value (18) |
| | | Member Units | | 11/12/2015 | 1,854 | | | | | | | 31 | | 13 | |
| | | Warrants | (26) | 11/12/2015 | 218,601 | | | | | 10/20/2025 | | 284 | | — | |
| | | | | | | | | | | | | 315 | | 13 | |
| Roof Opco, LLC | (10) | Residential Re-Roofing/Repair | | | | | | | | | | | | |
| | | Secured Debt | (9) | 08/27/2021 | | 10.97% | SF+ | 6.50% | | 8/27/2026 | 389 | | 375 | | 389 | |
| | | Secured Debt | (9) | 08/27/2021 | | 10.32% | SF+ | 6.50% | | 8/27/2026 | 2,917 | | 2,835 | | 2,917 | |
| | | Secured Debt | (9) | 08/27/2021 | | 10.32% | SF+ | 6.50% | | 8/27/2026 | 3,967 | | 3,906 | | 3,967 | |
| | | | | | | | | | | | | 7,116 | | 7,273 | |
| Rug Doctor, LLC. | (10) | Carpet Cleaning Products and Machinery | | | | | | | | | | | | |
| | | Secured Debt | (9) | 07/16/2021 | | 13.02% | SF+ | 6.25% | 2.00% | 11/16/2024 | 6,250 | | 6,212 | | 5,597 | |
| | | Secured Debt | (9) | 07/16/2021 | | 13.02% | SF+ | 6.25% | 2.00% | 11/16/2024 | 9,250 | | 9,190 | | 8,293 | |
| | | | | | | | | | | | | 15,402 | | 13,890 | |
| Savers, Inc. | (11) | For-Profit Thrift Retailer | | | | | | | | | | | | |
| | | Secured Debt | (9) | 05/14/2021 | | 10.34% | SF+ | 5.50% | | 4/26/2028 | 4,281 | | 4,270 | | 4,149 | |
| | | | | | | | | | | | | | |
| SIB Holdings, LLC | (10) | Provider of Cost Reduction Services | | | | | | | | | | | | |
| | | Secured Debt | (9) | 10/29/2021 | | 11.01% | L+ | 6.25% | | 10/29/2026 | 522 | | 511 | | 491 | |
| | | Secured Debt | (9) | 10/29/2021 | | 11.01% | L+ | 6.25% | | 10/29/2026 | 1,954 | | 1,908 | | 1,803 | |
| | | Secured Debt | (9) | 10/29/2021 | | 11.01% | L+ | 6.25% | | 10/29/2026 | 9,726 | | 9,576 | | 8,974 | |
| | | Common Equity | | 10/29/2021 | 119,048 | | | | | | | 250 | | 183 | |
| | | | | | | | | | | | | 12,245 | | 11,451 | |
| Slick Innovations, LLC | | Text Message Marketing Platform | | | | | | | | | | | | |
| | | Secured Debt | | 09/13/2018 | | 14.00% | | | | 12/22/2027 | 3,460 | | 3,334 | | 3,460 | |
| | | Common Stock | (8) | 09/13/2018 | 17,500 | | | | | | | 114 | | 400 | |
| | | | | | | | | | | | | 3,448 | | 3,860 | |
| South Coast Terminals Holdings, LLC | (10) | Specialty Toll Chemical Manufacturer | | | | | | | | | | | | |
| | | Secured Debt | (9) | 12/10/2021 | | | L+ | 5.75% | | 12/13/2026 | — | | (6) | | (6) | |
| | | Secured Debt | (9) | 12/10/2021 | | 9.69% | L+ | 5.75% | | 12/13/2026 | 3,523 | | 3,467 | | 3,523 | |
| | | Common Equity | | 12/10/2021 | 60,606 | | | | | | | 61 | | 92 | |
| | | | | | | | | | | | | 3,522 | | 3,609 | |
| SPAU Holdings, LLC | (10) | Digital Photo Product Provider | | | | | | | | | | | | |
| | | Secured Debt | (9) | 07/01/2022 | | | SF+ | 7.50% | | 7/1/2027 | — | | (18) | | (18) | |
| | | Secured Debt | (9) | 07/01/2022 | | 11.06% | SF+ | 7.50% | | 7/1/2027 | 4,975 | | 4,887 | | 4,975 | |
| | | Common Stock | | 07/01/2022 | 200,000 | | | | | | | 200 | | 200 | |
| | | | | | | | | | | | | 5,069 | | 5,157 | |
| Tex Tech Tennis, LLC | (10) | Sporting Goods & Textiles | | | | | | | | | | | | |
| | | Preferred Equity | (23) | 07/07/2021 | 1,000,000 | | | | | | | 1,000 | | 1,830 | |
| | | | | | | | | | | | | | |
| The Affiliati Network, LLC | | Performance Marketing Solutions | | | | | | | | | | | | |
| | | Secured Debt | | 08/09/2021 | | 13.00% | | | | 8/9/2026 | 30 | | 26 | | 26 | |
MSC INCOME FUND, INC.
Consolidated Schedule of Investments (Continued)
December 31, 2022
(dollars in thousands)
| | | | | | | | | | | | | | | | | | | | | | | | | | | | | | | | | | | | | | | | | | | | |
| Portfolio Company (1) (20) | | Business Description | Type of Investment (2) (3) (15) | | Investment Date (22) | Shares/Units | Total Rate | Reference Rate and Spread (25) | PIK Rate (19) | Maturity Date | Principal (4) | Cost (4) | Fair Value (18) |
| | | Secured Debt | | 08/09/2021 | | 13.00% | | | | 8/9/2026 | 2,380 | | 2,341 | | 2,341 | |
| | | Preferred Stock | (8) | 08/09/2021 | 320,000 | | | | | | | 1,600 | | 1,600 | |
| | | | | | | | | | | | | 3,967 | | 3,967 | |
| U.S. TelePacific Corp. | (11) | Provider of Communications and Managed Services | | | | | | | | | | | | |
| | | Secured Debt | (9) | 05/17/2017 | | 11.57% | SF+ | 1.25% | 7.25% | 5/2/2026 | 13,425 | | 13,358 | | 5,018 | |
| | | | | | | | | | | | | | |
| USA DeBusk LLC | (10) | Provider of Industrial Cleaning Services | | | | | | | | | | | | |
| | | Secured Debt | (9) | 10/22/2019 | | 9.82% | L+ | 5.75% | | 9/8/2026 | 18,013 | | 17,828 | | 18,013 | |
| | | | | | | | | | | | | | |
| Vida Capital, Inc | (11) | Alternative Asset Manager | | | | | | | | | | | | |
| | | Secured Debt | | 10/10/2019 | | 10.38% | L+ | 6.00% | | 10/1/2026 | 6,263 | | 6,208 | | 4,885 | |
| | | | | | | | | | | | | | |
| Vistar Media, Inc. | (10) | Operator of Digital Out-of-Home Advertising Platform | | | | | | | | | | | | |
| | | Preferred Stock | | 04/03/2019 | 70,207 | | | | | | | 767 | | 2,250 | |
| | | | | | | | | | | | | | |
| Volusion, LLC | | Provider of Online Software-as-a-Service eCommerce Solutions | | | | | | | | | | | | |
| | | Secured Debt | (17) | 01/26/2015 | | 11.50% | | | | 1/26/2020 | 7,172 | | 7,172 | | 6,392 | |
| | | Unsecured Convertible Debt | | 05/16/2018 | | 8.00% | | | | 11/16/2023 | 175 | | 175 | | — | |
| | | Preferred Member Units | | 01/26/2015 | 2,090,001 | | | | | | | 6,000 | | — | |
| | | Warrants | (27) | 01/26/2015 | 784,867 | | | | | 1/26/2025 | | 1,104 | | — | |
| | | | | | | | | | | | | 14,451 | | 6,392 | |
| VORTEQ Coil Finishers, LLC | (10) | Specialty Coating of Aluminum and Light-Gauge Steel | | | | | | | | | | | | |
| | | Common Equity | (8) | 11/30/2021 | 769,231 | | | | | | | 769 | | 2,910 | |
| | | | | | | | | | | | | | |
| Wall Street Prep, Inc. | (10) | Financial Training Services | | | | | | | | | | | | |
| | | Secured Debt | (9) | 07/19/2021 | | | L+ | 7.00% | | 7/19/2026 | — | | (7) | | (7) | |
| | | Secured Debt | (9) | 07/19/2021 | | 10.74% | L+ | 7.00% | | 7/19/2026 | 5,328 | | 5,252 | | 5,216 | |
| | | Common Stock | | 07/19/2021 | 500,000 | | | | | | | 500 | | 530 | |
| | | | | | | | | | | | | 5,745 | | 5,739 | |
| Watterson Brands, LLC | (10) | Facility Management Services | | | | | | | | | | | | |
| | | Secured Debt | (9) | 12/17/2021 | | 10.73% | L+ | 6.00% | | 12/17/2026 | 51 | | 46 | | 51 | |
| | | Secured Debt | (9) | 12/17/2021 | | 10.73% | L+ | 6.00% | | 12/17/2026 | 53 | | 45 | | 53 | |
| | | Secured Debt | (9) | 12/17/2021 | | 10.73% | L+ | 6.00% | | 12/17/2026 | 4,142 | | 4,089 | | 4,141 | |
| | | | | | | | | | | | | 4,180 | | 4,245 | |
| West Star Aviation Acquisition, LLC | (10) | Aircraft, Aircraft Engine and Engine Parts | | | | | | | | | | | | |
MSC INCOME FUND, INC.
Consolidated Schedule of Investments (Continued)
December 31, 2022
(dollars in thousands)
| | | | | | | | | | | | | | | | | | | | | | | | | | | | | | | | | | | | | | | | | | | | |
| Portfolio Company (1) (20) | | Business Description | Type of Investment (2) (3) (15) | | Investment Date (22) | Shares/Units | Total Rate | Reference Rate and Spread (25) | PIK Rate (19) | Maturity Date | Principal (4) | Cost (4) | Fair Value (18) |
| | | Secured Debt | (9) | 03/01/2022 | | | SF+ | 6.00% | | 3/1/2028 | — | | (6) | | (6) | |
| | | Secured Debt | (9) | 03/01/2022 | | 8.59% | SF+ | 6.00% | | 3/1/2028 | 2,978 | | 2,926 | | 2,948 | |
| | | Common Stock | | 03/01/2022 | 200,000 | | | | | | | 200 | | 250 | |
| | | | | | | | | | | | | 3,120 | | 3,192 | |
| Winter Services LLC | (10) | Provider of Snow Removal and Ice Management Services | | | | | | | | | | | | |
| | | Secured Debt | (9) | 11/19/2021 | | | L+ | 7.00% | | 11/19/2026 | — | | (43) | | — | |
| | | Secured Debt | (9) | 11/19/2021 | | | L+ | 7.00% | | 11/19/2026 | — | | (43) | | (43) | |
| | | Secured Debt | (9) | 11/19/2021 | | 10.74% | L+ | 7.00% | | 11/19/2026 | 12,500 | | 12,305 | | 12,487 | |
| | | | | | | | | | | | | 12,219 | | 12,444 | |
| World Micro Holdings, LLC | | Supply Chain Management | | | | | | | | | | | | |
| | | Secured Debt | | 12/12/2022 | | 13.00% | | | | 12/12/2027 | 1,970 | | 1,930 | | 1,930 | |
| | | Preferred Equity | | 12/12/2022 | 530 | | | | | | | 530 | | 530 | |
| | | | | | | | | | | | | 2,460 | | 2,460 | |
| Xenon Arc, Inc. | (10) | Tech-enabled Distribution Services to Chemicals and Food Ingredients Primary Producers | | | | | | | | | | | | |
| | | Secured Debt | | 12/17/2021 | | | L+ | 5.25% | | 12/17/2026 | — | | (6) | | (6) | |
| | | Secured Debt | | 12/17/2021 | | 10.84% | L+ | 5.25% | | 12/17/2027 | 1,200 | | 1,169 | | 1,192 | |
| | | Secured Debt | | 12/17/2021 | | 8.63% | L+ | 5.25% | | 12/17/2027 | 2,370 | | 2,332 | | 2,354 | |
| | | | | | | | | | | | | 3,495 | | 3,540 | |
| YS Garments, LLC | (11) | Designer and Provider of Branded Activewear | | | | | | | | | | | | |
| | | Secured Debt | (9) | 08/22/2018 | | 9.51% | L+ | 5.50% | | 8/9/2024 | 6,329 | | 6,310 | | 6,064 | |
| | | | | | | | | | | | | | |
| Zips Car Wash, LLC | (10) | Express Car Wash Operator | | | | | | | | | | | | |
| | | Secured Debt | (9) | 02/11/2022 | | 11.67% | SF+ | 7.25% | | 3/1/2024 | 2,388 | | 2,357 | | 2,388 | |
| | | Secured Debt | (9) (32) | 02/11/2022 | | 11.67% | SF+ | 7.25% | | 3/1/2024 | 599 | | 594 | | 597 | |
| | | | | | | | | | | | | 2,951 | | 2,985 | |
Subtotal Non-Control/Non-Affiliate Investments (121.5% of net assets at fair value) | | | | | | | | | | | | | $ | 787,201 | | $ | 740,840 | |
Total Portfolio Investments, December 31, 2022 (175.2% of net assets at fair value) | | | | | | | | | | | | | $ | 1,059,886 | | $ | 1,068,143 | |
| Short-Term Investments (16) | | | | | | | | | | | | | | |
| US Bank Money Market Account (21) | | | | | | | | | | | | | $ | 8,347 | | $ | 8,347 | |
| Total Short-Term Investments | | | | | | | | | | | | | $ | 8,347 | | $ | 8,347 | |
_____________________________
(1)All investments are Lower Middle Market portfolio investments, unless otherwise noted. See Note C—Fair Value Hierarchy for Investments—Portfolio Composition for a description of Lower Middle Market portfolio investments. All of the Company’s investments, unless otherwise noted, are encumbered as security for one of the Company’s Credit Facilities.
(2)Debt investments are income producing, unless otherwise noted by footnote (14), as described below. Equity and warrants are non-income producing, unless otherwise noted by footnote (8), as described below.
(3)See Note C — Fair Value Hierarchy for Investments — Portfolio Composition and Schedule 12-14 for a summary of geographic location of portfolio companies.
MSC INCOME FUND, INC.
Consolidated Schedule of Investments (Continued)
December 31, 2022
(dollars in thousands)
(4)Principal is net of repayments. Cost is net of repayments and accumulated unearned income.
(5)Control investments are defined by the 1940 Act as investments in which more than 25% of the voting securities are owned or where the ability to nominate greater than 50% of the board representation is maintained.
(6)Affiliate investments are defined by the 1940 Act as investments in which between 5% and 25% (inclusive) of the voting securities are owned and the investments are not classified as Control investments.
(7)Non-Control/Non-Affiliate investments are defined by the 1940 Act as investments that are neither Control investments nor Affiliate investments.
(8)Income producing through dividends or distributions.
(9)Index based floating interest rate is subject to contractual minimum interest rate. As noted in this schedule, 93% of the loans (based on the par amount) contain LIBOR floors which range between 0.50% and 2.00%, with a weighted-average LIBOR floor of 1.04%.
(10)Private Loan portfolio investment. See Note C—Fair Value Hierarchy for Investments—Portfolio Composition for a description of Private Loan portfolio investments.
(11)Middle Market portfolio investment. See Note C—Fair Value Hierarchy for Investments—Portfolio Composition for a description of Middle Market portfolio investments.
(12)Other Portfolio investment. See Note C—Fair Value Hierarchy for Investments—Portfolio Composition for a description of Other Portfolio investments.
(13)Investment is not a qualifying asset as defined under Section 55(a) of the 1940 Act. Qualifying assets must represent at least 70% of total assets at the time of acquisition of any additional non-qualifying assets.
(14)Non-accrual and non-income producing debt investment.
(15)All of the Company’s portfolio investments are generally subject to restrictions on resale as “restricted securities.”
(16)Short-term investments represent an investment in a fund that invests in highly liquid investments with average original maturity dates of three months or less. These short-term investments are included as Cash and cash equivalents on the Consolidated Balance Sheets.
(17)Maturity date is under on-going negotiations with the portfolio company and other lenders, if applicable.
(18)Investment fair value was determined using significant unobservable inputs, unless otherwise noted. See Note C — Fair Value Hierarchy for Investments—Portfolio Composition for further discussion. Negative fair value is the result of the capitalized discount on the loan or the unfunded commitment being valued below par.
(19)Investments may have a portion, or all, of their income received from Paid-in-Kind (“PIK”) interest or dividends. PIK interest income and cumulative dividend income represent income not paid currently in cash. The difference between the Total Rate and PIK Rate represents the cash rate as of December 31, 2022.
(20)All portfolio company headquarters are based in the United States, unless otherwise noted.
(21)Effective yield as of December 31, 2022 was approximately 0.005% on the US Bank Money Market Account.
(22)Investment date represents the date of initial investment in the security position.
(23)Shares/Units represent ownership in a related Real Estate or HoldCo entity.
(24)Investment is not unitized. Presentation is made in percent of fully diluted ownership unless otherwise indicated.
(25)A majority of the variable rate loans in the Company’s Investment Portfolio bear interest at a rate that may be determined by reference to either LIBOR (“L”), SOFR (“SF”) or an alternate Base rate (commonly based on the Federal Funds Rate or the Prime rate (“P”)), which typically resets every one, three, or six months at the borrower’s option. SOFR based contracts may include a credit spread adjustment (the “Adjustment”) that is charged in addition to the stated spread. The Adjustment is applied when the SOFR rate, plus the Adjustment, exceeds the stated floor rate, as applicable. As of December 31, 2022, SOFR based contracts in the portfolio had Adjustments ranging from 0.10% to 0.26%.
(26)Warrants are presented in equivalent units with a strike price of $14.28 per unit.
(27)Warrants are presented in equivalent shares/units with a strike price of $0.01 per share/unit.
(28)Index based floating interest rate is subject to contractual maximum base rate of 2.50%.
MSC INCOME FUND, INC.
Consolidated Schedule of Investments (Continued)
December 31, 2022
(dollars in thousands)
(29)As of December 31, 2022, borrowings under the loan facility bore interest at SOFR+5.75% (Floor 1.00%). Delayed draw term loan facility permits the borrower to make an interest rate election regarding the base rate on each draw under the facility. The rate presented represents a weighted-average rate for borrowings under the facility, as of December 31, 2022.
(30)The security has an effective contractual interest rate of 2.00% PIK + LIBOR+6.50%, Floor 1.00%,but the issuer may, in its discretion, elect to pay the PIK interest in cash. The rate presented represents the effective current yield based on actual payments received during the period.
(31)As of December 31, 2022, borrowings under the loan facility bore interest at LIBOR+7.25% (Floor 0.75%). RLOC facility permits the borrower to make an interest rate election regarding the base rate on each draw under the facility. The rate presented represents a weighted-average rate for borrowings under the facility, as of December 31, 2022.
(32)As of December 31, 2022, borrowings under the loan facility bore interest at SOFR+7.25% (Floor 1.00%). Each new draw on the delayed draw term loan facility has a different floating rate reset date. The rate presented represents a weighted-average rate for borrowings under the facility, as of December 31, 2022.
(33)The position is unfunded and no interest income is being earned as of December 31, 2022. The position may earn a nominal unused facility fee on committed amounts.
(34)As of December 31, 2022, borrowings under the loan facility bore interest at SOFR+6.25% (Floor 1.00%). RLOC facility permits the borrower to make an interest rate election regarding the base rate on each draw under the facility. The rate presented represents a weighted-average rate for borrowings under the facility, as of December 31, 2022.
(35)As of December 31, 2022, borrowings under the loan facility bore interest at SOFR+6.25% (Floor 1.00%). Due to an amendment and subsequent funding during the quarter, the term loan facility has different floating rate reset dates. The rate presented represents a weighted-average rate for borrowings under the facility, as of December 31, 2022.
(36)As of December 31, 2022, borrowings under the loan facility bore interest at LIBOR+8.00% (Floor 1.00%). RLOC facility permits the borrower to make an interest rate election regarding the base rate on each draw under the facility. The rate presented represents a weighted-average rate for borrowings under the facility, as of December 31, 2022.
(37)As of December 31, 2022, borrowings under the loan facility bore interest at SOFR+5.75% (Floor 1.00%). RLOC facility permits the borrower to make an interest rate election regarding the base rate on each draw under the facility. The rate presented represents a weighted-average rate for borrowings under the facility, as of December 31, 2022.
(38)As of December 31, 2022, borrowings under the loan facility bore interest at LIBOR+10.00%. RLOC facility permits the borrower to make an interest rate election regarding the base rate on each draw under the facility. The rate presented represents a weighted-average rate for borrowings under the facility, as of December 31, 2022.
(39)As of December 31, 2022, borrowings under the loan facility bore interest at SOFR+ 8.00% (Floor 1.00%). RLOC facility permits the borrower to make an interest rate election regarding the base rate on each draw under the facility. The rate presented represents a weighted-average rate for borrowings under the facility, as of December 31, 2022.
(40)Portfolio company headquarters are located outside of the United States.
MSC INCOME FUND, INC.
Notes to the Consolidated Financial Statements
NOTE A — ORGANIZATION AND BASIS OF PRESENTATION
1.Organization
MSC Income Fund, Inc. (“MSIF” or, together with its consolidated subsidiaries, “MSC Income Fund” or the “Company”) is a principal investment firm primarily focused on providing debt capital to middle market (“Middle Market”) companies and customized debt and equity financing to lower middle market (“LMM”) companies. MSC Income Fund’s portfolio investments are typically made to support leveraged buyouts, recapitalizations, growth financings, refinancings and acquisitions of companies that operate in a variety of industry sectors. MSC Income Fund seeks to partner with private equity funds in its Private Loan (as defined below) and Middle Market investment strategies. MSC Income Fund invests primarily in secured debt investments of Middle Market companies generally headquartered in the United States and in secured debt investments, equity investments, warrants and other securities of LMM companies based in the United States. MSC Income Fund seeks to partner with entrepreneurs, business owners and management teams and generally provides “one-stop” financing alternatives within its LMM investment strategy.
MSIF was formed in November 2011 to operate as an externally managed business development company (“BDC”) under the Investment Company Act of 1940, as amended (the “1940 Act”). MSIF has elected to be treated for U.S. federal income tax purposes as a regulated investment company (“RIC”) under Subchapter M of the Internal Revenue Code of 1986, as amended (the “Code”). As a result, MSIF generally does not pay corporate-level U.S. federal income taxes on any net ordinary taxable income or capital gains that it distributes to its stockholders.
On October 28, 2020, MSIF’s stockholders approved the appointment of MSC Adviser I, LLC (the “Adviser”), which is wholly-owned by Main Street Capital Corporation (“Main Street”), a New York Stock Exchange listed BDC, as MSIF’s investment adviser and administrator under an Investment Advisory and Administrative Services Agreement dated October 30, 2020 (the “Investment Advisory Agreement”). In such role, the Adviser has the responsibility to manage the business of MSC Income Fund, including the responsibility to identify, evaluate, negotiate and structure prospective investments, make investment and portfolio management decisions, monitor MSC Income Fund’s investment portfolio and provide ongoing administrative services.
MSIF has certain direct and indirect wholly-owned subsidiaries that have elected to be taxable entities (the “Taxable Subsidiaries”). The primary purpose of the Taxable Subsidiaries is to permit MSIF to hold equity investments in portfolio companies which are “pass-through” entities for tax purposes. MSIF also has certain direct and indirect wholly-owned subsidiaries formed for financing purposes (the “Structured Subsidiaries”).
Unless otherwise noted or the context otherwise indicates, the terms “we,” “us,” “our,” the “Company” and “MSC Income Fund” refer to MSIF and its consolidated subsidiaries, which include the Taxable Subsidiaries and the Structured Subsidiaries.
2. Basis of Presentation
MSC Income Fund’s consolidated financial statements are prepared in accordance with generally accepted accounting principles in the United States of America (“U.S. GAAP”). The Company is an investment company following accounting and reporting guidance in Financial Accounting Standards Board (“FASB”) Accounting Standards Codification (“ASC”) 946, Financial Services—Investment Companies (“ASC 946”). For each of the periods presented herein, MSC Income Fund’s consolidated financial statements include the accounts of MSIF and its consolidated subsidiaries. The Investment Portfolio, as used herein, refers to all of MSC Income Fund’s investments in Private Loan portfolio companies, investments in LMM portfolio companies, investments in Middle Market portfolio companies and Other Portfolio investments (see Note C — Fair Value Hierarchy for Investments — Portfolio Composition — Investment Portfolio Composition for additional discussion of MSC Income Fund’s Investment Portfolio and definitions for the defined terms Private Loan and Other Portfolio). MSC Income Fund’s results of operations and cash flows for the years ended December 31, 2023, 2022 and 2021 and financial position as of December 31, 2023 and 2022, are presented on a consolidated basis. The effects of all intercompany transactions between MSIF and its consolidated subsidiaries have been eliminated in consolidation.
MSC INCOME FUND, INC.
Notes to the Consolidated Financial Statements (Continued)
Principles of Consolidation
Under ASC 946, MSC Income Fund is precluded from consolidating other entities in which MSC Income Fund has equity investments, including those in which it has a controlling interest, unless the other entity is another investment company. An exception to this general principle in ASC 946 occurs if MSC Income Fund holds a controlling interest in an operating company that provides all or substantially all of its services directly to MSC Income Fund. Accordingly, as noted above, MSC Income Fund’s consolidated financial statements include the financial position and operating results for the Taxable Subsidiaries and the Structured Subsidiaries. MSC Income Fund has determined that none of its portfolio investments qualify for this exception. Therefore, MSC Income Fund’s Investment Portfolio is carried on the Consolidated Balance Sheets at fair value, as discussed further in Note B.1. — Summary of Significant Accounting Policies — Valuation of the Investment Portfolio, with any adjustments to fair value recognized as “Net Unrealized Appreciation (Depreciation)” until the investment is realized, usually upon exit, resulting in any gain or loss being recognized as a “Net Realized Gain (Loss),” in both cases on the Consolidated Statements of Operations.
Portfolio Investment Classification
MSC Income Fund classifies its Investment Portfolio in accordance with the requirements of the 1940 Act. Under the 1940 Act, (a) “Control Investments” are defined as investments in which MSC Income Fund owns more than 25% of the voting securities or has rights to maintain greater than 50% of the board representation, (b) “Affiliate Investments” are defined as investments in which MSC Income Fund owns between 5% and 25% (inclusive) of the voting securities and does not have rights to maintain greater than 50% of the board representation and (c) “Non-Control/Non-Affiliate Investments” are defined as investments that are neither Control Investments nor Affiliate Investments. For purposes of determining the classification of its Investment Portfolio, MSC Income Fund has excluded consideration of any voting securities or board appointment rights held by Main Street and third-party investment funds advised by the Adviser.
3. Reverse Stock Split
On December 16, 2024, the Company effectuated a 2-for-1 reverse stock split of its outstanding common stock pursuant to approval from its board of directors (the “Reverse Stock Split”). As a result of the Reverse Stock Split, every two shares of the Company’s issued and outstanding common stock were converted into one share of issued and outstanding common stock, without any change in the par value or shares authorized. All share, per share, common stock and additional paid-in capital amounts presented in these financial statements prior to December 16, 2024 have been retrospectively adjusted to give effect to the Reverse Stock Split. A summary of the Company’s weighted average number of shares of common stock outstanding and earnings per share after adjusting for the Reverse Stock Split is as follows:
| | | | | | | | |
| Year Ended December 31, |
| 2023 | 2022 |
| Weighted average number of shares of common stock outstanding (as reported) | 80,269,002 | 79,993,040 |
Weighted average number of shares of common stock outstanding (as adjusted) | 40,134,501 | 39,996,520 |
Net increase in net assets per share resulting from operations (as reported) | $ | 0.82 | | $ | 0.57 | |
Net increase in net assets per share resulting from operations (as adjusted) | $ | 1.64 | | $ | 1.14 | |
NOTE B — SUMMARY OF SIGNIFICANT ACCOUNTING POLICIES
1.Valuation of the Investment Portfolio
MSC Income Fund accounts for its Investment Portfolio at fair value. As a result, MSC Income Fund follows the provisions of ASC 820, Fair Value Measurements and Disclosures (“ASC 820”). ASC 820 defines fair value, establishes a framework for measuring fair value, establishes a fair value hierarchy based on the quality of inputs used to measure fair value and enhances disclosure requirements for fair value measurements. ASC 820 requires MSC Income Fund to assume that the portfolio investment is to be sold in the principal market to independent market participants, which may be a hypothetical market. Market participants are defined as buyers and sellers in the principal market that are independent, knowledgeable and willing and able to transact.
MSC INCOME FUND, INC.
Notes to the Consolidated Financial Statements (Continued)
MSC Income Fund’s portfolio strategy calls for it to invest primarily in debt securities issued by Middle Market companies and illiquid debt and equity securities issued by privately held, LMM companies. The Middle Market companies in which MSC Income Fund invests are generally larger in size than the LMM companies and their debt securities can be more liquid than the debt securities issued by LMM companies. MSC Income Fund categorizes some of its investments in Middle Market companies and LMM companies as Private Loan portfolio investments, which are primarily debt securities in privately held companies that have primarily been originated directly by our Adviser or, to a lesser extent, through our Adviser’s strategic relationships with other investment funds on a collaborative basis through investments that are often referred to in the debt markets as “club deals” because of the small lender group size. In both cases, MSC Income Fund’s Private Loan investments are typically made to support a company owned by or in the process of being acquired by a private equity sponsor. Private Loan investments are made in companies that are generally consistent with the size of companies MSC Income Fund invests in through its Middle Market portfolio and LMM portfolio. MSC Income Fund’s portfolio also includes Other Portfolio investments which primarily consist of investments that are not consistent with the typical profiles for its Private Loan, LMM or Middle Market portfolio investments, including investments which may be managed by third parties. MSC Income Fund’s portfolio investments may be subject to restrictions on resale.
Private Loan investments may include investments which have no established market or have established markets that are not active, while LMM investments and Other Portfolio investments generally have no established trading market. Middle Market portfolio investments generally have established markets that are not active. MSC Income Fund determines in good faith the fair value of its Investment Portfolio pursuant to a valuation policy in accordance with ASC 820, with such valuation process approved by its Board of Directors and in accordance with the 1940 Act. MSC Income Fund’s valuation policies and processes are intended to provide a consistent basis for determining the fair value of MSC Income Fund’s Investment Portfolio.
For Private Loan and Middle Market portfolio investments in debt securities for which it has determined that third-party quotes or other independent pricing are not available or appropriate, MSC Income Fund generally estimates the fair value based on the assumptions that it believes hypothetical market participants would use to value the investment in a current hypothetical sale using the yield-to-maturity model (“Yield-to-Maturity”) valuation method. For LMM portfolio investments, MSC Income Fund generally reviews external events, including private mergers, sales and acquisitions involving comparable companies, and includes these events in the valuation process by using an enterprise value waterfall methodology (“Waterfall”) for its LMM equity investments and an income approach using a Yield-to-Maturity valuation method for its LMM debt investments. For Middle Market portfolio investments in debt securities for which it has determined that third-party quotes or other independent prices are available, MSC Income Fund primarily uses quoted prices in the valuation process. MSC Income Fund determines the appropriateness of the use of third-party broker quotes, if any, in determining fair value based on its understanding of the level of actual transactions used by the broker to develop the quote and whether the quote was an indicative price or binding offer, the depth and consistency of broker quotes and the correlation of changes in broker quotes with underlying performance of the portfolio company and other market indices. For its Other Portfolio equity investments, MSC Income Fund generally calculates the fair value of the investment primarily based on the net asset value (“NAV”) of the fund and adjusts the fair value for other factors deemed relevant that would affect the fair value of the investment. All of the valuation approaches for MSC Income Fund’s portfolio investments estimate the value of the investment as if MSC Income Fund was to sell, or exit, the investment as of the measurement date.
These valuation approaches consider the value associated with MSC Income Fund’s ability to control the capital structure of the portfolio company, as well as the timing of a potential exit. For valuation purposes, “control” portfolio investments are composed of debt and equity securities in companies for which MSC Income Fund has a controlling interest in the equity ownership of the portfolio company or the ability to nominate a majority of the portfolio company’s board of directors. For valuation purposes, “non-control” portfolio investments are generally composed of debt and equity securities in companies for which MSC Income Fund does not have a controlling interest in the equity ownership of the portfolio company or the ability to nominate a majority of the portfolio company’s board of directors.
MSC INCOME FUND, INC.
Notes to the Consolidated Financial Statements (Continued)
Under the Waterfall valuation method, MSC Income Fund estimates the enterprise value of a portfolio company using a combination of market and income approaches or other appropriate valuation methods, such as considering recent transactions in the equity securities of the portfolio company or third-party valuations of the portfolio company, and then performs a Waterfall calculation by allocating the enterprise value over the portfolio company’s securities in order of their preference relative to one another. The enterprise value is the fair value at which an enterprise could be sold in a transaction between two willing parties, other than through a forced or liquidation sale. Typically, privately held companies are bought and sold based on multiples of earnings before interest, taxes, depreciation and amortization (“EBITDA”), cash flows, net income, revenues, or in limited cases, book value. There is no single methodology for estimating enterprise value. For any one portfolio company, enterprise value is generally described as a range of values from which a single estimate of enterprise value is derived. In estimating the enterprise value of a portfolio company, MSC Income Fund analyzes various factors including the portfolio company’s historical and projected financial results. Due to SEC deadlines for MSC Income Fund’s quarterly and annual financial reporting, the operating results of a portfolio company used in the current period valuation are generally the results from the period ended three months prior to such valuation date and may include unaudited, projected, budgeted or pro forma financial information and may require adjustments for non-recurring items or to normalize the operating results that may require significant judgment in determining. In addition, projecting future financial results requires significant judgment regarding future growth assumptions. In evaluating the operating results, MSC Income Fund also analyzes the impact of exposure to litigation, loss of customers or other contingencies. After determining the appropriate enterprise value, MSC Income Fund allocates the enterprise value to investments in order of the legal priority of the various components of the portfolio company’s capital structure. In applying the Waterfall valuation method, MSC Income Fund assumes the loans are paid-off at the principal amount in a change in control transaction and are not assumed by the buyer, which MSC Income Fund believes is consistent with its past transaction history and standard industry practices.
Under the Yield-to-Maturity valuation method, MSC Income Fund also uses the income approach to determine the fair value of debt securities based on projections of the discounted future free cash flows that the debt security will likely generate, including analyzing the discounted cash flows of interest and principal amounts for the debt security, as set forth in the associated loan agreements, as well as the financial position and credit risk of the portfolio company. MSC Income Fund’s estimate of the expected repayment date of its debt securities is generally the maturity date of the instrument, as MSC Income Fund generally intends to hold its loans and debt securities to maturity. The Yield-to-Maturity analysis also considers changes in leverage levels, credit quality, portfolio company performance, changes in market-based interest rates and other factors. MSC Income Fund will generally use the value determined by the Yield-to-Maturity analysis as the fair value for that security; however, because of MSC Income Fund’s general intent to hold its loans to maturity, the fair value will not exceed the principal amount of the debt security valued using the Yield-to-Maturity valuation method. A change in the assumptions that MSC Income Fund uses to estimate the fair value of its debt securities using the Yield-to-Maturity valuation method could have a material impact on the determination of fair value. If there is deterioration in credit quality or if a debt security is in workout status, MSC Income Fund may consider other factors in determining the fair value of the debt security, including the value attributable to the debt security from the enterprise value of the portfolio company or the proceeds that would most likely be received in a liquidation analysis.
Under the NAV valuation method, for an investment in an investment fund that does not have a readily determinable fair value, MSC Income Fund measures the fair value of the investment predominately based on the NAV of the investment fund as of the measurement date and adjusts the investment’s fair value for factors known to MSC Income Fund that would affect that fund’s NAV, including, but not limited to, fair values for individual investments held by the fund if MSC Income Fund holds the same investment or for a publicly traded investment. In addition, in determining the fair value of the investment, MSC Income Fund considers whether adjustments to the NAV are necessary in certain circumstances, based on the analysis of any restrictions on redemption of MSC Income Fund’s investment as of the measurement date, recent actual sales or redemptions of interests in the investment fund, and expected future cash flows available to equity holders, including the rate of return on those cash flows compared to an implied market return on equity required by market participants, or other uncertainties surrounding MSC Income Fund’s ability to realize the full NAV of its interests in the investment fund.
MSC INCOME FUND, INC.
Notes to the Consolidated Financial Statements (Continued)
Pursuant to its internal valuation process and the requirements under the 1940 Act, MSC Income Fund performs valuation procedures on each of its portfolio investments quarterly. In addition to its internal valuation process, in arriving at estimates of fair value for its investments in its Private Loan portfolio companies, MSC Income Fund, among other things, consults with a nationally recognized independent financial advisory services firm (the “Financial Advisory Firm”). The Financial Advisory Firm analyzes and provides observations and recommendations and an assurance certification regarding MSC Income Fund’s determinations of the fair value of its Private Loan portfolio company investments. The Financial Advisory Firm is generally consulted relative to MSC Income Fund’s investments in each Private Loan portfolio company at least once every calendar year, and for MSC Income Fund’s investments in new Private Loan portfolio companies, at least once in the twelve-month period subsequent to the initial investment. In certain instances, MSC Income Fund may determine that it is not cost-effective, and as a result is not in its stockholders’ best interest, to consult with the Financial Advisory Firm on its investments in one or more Private Loan portfolio companies. Such instances include, but are not limited to, situations where the fair value of MSC Income Fund’s investment in a Private Loan portfolio company is determined to be insignificant relative to the total Investment Portfolio. MSC Income Fund consulted with and received an assurance certification from the Financial Advisory Firm in arriving at its determination of fair value for its investments in a total of 55 and 51 Private Loan portfolio companies during the years ended December 31, 2023 and 2022, respectively, representing 79% and 83% of the total Private Loan portfolio at fair value as of December 31, 2023 and 2022, respectively. Excluding its investments in Private Loan portfolio companies that, as of December 31, 2023 and 2022, as applicable, had not been in the Investment Portfolio for at least twelve months subsequent to the initial investment and its investments in Private Loan portfolio companies that were not reviewed because the investment is valued based upon third-party quotes or other independent pricing, 90% and 94% of the Private Loan portfolio at fair value was reviewed and certified by the Financial Advisory Firm for the years ended December 31, 2023 and 2022, respectively.
For valuation purposes, all of MSC Income Fund’s Private Loan portfolio investments are either non-control or affiliate investments. For Private Loan portfolio investments for which it has determined that third-party quotes or other independent pricing are not available or appropriate, MSC Income Fund generally estimates the fair value based on the assumptions that it believes hypothetical market participants would use to value such Private Loan debt investments in a current hypothetical sale using the Yield-to-Maturity valuation method and such Private Loan equity investments in a current hypothetical sale using the Waterfall valuation method.
In addition to its internal valuation process, in arriving at estimates of fair value for its investments in its LMM portfolio companies, MSC Income Fund, among other things, consults with the Financial Advisory Firm. The Financial Advisory Firm analyzes and provides observations, recommendations and an assurance certification regarding MSC Income Fund’s determinations of the fair value of its LMM portfolio company investments. The Financial Advisory Firm is generally consulted relative to MSC Income Fund’s investments in each LMM portfolio company at least once every calendar year, and for MSC Income Fund’s investments in new LMM portfolio companies, at least once in the twelve-month period subsequent to the initial investment. In certain instances, MSC Income Fund may determine that it is not cost-effective, and as a result is not in its stockholders’ best interest, to consult with the Financial Advisory Firm on its investments in one or more LMM portfolio companies. Such instances include, but are not limited to, situations where the fair value of MSC Income Fund’s investment in a LMM portfolio company is determined to be insignificant relative to the total Investment Portfolio. MSC Income Fund consulted with and received an assurance certification from the Financial Advisory Firm in arriving at MSC Income Fund’s determination of fair value for its investments in a total of 46 and 44 LMM portfolio companies during the years ended December 31, 2023 and 2022, respectively, representing 95% and 97% of the total LMM portfolio at fair value as of December 31, 2023 and 2022, respectively. Excluding its investments in LMM portfolio companies that, as of December 31, 2023 and 2022, as applicable, had not been in the Investment Portfolio for at least twelve months subsequent to the initial investment or whose primary purpose is to own real estate for which a third-party appraisal is obtained on at least an annual basis, over 99% of the LMM portfolio at fair value was reviewed and certified by the Financial Advisory Firm for both of the years ended December 31, 2023 and December 31, 2022.
MSC INCOME FUND, INC.
Notes to the Consolidated Financial Statements (Continued)
For valuation purposes, all of MSC Income Fund’s Middle Market portfolio investments are non-control investments. To the extent sufficient observable inputs are available to determine fair value, MSC Income Fund uses observable inputs to determine the fair value of these investments through obtaining third-party quotes or other independent pricing. For Middle Market portfolio investments for which it has determined that third-party quotes or other independent pricing are not available or appropriate, MSC Income Fund generally estimates the fair value based on the assumptions that it believes hypothetical market participants would use to value such Middle Market debt investments in a current hypothetical sale using the Yield-to-Maturity valuation method and such Middle Market equity investments in a current hypothetical sale using the Waterfall valuation method. MSC Income Fund generally consults on a limited basis with the Financial Advisory Firm in connection with determining the fair value of its Middle Market portfolio investments due to the nature of these investments. The vast majority (97% and 91% as of December 31, 2023 and 2022, respectively) of the Middle Market portfolio investments (i) are valued using third-party quotes or other independent pricing services or (ii) MSC Income Fund has consulted with and received an assurance certification from the Financial Advisory Firm within the last twelve months.
For valuation purposes, all of MSC Income Fund’s Other Portfolio investments are non-control, affiliate or control investments. MSC Income Fund’s Other Portfolio investments comprised 2.3% and 2.7% of MSC Income Fund’s Investment Portfolio at fair value as of December 31, 2023 and 2022, respectively. Similar to the LMM investment portfolio, market quotations for Other Portfolio equity investments are generally not readily available. For its Other Portfolio equity investments, MSC Income Fund generally determines the fair value of these investments using the NAV valuation method.
Due to the inherent uncertainty in the valuation process, MSC Income Fund’s determination of fair value for its Investment Portfolio may differ materially from the values that would have been determined had a ready market for the securities existed. In addition, changes in the market environment, portfolio company performance and other events that may occur over the lives of the investments may cause the gains or losses ultimately realized on these investments to be materially different than the valuations currently assigned. MSC Income Fund determines the fair value of each individual investment and records changes in fair value as unrealized appreciation or depreciation.
MSC Income Fund uses an internally developed portfolio investment rating system in connection with its investment oversight, portfolio management and analysis and investment valuation procedures for its Private Loan, LMM and Middle Market portfolio companies. This system takes into account both quantitative and qualitative factors of each Private Loan, LMM and Middle Market portfolio company.
Rule 2a-5 under the 1940 Act permits a BDC’s board of directors to designate its executive officers or investment adviser as a valuation designee to determine the fair value for its investment portfolio, subject to the active oversight of the board. MSC Income Fund’s Board of Directors has approved policies and procedures pursuant to Rule 2a-5 (the “Valuation Procedures”) and has designated the Adviser, led by a group of Main Street’s and the Adviser’s executive officers, to serve as the Board of Directors’ valuation designee. MSC Income Fund believes its Investment Portfolio as of December 31, 2023 and 2022 approximates fair value as of those dates based on the markets in which it operates and other conditions in existence on those reporting dates.
2.Use of Estimates
The preparation of financial statements in conformity with U.S. GAAP requires management to make estimates and assumptions that affect the reported amounts of assets and liabilities and disclosure of contingent assets and liabilities at the date of the financial statements and the reported amounts of revenue and expenses during the period. Actual results may differ from these estimates under different conditions or assumptions. Additionally, as explained in Note B.1. — Summary of Significant Accounting Policies — Valuation of the Investment Portfolio, the consolidated financial statements include investments in the Investment Portfolio whose values have been estimated by MSC Income Fund pursuant to valuation policies and procedures approved and overseen by MSC Income Fund’s Board of Directors, in the absence of readily ascertainable market values. Because of the inherent uncertainty of the Investment Portfolio valuations, those estimated values may differ materially from the values that would have been determined had a ready market for the securities existed.
MSC INCOME FUND, INC.
Notes to the Consolidated Financial Statements (Continued)
Macroeconomic factors, including pandemics, risk of recession, inflation, supply chain constraints or disruptions, geopolitical disruptions and changing market index interest rates, and the related effect on the U.S. and global economies, have impacted, and may continue to impact, the businesses and operating results of certain of MSC Income Fund’s portfolio companies. As a result of these and other current effects of macroeconomic factors, as well as the uncertainty regarding the extent and duration of their impact, the valuation of MSC Income Fund’s Investment Portfolio has and may continue to experience increased volatility.
3.Cash and Cash Equivalents
Cash and cash equivalents consist of cash and highly liquid investments with an original maturity of three months or less at the date of purchase. Cash and cash equivalents are carried at cost, which approximates fair value. At December 31, 2023, the Company had $20.8 million of cash equivalents invested in AAA-rated money market funds. These highly liquid, short-term investments are included in the Consolidated Schedule of Investments.
At December 31, 2023 and December 31, 2022, cash balances totaling $9.0 million and $11.7 million, respectively, exceeded Federal Deposit Insurance Corporation insurance protection levels, subjecting the Company to risk related to the uninsured balance.
4.Interest, Dividend and Fee Income
MSC Income Fund records interest and dividend income on the accrual basis to the extent amounts are expected to be collected. Dividend income is recorded when dividends are declared by the portfolio company or at such other time that an obligation exists for the portfolio company to make a distribution. MSC Income Fund evaluates accrued interest and dividend income periodically for collectability. When a loan or debt security becomes 90 days or more past due, and if MSC Income Fund otherwise does not expect the debtor to be able to service its debt obligation, MSC Income Fund will generally place the loan or debt security on non-accrual status and cease recognizing interest income on that loan or debt security until the borrower has demonstrated the ability and intent to pay contractual amounts due. If a loan or debt security’s status significantly improves regarding the debtor’s ability to service the debt obligation, or if a loan or debt security is sold or written off, MSC Income Fund removes it from non-accrual status.
As of December 31, 2023, investments on non-accrual status comprised 1.1% of MSC Income Fund’s total Investment Portfolio at fair value and 4.0% at cost. As of December 31, 2022, investments on non-accrual status comprised 0.8% of MSC Income Fund’s total Investment Portfolio at fair value and 4.8% at cost.
Interest income from investments in the “equity” class of security of collateralized loan obligation (“CLO”) funds (typically subordinated notes) is recorded based upon an estimation of an effective yield to expected maturity utilizing estimated projected cash flows in accordance with ASC 325-40, Beneficial Interests in Securitized Financial Assets. MSC Income Fund monitors the expected cash inflows from its investment in a CLO, including the expected residual payments, and the effective yield is determined and updated periodically.
MSC Income Fund holds certain debt and preferred equity instruments in its Investment Portfolio that contain payment-in-kind (“PIK”) interest and cumulative dividend provisions. The PIK interest, computed at the contractual rate specified in each debt agreement, is periodically added to the principal balance of the debt and is recorded as interest income. Thus, the actual collection of this interest may be deferred until the time of debt principal repayment. Cumulative dividends are recorded as dividend income, and any dividends in arrears are added to the balance of the preferred equity investment. The actual collection of these dividends in arrears may be deferred until such time as the preferred equity is redeemed or sold. To maintain RIC tax treatment (as discussed in Note B.7. — Summary of Significant Accounting Policies — Income Taxes below), these non-cash sources of income may need to be paid out to stockholders in the form of distributions, even though MSC Income Fund may not have collected the PIK interest and cumulative dividends in cash. MSC Income Fund stops accruing PIK interest and cumulative dividends and writes off any accrued and uncollected interest and dividends in arrears when it determines that such PIK interest and dividends in arrears are no longer collectible. For the years ended December 31, 2023, 2022 and 2021, (i) 3.8%, 2.5% and 2.3%, respectively, of MSC Income Fund’s total investment income was attributable to PIK interest income not paid currently in cash and (ii) 0.1%, 0.6% and 0.3%, respectively, of MSC Income Fund’s total investment income was attributable to cumulative dividend income not paid currently in cash.
MSC INCOME FUND, INC.
Notes to the Consolidated Financial Statements (Continued)
MSC Income Fund may periodically provide services, including structuring and advisory services, to its portfolio companies or other third parties. For services that are separately identifiable and evidence exists to substantiate fair value, fee income is recognized as earned. Fees received in connection with debt financing transactions are generally deferred and accreted into income over the life of the financing.
A presentation of total investment income MSC Income Fund received from its Investment Portfolio in each of the periods presented is as follows:
| | | | | | | | | | | | | | | | | | | | | |
| | | Year Ended
December 31, |
| | | | | 2023 | | 2022 | | 2021 |
| | | | | (dollars in thousands) |
| Interest, fee and dividend income: | | | | | | | | | |
| Interest income | | | | | $ | 116,976 | | | $ | 90,811 | | | $ | 72,536 | |
| Dividend income | | | | | 11,255 | | | 9,442 | | | 15,880 | |
| Fee income | | | | | 3,155 | | | 3,512 | | | 1,712 | |
| Total interest, fee and dividend income | | | | | $ | 131,386 | | | $ | 103,765 | | | $ | 90,128 | |
5.Deferred Financing Costs
Deferred financing costs include commitment fees and other direct costs incurred in connection with arranging MSC Income Fund’s borrowings. These costs were incurred in connection with MSC Income Fund’s multi-year revolving Credit Facilities (as defined below in Note E — Debt) and have been capitalized as an asset and reflected in the Consolidated Balance Sheets as Deferred financing costs. Deferred financing costs incurred in connection with the Series A Notes (as defined below in Note E — Debt) are a direct deduction from the principal amount outstanding.
6.Unearned Income — Debt Origination Fees and Original Issue Discount and Discounts / Premiums to Par Value
MSC Income Fund capitalizes debt origination fees received in connection with financings and reflects such fees as unearned income netted against the applicable debt investments. The unearned income from the fees is accreted into income over the life of the financing.
In connection with its portfolio debt investments, MSC Income Fund sometimes receives nominal cost warrants or warrants with an exercise price below the fair value of the underlying equity (together, “nominal cost equity”) that are valued as part of the negotiation process with the particular portfolio company. When MSC Income Fund receives nominal cost equity, it allocates its cost basis in its investment between its debt security and its nominal cost equity at the time of origination based on amounts negotiated with the particular portfolio company. The allocated amounts are based upon the fair value of the nominal cost equity, which is then used to determine the allocation of cost to the debt security. Any discount recorded on a debt investment resulting from this allocation is reflected as unearned income, which is netted against the applicable debt investment, and accreted into interest income over the life of the debt investment. The actual collection of this interest is deferred until the time of debt principal repayment.
MSC Income Fund may also purchase debt securities at a discount or at a premium to the par value of the debt security. In the case of a purchase at a discount, MSC Income Fund records the investment at the par value of the debt security net of the discount, and the discount is accreted into interest income over the life of the debt investment. In the case of a purchase at a premium, MSC Income Fund records the investment at the par value of the debt security plus the premium, and the premium is amortized as a reduction to interest income over the life of the debt investment.
To maintain RIC tax treatment (as discussed in Note B.7. — Summary of Significant Accounting Policies — Income Taxes below), these non-cash sources of income may need to be paid out to stockholders in the form of distributions, even though MSC Income Fund may not have collected the interest income. For the years ended December 31, 2023, 2022 and 2021, 2.5%, 2.5%, and 5.7%, respectively, of MSC Income Fund’s total investment income was attributable to interest income from the accretion of discounts associated with debt investments, net of any premium amortization.
MSC INCOME FUND, INC.
Notes to the Consolidated Financial Statements (Continued)
7.Income Taxes
MSIF has elected to be treated for U.S. federal income tax purposes as a RIC. MSIF’s taxable income includes the taxable income generated by MSIF and certain of its subsidiaries, including the Structured Subsidiaries, which are treated as disregarded entities for tax purposes. As a RIC, MSIF generally will not pay corporate-level U.S. federal income taxes on any net ordinary taxable income or capital gains that MSIF distributes to its stockholders. MSIF must generally distribute at least 90% of its “investment company taxable income” (which is generally its net ordinary taxable income and realized net short-term capital gains in excess of realized net long-term capital losses) and 90% of its tax-exempt income to maintain its RIC status (pass-through tax treatment for amounts distributed). As part of maintaining RIC status, undistributed taxable income (subject to a 4% non-deductible U.S. federal excise tax) pertaining to a given fiscal year may be distributed up to twelve months subsequent to the end of that fiscal year, provided such dividends are declared on or prior to the later of (i) the filing of the U.S. federal income tax return for the applicable fiscal year or (ii) the fifteenth day of the ninth month following the close of the year in which such taxable income was generated.
The Taxable Subsidiaries primarily hold certain equity investments for MSC Income Fund. The Taxable Subsidiaries permit MSC Income Fund to hold equity investments in portfolio companies which are “pass-through” entities for tax purposes and to continue to comply with the “source-of-income” requirements contained in the RIC tax provisions of the Code. The Taxable Subsidiaries are consolidated with MSC Income Fund for U.S. GAAP financial reporting purposes, and the portfolio investments held by the Taxable Subsidiaries are included in MSC Income Fund’s consolidated financial statements as portfolio investments and recorded at fair value. The Taxable Subsidiaries are not consolidated with MSIF for income tax purposes and may generate income tax expense, or benefit, and tax assets and liabilities, as a result of their ownership of certain portfolio investments. The taxable income, or loss, of the Taxable Subsidiaries may differ from their book income, or loss, due to temporary book and tax timing differences and permanent differences. The Taxable Subsidiaries are each taxed at corporate income tax rates based on their taxable income. The income tax expense, or benefit, if any, and the related tax assets and liabilities, of the Taxable Subsidiaries are reflected in MSC Income Fund’s consolidated financial statements.
The Taxable Subsidiaries use the liability method in accounting for income taxes. Deferred tax assets and liabilities are recorded for temporary differences between the tax basis of assets and liabilities and their reported amounts in the consolidated financial statements, using statutory tax rates in effect for the year in which the temporary differences are expected to reverse. A valuation allowance is provided, if necessary, against deferred tax assets when it is more likely than not that some portion or all of the deferred tax asset will not be realized. MSC Income Fund’s net assets as included on the Consolidated Balance Sheets and Consolidated Statements of Changes in Net Assets include an adjustment to classification as a result of permanent book-to-tax differences, which include differences in the book and tax treatment of income and expenses.
Taxable income generally differs from net income for financial reporting purposes due to temporary and permanent differences in the recognition of income and expenses. Taxable income generally excludes net unrealized appreciation or depreciation, as investment gains or losses are not included in taxable income until they are realized.
8.Net Realized Gains or Losses and Net Unrealized Appreciation or Depreciation
Realized gains or losses are measured by the difference between the net proceeds from the sale or redemption of an investment or a financial instrument and the cost basis of the investment or financial instrument, without regard to unrealized appreciation or depreciation previously recognized, and includes investments written-off during the period net of recoveries and realized gains or losses from in-kind redemptions. Net unrealized appreciation or depreciation reflects the net change in the fair value of the Investment Portfolio and financial instruments and the reclassification of any prior period unrealized appreciation or depreciation on exited investments and financial instruments to realized gains or losses.
9.Fair Value of Financial Instruments
Fair value estimates are made at discrete points in time based on relevant information. These estimates may be subjective in nature and involve uncertainties and matters of significant judgment and, therefore, cannot be determined with precision. MSC Income Fund believes that the carrying amounts of its financial instruments, consisting of cash and cash equivalents, receivables, payables and other liabilities approximate the fair values of such items due to the short-term nature of these instruments.
MSC INCOME FUND, INC.
Notes to the Consolidated Financial Statements (Continued)
To estimate the fair value of MSC Income Fund’s Series A Notes as disclosed in Note E — Debt, MSC Income Fund uses the Yield-to-Maturity valuation method based on projections of the discounted future free cash flows that the debt security will likely generate, including both the discounted cash flows of the associated interest and principal amounts for the debt security. The inputs used to value MSC Income Fund’s debt instrument are considered to be Level 2 according to the ASC 820 fair value hierarchy.
10.Earnings per Share
Net increase in net assets resulting from operations per share and net investment income per share are computed utilizing the weighted-average number of shares of common stock outstanding for the period.
11.Recently Issued or Adopted Accounting Standards
In March 2020, the FASB issued ASU 2020-04, Reference rate reform (Topic 848) — Facilitation of the effects of reference rate reform on financial reporting. The amendments in this update provide optional expedients and exceptions for applying U.S. GAAP to certain contracts and hedging relationships that reference LIBOR or another reference rate expected to be discontinued due to reference rate reform and became effective upon issuance for all entities. The Company has agreements that have LIBOR as a reference rate with certain portfolio companies and also with certain lenders. Many of these agreements include language for choosing an alternative successor rate if LIBOR reference is no longer considered to be appropriate. Contract modifications are required to be evaluated in determining whether the modifications result in the establishment of new contracts or the continuation of existing contracts. The Company adopted this amendment in March 2020 and plans to apply the amendments in this update to account for contract modifications due to changes in reference rates when LIBOR reference is no longer used.
In November 2022, the FASB issued ASU 2022-06, Reference rate reform (Topic 848) — Deferral of the Sunset Date of Topic 848, which deferred the sunset date of Topic 848 from December 31, 2022 to December 31, 2024 after which entities will no longer be permitted to apply the relief in Topic 848. The Company utilized the optional expedients and exceptions provided by ASU 2020-04 and extended by ASU 2022-06 during the years ended December 31, 2023 and 2022, the effect of which was not material to the consolidated financial statements and the notes thereto. The Company will continue to utilize the optional expedients provided by ASU 2020-04 and extended by ASU 2022-06 through December 31, 2024. The Company does not expect ASU 2022-06 to have a material impact to the consolidated financial statements and the notes thereto.
In June 2022, the FASB issued ASU 2022-03, Fair Value Measurement of Equity Securities Subject to Contractual Sale Restrictions. The amendments in this update provide that a contractual restriction on the sale of an equity security is not considered part of the unit of account of the equity security and, therefore, is not considered in measuring fair value. The amendments in this update also require additional disclosures for equity securities subject to contractual sales restrictions. ASU 2022-03 is effective for years beginning after December 15, 2023, though early adoption is permitted. The Company elected to early adopt ASU 2022-03 as of December 31, 2022 and it did not have a material impact on the consolidated financial statements and the notes thereto.
In December 2023, the FASB issued ASU 2023-09, Improvements to Income Tax Disclosures. The amendments in this update require more disaggregated information on income taxes paid. ASU 2023-09 is effective for years beginning after December 15, 2024. Early adoption is permitted; however, the Company has not elected to adopt this provision as of the date of the financial statements contained in this report. The Company is still assessing the impact of the new guidance. However, it does not expect ASU 2023-09 to have a material impact on the consolidated financial statements and the notes thereto.
From time to time, new accounting pronouncements are issued by the FASB or other standards-setting bodies that are adopted by the Company as of the specified effective date. The Company believes that the impact of recently issued standards and any that are not yet effective will not have a material impact on its consolidated financial statements upon adoption.
NOTE C — FAIR VALUE HIERARCHY FOR INVESTMENTS—PORTFOLIO COMPOSITION
ASC 820 defines fair value, establishes a framework for measuring fair value, establishes a fair value hierarchy based on the quality of inputs used to measure fair value, and enhances disclosure requirements for fair value measurements. MSC Income Fund accounts for its investments at fair value.
MSC INCOME FUND, INC.
Notes to the Consolidated Financial Statements (Continued)
Fair Value Hierarchy
In accordance with ASC 820, MSC Income Fund has categorized its investments based on the priority of the inputs to the valuation technique into a three-level fair value hierarchy. The fair value hierarchy gives the highest priority to quoted prices in active markets for identical investments (Level 1) and the lowest priority to unobservable inputs (Level 3).
Investments recorded on MSC Income Fund’s Consolidated Balance Sheets are categorized based on the inputs to the valuation techniques as follows:
Level 1 — Investments whose values are based on unadjusted quoted prices for identical assets in an active market that MSC Income Fund has the ability to access (examples include investments in active exchange-traded equity securities and investments in most U.S. government and agency securities).
Level 2 — Investments whose values are based on quoted prices in markets that are not active or model inputs that are observable either directly or indirectly for substantially the full term of the investment. Level 2 inputs include the following:
•Quoted prices for similar assets in active markets (for example, investments in restricted stock);
•Quoted prices for identical or similar assets in non-active markets (for example, investments in thinly traded public companies);
•Pricing models whose inputs are observable for substantially the full term of the investment (for example, market interest rate indices); and
•Pricing models whose inputs are derived principally from, or corroborated by, observable market data through correlation or other means for substantially the full term of the investment.
Level 3 — Investments whose values are based on prices or valuation techniques that require inputs that are both unobservable and significant to the overall fair value measurement (for example, investments in illiquid securities issued by privately held companies). These inputs reflect management’s own assumptions about the assumptions a market participant would use in pricing the investment.
As required by ASC 820, when the inputs used to measure fair value fall within different levels of the hierarchy, the level within which the fair value measurement is categorized is based on the lowest level input that is significant to the fair value measurement in its entirety. For example, a Level 3 fair value measurement may include inputs that are observable (Levels 1 and 2) and unobservable (Level 3). Therefore, unrealized appreciation and depreciation related to such investments categorized within the Level 3 tables below may include changes in fair value that are attributable to both observable inputs (Levels 1 and 2) and unobservable inputs (Level 3).
As of December 31, 2023 and 2022, MSC Income Fund’s Private Loan portfolio investments primarily consisted of investments in secured debt investments. The fair value determination for these investments consisted of a combination of observable inputs in non-active markets for which sufficient observable inputs were not available to determine the fair value of these investments and unobservable inputs. As a result, all of MSC Income Fund’s Private Loan portfolio investments were categorized as Level 3 as of December 31, 2023 and 2022.
As of December 31, 2023 and 2022, all of MSC Income Fund’s LMM portfolio investments consisted of illiquid securities issued by privately held companies and the fair value determination for these investments primarily consisted of unobservable inputs. As a result, all of MSC Income Fund’s LMM portfolio investments were categorized as Level 3 as of December 31, 2023 and 2022.
As of December 31, 2023 and 2022, MSC Income Fund’s Middle Market portfolio investments consisted primarily of investments in secured and unsecured debt investments and independently rated debt investments. The fair value determination for these investments consisted of a combination of observable inputs in non-active markets for which sufficient observable inputs were not available to determine the fair value of these investments and unobservable inputs. As a result, all of MSC Income Fund’s Middle Market portfolio investments were categorized as Level 3 as of December 31, 2023 and 2022.
MSC INCOME FUND, INC.
Notes to the Consolidated Financial Statements (Continued)
As of December 31, 2023 and 2022, MSC Income Fund’s Other Portfolio investments consisted of illiquid securities issued by privately held entities and the fair value determination for these investments primarily consisted of unobservable inputs. As a result, all of MSC Income Fund’s Other Portfolio investments were categorized as Level 3 as of December 31, 2023 and 2022.
As of December 31, 2023, all money market funds included in cash and cash equivalents were valued using Level 1 inputs.
The fair value determination of each portfolio investment categorized as Level 3 required one or more of the following unobservable inputs:
•Financial information obtained from each portfolio company, including unaudited statements of operations and balance sheets for the most recent period available as compared to budgeted numbers;
•Current and projected financial condition of the portfolio company;
•Current and projected ability of the portfolio company to service its debt obligations;
•Type and amount of collateral, if any, underlying the investment;
•Current financial ratios (e.g., fixed charge coverage ratio, interest coverage ratio and net debt/ EBITDA ratio) applicable to the investment;
•Current liquidity of the investment and related financial ratios (e.g., current ratio and quick ratio);
•Pending debt or capital restructuring of the portfolio company;
•Projected operating results of the portfolio company;
•Current information regarding any offers to purchase the investment;
•Current ability of the portfolio company to raise any additional financing as needed;
•Changes in the economic environment which may have a material impact on the operating results of the portfolio company;
•Internal occurrences that may have an impact (both positive and negative) on the operating performance of the portfolio company;
•Qualitative assessment of key management;
•Contractual rights, obligations or restrictions associated with the investment; and
•Other factors deemed relevant.
MSC INCOME FUND, INC.
Notes to the Consolidated Financial Statements (Continued)
The use of significant unobservable inputs creates uncertainty in the measurement of fair value as of the reporting date. The significant unobservable inputs used in the fair value measurement of MSC Income Fund’s LMM equity securities, which are generally valued through an average of the discounted cash flow technique and the market comparable/enterprise value technique (unless one of these approaches is determined to not be appropriate), are (i) EBITDA multiples and (ii) the weighted-average cost of capital (“WACC”). Significant increases (decreases) in EBITDA multiple inputs in isolation would result in a significantly higher (lower) fair value measurement. On the contrary, significant increases (decreases) in WACC inputs in isolation would result in a significantly lower (higher) fair value measurement. The significant unobservable inputs used in the fair value measurement of MSC Income Fund’s Private Loan, LMM and Middle Market securities are (i) risk adjusted discount rates used in the Yield-to-Maturity valuation technique (see Note B.1. — Summary of Significant Accounting Policies — Valuation of the Investment Portfolio) and (ii) the percentage of expected principal recovery. Significant increases (decreases) in any of these discount rates in isolation would result in a significantly lower (higher) fair value measurement. Significant increases (decreases) in any of these expected principal recovery percentages in isolation would result in a significantly higher (lower) fair value measurement. However, due to the nature of certain investments, fair value measurements may be based on other criteria, such as third-party appraisals of collateral and fair values as determined by independent third parties, which are not presented in the tables below.
The following tables provide a summary of the significant unobservable inputs used to fair value MSC Income Fund’s Level 3 portfolio investments as of December 31, 2023 and 2022:
| | | | | | | | | | | | | | | | | | | | | | | | | | | | | | | | | | | | | | |
Type of
Investment | | Fair Value as of December 31, 2023 (in thousands) | | Valuation Technique | | Significant
Unobservable Inputs | | Range(3) | | Weighted Average(3) | | Median(3) |
| Equity investments | | $ | 254,770 | | | Discounted cash flow | | WACC | | 10.9% - 22.5% | | 14.4 | % | | 15.5 | % |
| | | | Market comparable / Enterprise value | | EBITDA multiple (1) | | 4.9x - 9.2x (2) | | 7.3x | | 6.5x |
| Debt investments | | $ | 777,003 | | | Discounted cash flow | | Risk adjusted discount factor (4) | | 9.8% - 16.8% (2) | | 13.1 | % | | 12.8 | % |
| | | | | | Expected principal recovery percentage | | 0.6% - 100.0% | | 99.6 | % | | 100.0 | % |
| Debt investments | | $ | 61,122 | | | Market approach | | Third-party quote | | 4.5 - 99.2 | | 85.0 | | 89.5 |
| Total Level 3 investments | | $ | 1,092,895 | | | | | | | | | | | |
_____________________________
(1)EBITDA may include proforma adjustments and/or other addbacks based on specific circumstances related to each investment.
(2)Range excludes outliers that are greater than one standard deviation from the mean. Including these outliers, the range for EBITDA multiple is 2.0x - 15.7x and the range for risk adjusted discount factor is 8.0% - 27.3%.
(3)Does not include investments for which the valuation technique does not include the use of the applicable fair value input.
(4)Discount rate includes the effect of the standard SOFR base rate, as applicable.
MSC INCOME FUND, INC.
Notes to the Consolidated Financial Statements (Continued)
| | | | | | | | | | | | | | | | | | | | | | | | | | | | | | | | | | | | | | |
Type of
Investment | | Fair Value as of December 31, 2022 (in thousands) | | Valuation Technique | | Significant
Unobservable Inputs | | Range(3) | | Weighted
Average(3) | | Median(3) |
| Equity investments | | $ | 215,861 | | | Discounted cash flow | | WACC | | 10.4% - 22.5% | | 14.3 | % | | 15.7 | % |
| | | | Market comparable / Enterprise value | | EBITDA multiple (1) | | 4.3x - 8.5x (2) | | 7.2x | | 6.4x |
| Debt investments | | $ | 743,887 | | | Discounted cash flow | | Risk adjusted discount factor (4) | | 8.5% - 18.2% (2) | | 13.0 | % | | 12.4 | % |
| | | | | | Expected principal recovery percentage | | 0.7% - 100.0% | | 99.1 | % | | 100.0 | % |
| Debt investments | | $ | 108,395 | | | Market approach | | Third-party quote | | 5.6 - 98.5 | | 85.7 | | 90.0 |
| Total Level 3 investments | | $ | 1,068,143 | | | | | | | | | | | |
_____________________________
(1)EBITDA may include proforma adjustments and/or other addbacks based on specific circumstances related to each investment.
(2)Range excludes outliers that are greater than one standard deviation from the mean. Including these outliers, the range for EBITDA multiple is 2.0x - 15.7x and the range for risk adjusted discount factor is 6.5% - 43.3%.
(3)Does not include investments for which the valuation technique does not include the use of the applicable fair value input.
(4)Discount rate includes the effect of the standard LIBOR and SOFR base rate, as applicable.
The following tables provide a summary of changes in fair value of MSC Income Fund’s Level 3 portfolio investments for the years ended December 31, 2023 and 2022 (amounts in thousands):
| | | | | | | | | | | | | | | | | | | | | | | | | | | | | | | | | | | | | | | | | | | | | | | | | | |
Type of
Investment | | Fair Value as of December 31, 2022 | | Transfers
Into
Level 3
Hierarchy | | Redemptions/
Repayments | | New
Investments | | Net
Changes
from
Unrealized
to Realized | | Net
Unrealized
Appreciation
(Depreciation) | | Other(1) | | Fair Value as of December 31, 2023 |
| Debt | | $ | 852,282 | | | $ | — | | | $ | (253,517) | | | $ | 230,663 | | | $ | 33,078 | | | $ | (5,467) | | | $ | (18,914) | | | $ | 838,125 | |
| Equity | | 214,687 | | | — | | | (15,329) | | | 16,377 | | | 923 | | | 17,352 | | | 20,019 | | | 254,029 | |
| Equity Warrant | | 1,174 | | | — | | | (284) | | | 523 | | | 284 | | | 149 | | | (1,105) | | | 741 | |
| | $ | 1,068,143 | | | $ | — | | | $ | (269,130) | | | $ | 247,563 | | | $ | 34,285 | | | $ | 12,034 | | | $ | — | | | $ | 1,092,895 | |
_____________________________
(1)Includes the impact of non-cash conversions. These transactions represent non-cash investing activities. See additional cash flow information in the Consolidated Statements of Cash Flows.
| | | | | | | | | | | | | | | | | | | | | | | | | | | | | | | | | | | | | | | | | | | | | | | | | | |
Type of
Investment | | Fair Value as of December 31, 2021 | | Transfers
Into
Level 3
Hierarchy | | Redemptions/
Repayments | | New
Investments | | Net
Changes
from
Unrealized
to Realized | | Net
Unrealized
Appreciation
(Depreciation) | | Other(1) | | Fair Value as of December 31, 2022 |
| Debt | | $ | 879,970 | | | $ | — | | | $ | (205,481) | | | $ | 211,631 | | | $ | 10,645 | | | $ | (42,747) | | | $ | (1,736) | | | $ | 852,282 | |
| Equity | | 196,374 | | | — | | | (22,234) | | | 7,728 | | | (7,037) | | | 38,120 | | | 1,736 | | | 214,687 | |
| Equity Warrant | | 792 | | | — | | | (45) | | | 1,111 | | | (305) | | | (379) | | | — | | | 1,174 | |
| | $ | 1,077,136 | | | $ | — | | | $ | (227,760) | | | $ | 220,470 | | | $ | 3,303 | | | $ | (5,006) | | | $ | — | | | $ | 1,068,143 | |
_____________________________
(1)Includes the impact of non-cash conversions. These transactions represent non-cash investing activities. See additional cash flow information in the Consolidated Statements of Cash Flows.
MSC INCOME FUND, INC.
Notes to the Consolidated Financial Statements (Continued)
At December 31, 2023 and 2022, MSC Income Fund’s investments at fair value were categorized as follows in the fair value hierarchy for ASC 820 purposes:
| | | | | | | | | | | | | | | | | | | | | | | | | | |
| | | | Fair Value Measurements |
| | | | (in thousands) |
At December 31, 2023 | | Fair Value | | Quoted Prices in
Active Markets for
Identical Assets
(Level 1) | | Significant Other
Observable Inputs
(Level 2) | | Significant
Unobservable
Inputs
(Level 3) |
| Private Loan portfolio investments | | $ | 595,326 | | | $ | — | | | $ | — | | | $ | 595,326 | |
| LMM portfolio investments | | 386,956 | | | — | | | — | | | 386,956 | |
| Middle Market portfolio investments | | 85,990 | | | — | | | — | | | 85,990 | |
| Other Portfolio investments | | 24,623 | | | — | | | — | | | 24,623 | |
| Total investments | | $ | 1,092,895 | | | $ | — | | | $ | — | | | $ | 1,092,895 | |
| | | | | | | | | | | | | | | | | | | | | | | | | | |
| | | | Fair Value Measurements |
| | | | (in thousands) |
At December 31, 2022 | | Fair Value | | Quoted Prices in
Active Markets for
Identical Assets
(Level 1) | | Significant Other
Observable Inputs
(Level 2) | | Significant
Unobservable
Inputs
(Level 3) |
| Private Loan portfolio investments | | $ | 559,763 | | | $ | — | | | $ | — | | | $ | 559,763 | |
| LMM portfolio investments | | 352,661 | | | — | | | — | | | 352,661 | |
| Middle Market portfolio investments | | 126,744 | | | — | | | — | | | 126,744 | |
| Other Portfolio investments | | 28,975 | | | — | | | — | | | 28,975 | |
| Total investments | | $ | 1,068,143 | | | $ | — | | | $ | — | | | $ | 1,068,143 | |
Investment Portfolio Composition
MSC Income Fund’s principal investment objective is to maximize its portfolio’s total return by generating current income from its debt investments and current income and capital appreciation from its equity and equity-related investments, including warrants, convertible securities and other rights to acquire equity securities in a portfolio company. MSC Income Fund seeks to achieve its investment objective through its Private Loan, LMM and Middle Market investment strategies.
MSC Income Fund’s private loan (“Private Loan”) investment strategy is focused on investments in privately held companies that are generally consistent with the size of its LMM portfolio companies or Middle Market portfolio companies, and its Private Loan investments generally range in size from $1 million to $20 million. MSC Income Fund’s Private Loan investments primarily consist of debt securities that have primarily been originated directly by the Adviser or, to a lesser extent, through the Adviser’s strategic relationships with other investment funds on a collaborative basis through investments that are often referred to in the debt markets as “club deals” because of the small lender group size. In both cases, our Private Loan investments are typically made to support a company owned by or in the process of being acquired by a private equity sponsor. MSC Income Fund’s Private Loan portfolio debt investments are generally secured by a first priority lien on the assets of the portfolio company and typically have a term of between three and seven years from the original investment date. MSC Income Fund may have the option to co-invest with Main Street and the private equity sponsor in the equity securities of its Private Loan portfolio companies.
MSC Income Fund’s LMM investment strategy is focused on investments in secured debt, equity warrants and direct equity investments in privately held, LMM companies based in the United States. MSC Income Fund’s LMM portfolio companies generally have annual revenues between $10 million and $150 million, and its LMM investments generally range in size from $1 million to $20 million. The LMM debt investments are typically secured by a first priority lien on the assets of the portfolio company, can include either fixed or floating rate terms and generally have a term of between five and seven years from the original investment date. In most LMM portfolio investments, MSC Income Fund receives nominally priced equity warrants and/or makes direct equity investments in connection with a debt investment.
MSC INCOME FUND, INC.
Notes to the Consolidated Financial Statements (Continued)
MSC Income Fund’s Middle Market investment strategy is focused on investments in syndicated loans to or debt securities in Middle Market companies, which MSC Income Fund defines as companies with annual revenues between $150 million and $1.5 billion, and its Middle Market investments generally range in size from $1 million to $20 million. MSC Income Fund’s Middle Market portfolio debt investments are generally secured by a first priority lien on the assets of the portfolio company and typically have an expected duration of between three and seven years from the original investment date.
MSC Income Fund’s other portfolio (“Other Portfolio”) investments primarily consist of investments that are not consistent with the typical profiles for its Private Loan, LMM or Middle Market portfolio investments, including investments which may be managed by third parties. In the Other Portfolio, MSC Income Fund may incur indirect fees and expenses in connection with investments managed by third parties, such as investments in other investment companies or private funds. For Other Portfolio investments, MSC Income Fund generally receives distributions related to the assets held by the portfolio company. Those assets are typically expected to be liquidated over a five to ten-year period.
Investment income, consisting of interest, dividends and fees, can fluctuate dramatically due to various factors, including the level of new investment activity, repayments of debt investments or sales of equity interests. Investment income in any given year could also be highly concentrated among several portfolio companies. For the years ended December 31, 2023, 2022 and 2021, MSC Income Fund did not record investment income from any single portfolio company in excess of 10% of total investment income.
The following tables provide a summary of MSC Income Fund’s investments in the Private Loan, LMM and Middle Market portfolios as of December 31, 2023 and 2022 (this information excludes Other Portfolio investments, which are discussed further below):
| | | | | | | | | | | | | | | | | |
| As of December 31, 2023 |
| Private Loan | | LMM (a) | | Middle Market |
| (dollars in millions) |
| Number of portfolio companies | 78 | | 50 | | 16 |
| Fair value | $ | 595.3 | | | $ | 387.0 | | | $ | 86.0 | |
| Cost | $ | 586.4 | | | $ | 315.7 | | | $ | 114.7 | |
| Debt investments as a % of portfolio (at cost) | 94.1 | % | | 70.2 | % | | 93.1 | % |
| Equity investments as a % of portfolio (at cost) | 5.9 | % | | 29.8 | % | | 6.9 | % |
| % of debt investments at cost secured by first priority lien | 100.0 | % | | 99.9 | % | | 100.0 | % |
| Weighted-average annual effective yield (b) | 13.1 | % | | 13.0 | % | | 13.0 | % |
| Average EBITDA (c) | $ | 30.5 | | | $ | 8.8 | | | $ | 74.2 | |
_____________________________(a)At December 31, 2023, MSC Income Fund had equity ownership in all of its LMM portfolio companies, and the average fully diluted equity ownership in those portfolio companies was 9%.
(b)The weighted-average annual effective yields were computed using the effective interest rates for all debt investments at cost as of December 31, 2023, including amortization of deferred debt origination fees and accretion of original issue discount but excluding fees payable upon repayment of the debt instruments and any debt investments on non-accrual status. The weighted-average annual effective yield on MSC Income Fund’s debt portfolio as of December 31, 2023 including debt investments on non-accrual status was 12.6% for its Private Loan portfolio, 13.0% for its LMM portfolio and 9.9% for its Middle Market portfolio. The weighted-average annual effective yield is not reflective of what an investor in shares of MSC Income Fund’s common stock will realize on its investment because it does not reflect MSC Income Fund’s utilization of debt capital in its capital structure, MSC Income Fund’s expenses or any sales load paid by an investor.
(c)The average EBITDA is calculated using a weighted-average for the Private Loan and Middle Market portfolios and a simple average for the LMM portfolio. These calculations exclude one Private Loan portfolio company, as EBITDA is not a meaningful valuation metric for MSC Income Fund’s investment in this portfolio company and those portfolio companies whose primary purpose is to own real estate.
MSC INCOME FUND, INC.
Notes to the Consolidated Financial Statements (Continued)
| | | | | | | | | | | | | | | | | |
| As of December 31, 2022 |
| Private Loan | | LMM (a) | | Middle Market |
| (dollars in millions) |
| Number of portfolio companies | 70 | | 48 | | 21 |
| Fair value | $ | 559.8 | | | $ | 352.7 | | | $ | 126.7 | |
| Cost | $ | 563.0 | | | $ | 312.5 | | | $ | 159.7 | |
| Debt investments as a % of portfolio (at cost) | 96.2 | % | | 73.2 | % | | 95.0 | % |
| Equity investments as a % of portfolio (at cost) | 3.8 | % | | 26.8 | % | | 5.0 | % |
| % of debt investments at cost secured by first priority lien | 99.4 | % | | 99.9 | % | | 98.5 | % |
| Weighted-average annual effective yield (b) | 11.8 | % | | 12.1 | % | | 11.3 | % |
| Average EBITDA (c) | $ | 36.8 | | | $ | 8.6 | | | $ | 79.2 | |
_____________________________
(a)At December 31, 2022, MSC Income Fund had equity ownership in all of its LMM portfolio companies, and the average fully diluted equity ownership in those portfolio companies was 9%.
(b)The weighted-average annual effective yields were computed using the effective interest rates for all debt investments at cost as of December 31, 2022, including amortization of deferred debt origination fees and accretion of original issue discount but excluding fees payable upon repayment of the debt instruments and any debt investments on non-accrual status. The weighted-average annual effective yield on MSC Income Fund’s debt portfolio as of December 31, 2022 including debt investments on non-accrual status was 11.4% for its Private Loan portfolio, 11.7% for its LMM portfolio and 9.7% for its Middle Market portfolio. The weighted-average annual effective yield is not reflective of what an investor in shares of MSC Income Fund’s common stock will realize on its investment because it does not reflect MSC Income Fund’s utilization of debt capital in its capital structure, MSC Income Fund’s expenses or any sales load paid by an investor.
(c)The average EBITDA is calculated using a weighted-average for the Private Loan and Middle Market portfolios and a simple average for the LMM portfolio. These calculations exclude certain portfolio companies, including one Private Loan portfolio company, as EBITDA is not a meaningful valuation metric for MSC Income Fund’s investment in this portfolio company, and those portfolio companies whose primary purpose is to own real estate.
For the years ended December 31, 2023 and 2022, MSC Income Fund achieved a total return on investments of 13.6% and 9.1%, respectively. Total return on investments is calculated using the interest, dividend and fee income, as well as the realized and unrealized change in fair value of the Investment Portfolio for the specified period. MSC Income Fund’s total return on investments is not reflective of what an investor in shares of MSC Income Fund’s common stock will realize on its investment because it does not reflect MSC Income Fund’s utilization of debt capital in its capital structure, MSC Income Fund’s expenses or any sales load paid by an investor.
As of December 31, 2023, MSC Income Fund had Other Portfolio investments in four entities, collectively totaling $24.6 million in fair value and $21.5 million in cost basis and which comprised 2.3% and 2.1% of MSC Income Fund’s Investment Portfolio at fair value and cost, respectively. As of December 31, 2022, MSC Income Fund had Other Portfolio investments in four entities, collectively totaling $29.0 million in fair value and $24.7 million in cost basis and which comprised 2.7% and 2.3% of MSC Income Fund’s Investment Portfolio at fair value and cost, respectively.
MSC INCOME FUND, INC.
Notes to the Consolidated Financial Statements (Continued)
The following tables summarize the composition of MSC Income Fund’s total combined Private Loan, LMM and Middle Market portfolio investments at cost and fair value by type of investment as a percentage of the total combined Private Loan, LMM and Middle Market portfolio investments, as of December 31, 2023 and 2022 (this information excludes Other Portfolio investments).
| | | | | | | | | | | | | | |
| Cost: | | December 31, 2023 | | December 31, 2022 |
| First lien debt | | 86.5 | % | | 88.5 | % |
| Equity | | 13.3 | | | 10.8 | |
| Second lien debt | | — | | | 0.3 | |
| Equity warrants | | 0.2 | | | 0.2 | |
| Other | | — | | | 0.2 | |
| | 100.0 | % | | 100.0 | % |
| | | | | | | | | | | | | | |
| Fair Value: | | December 31, 2023 | | December 31, 2022 |
| First lien debt | | 78.4 | % | | 81.4 | % |
| Equity | | 21.5 | | | 17.9 | |
| Second lien debt | | — | | | 0.3 | |
| Equity warrants | | 0.1 | | | 0.1 | |
| Other | | — | | | 0.3 | |
| | 100.0 | % | | 100.0 | % |
The following tables summarize the composition of MSC Income Fund’s total combined Private Loan, LMM and Middle Market portfolio investments by geographic region of the United States and other countries at cost and fair value as a percentage of the total combined Private Loan, LMM and Middle Market portfolio investments, as of December 31, 2023 and 2022 (this information excludes Other Portfolio investments). The geographic composition is determined by the location of the corporate headquarters of the portfolio company.
| | | | | | | | | | | | | | |
| Cost: | | December 31, 2023 | | December 31, 2022 |
| Southwest | | 23.8 | % | | 22.2 | % |
| Northeast | | 21.9 | | | 20.3 | |
| Southeast | | 17.8 | | | 17.8 | |
| Midwest | | 17.6 | | | 15.1 | |
| West | | 17.0 | | | 22.9 | |
| Canada | | 0.8 | | | 0.8 | |
| Other Non-United States | | 1.1 | | | 0.9 | |
| | 100.0 | % | | 100.0 | % |
| | | | | | | | | | | | | | |
| Fair Value: | | December 31, 2023 | | December 31, 2022 |
| Southwest | | 26.8 | % | | 25.3 | % |
| Northeast | | 21.6 | | | 20.3 | |
| Midwest | | 18.3 | | | 15.9 | |
| West | | 16.4 | | | 21.1 | |
| Southeast | | 15.0 | | | 15.2 | |
| Canada | | 0.8 | | | 1.2 | |
| Other Non-United States | | 1.1 | | | 1.0 | |
| | 100.0 | % | | 100.0 | % |
MSC INCOME FUND, INC.
Notes to the Consolidated Financial Statements (Continued)
MSC Income Fund’s Private Loan, LMM and Middle Market portfolio investments are in companies conducting business in a variety of industries. The following tables summarize the composition of MSC Income Fund’s total combined Private Loan, LMM and Middle Market portfolio investments by industry at cost and fair value as of December 31, 2023 and 2022 (this information excludes Other Portfolio investments).
| | | | | | | | | | | | | | |
| Cost: | | December 31, 2023 | | December 31, 2022 |
| Internet Software & Services | | 8.8 | % | | 7.8 | % |
| Commercial Services & Supplies | | 8.5 | | | 11.3 | |
| Health Care Providers & Services | | 6.5 | | | 4.9 | |
| Machinery | | 6.0 | | | 5.9 | |
| Professional Services | | 5.7 | | | 3.7 | |
| Diversified Consumer Services | | 5.4 | | | 4.7 | |
| IT Services | | 5.2 | | | 4.9 | |
| Distributors | | 4.4 | | | 5.0 | |
| Containers & Packaging | | 4.3 | | | 3.4 | |
| Leisure Equipment & Products | | 3.7 | | | 3.7 | |
| Textiles, Apparel & Luxury Goods | | 3.1 | | | 2.0 | |
| Computers & Peripherals | | 2.9 | | | 1.9 | |
| Specialty Retail | | 2.7 | | | 4.0 | |
| Communications Equipment | | 2.7 | | | 3.5 | |
| Aerospace & Defense | | 2.6 | | | 3.6 | |
| Media | | 2.5 | | | 2.4 | |
| Construction & Engineering | | 2.5 | | | 2.5 | |
| Electrical Equipment | | 2.2 | | | 1.8 | |
| Building Products | | 2.1 | | | 2.4 | |
| Hotels, Restaurants & Leisure | | 2.1 | | | 2.0 | |
| Diversified Financial Services | | 2.1 | | | 1.7 | |
| Household Products | | 2.0 | | | 1.5 | |
| Internet & Catalog Retail | | 1.6 | | | 1.3 | |
| Food & Staples Retailing | | 1.5 | | | 0.9 | |
| Software | | 1.4 | | | 1.3 | |
| Health Care Equipment & Supplies | | 1.3 | | | 1.2 | |
| Food Products | | 0.9 | | | 1.1 | |
| Energy Equipment & Services | | 0.5 | | | 1.2 | |
| | | | |
| | | | |
| Diversified Telecommunication Services | | 0.1 | | | 3.4 | |
| | | | |
| | | | |
| | | | |
| | | | |
| | | | |
| | | | |
| | | | |
| | | | |
| | | | |
| | | | |
| | | | |
| | | | |
| | | | |
| | | | |
| | | | |
| | | | |
| | | | |
| | | | |
| | | | |
| | | | |
| | | | |
| | | | |
| | | | |
| | | | |
| | | | |
| | | | |
| | | | |
| Other (1) | | 4.7 | | | 5.0 | |
| | 100.0 | % | | 100.0 | % |
_____________________________
(1)Includes various industries with each industry individually less than 1.0% of the total combined Private Loan, LMM and Middle Market portfolio investments at each date.
MSC INCOME FUND, INC.
Notes to the Consolidated Financial Statements (Continued)
| | | | | | | | | | | | | | |
| Fair Value: | | December 31, 2023 | | December 31, 2022 |
| Machinery | | 7.4 | % | | 7.5 | % |
| Commercial Services & Supplies | | 7.3 | | | 10.3 | |
| Internet Software & Services | | 7.3 | | | 6.7 | |
| Diversified Consumer Services | | 6.5 | | | 5.9 | |
| Health Care Providers & Services | | 6.0 | | | 4.6 | |
| Professional Services | | 5.5 | | | 2.8 | |
| IT Services | | 5.0 | | | 4.7 | |
| Distributors | | 4.6 | | | 5.5 | |
| Computers & Peripherals | | 4.6 | | | 2.8 | |
| Containers & Packaging | | 4.6 | | | 3.8 | |
| Leisure Equipment & Products | | 3.3 | | | 3.7 | |
| Construction & Engineering | | 3.1 | | | 2.9 | |
| Textiles, Apparel & Luxury Goods | | 2.9 | | | 2.0 | |
| Specialty Retail | | 2.7 | | | 3.1 | |
| Media | | 2.6 | | | 2.6 | |
| Aerospace & Defense | | 2.5 | | | 3.5 | |
| Electrical Equipment | | 2.3 | | | 1.9 | |
| Construction Materials | | 2.2 | | | 2.1 | |
| Diversified Financial Services | | 2.0 | | | 1.8 | |
| Building Products | | 1.9 | | | 2.5 | |
| Household Products | | 1.9 | | | 1.3 | |
| Software | | 1.7 | | | 1.7 | |
| Air Freight & Logistics | | 1.6 | | | 1.2 | |
| Hotels, Restaurants & Leisure | | 1.6 | | | 1.5 | |
| Internet & Catalog Retail | | 1.5 | | | 1.9 | |
| Food & Staples Retailing | | 1.2 | | | 0.8 | |
| Communications Equipment | | 1.1 | | | 1.3 | |
| Energy Equipment & Services | | 0.3 | | | 1.0 | |
| | | | |
| | | | |
| | | | |
| Diversified Telecommunication Services | | 0.1 | | | 3.6 | |
| | | | |
| | | | |
| | | | |
| | | | |
| | | | |
| | | | |
| | | | |
| | | | |
| | | | |
| | | | |
| | | | |
| | | | |
| | | | |
| | | | |
| | | | |
| | | | |
| | | | |
| | | | |
| | | | |
| | | | |
| | | | |
| | | | |
| | | | |
| | | | |
| | | | |
| | | | |
| Other (1) | | 4.7 | | | 5.0 | |
| | 100.0 | % | | 100.0 | % |
_____________________________(1)Includes various industries with each industry individually less than 1.0% of the total combined Private Loan, LMM and Middle Market portfolio investments at each date.
At December 31, 2023 and 2022, MSC Income Fund had no portfolio investment that was greater than 10% of the Investment Portfolio at fair value.
MSC INCOME FUND, INC.
Notes to the Consolidated Financial Statements (Continued)
Unconsolidated Significant Subsidiaries
In accordance with Rules 3-09 and 4-08(g) of Regulation S-X, MSC Income Fund must determine which of its unconsolidated controlled portfolio companies, if any, are considered “significant subsidiaries.” In evaluating its unconsolidated controlled portfolio companies in accordance with Regulation S-X, there are two tests that MSC Income Fund must utilize to determine if any of MSC Income Fund’s Control Investments (as defined in Note A — Organization and Basis of Presentation, including those unconsolidated portfolio companies defined as Control Investments in which MSC Income Fund does not own greater than 50% of the voting securities nor have rights to maintain greater than 50% of the board representation) are considered significant subsidiaries: the investment test and the income test. The investment test is generally measured by dividing MSC Income Fund’s investment in the Control Investment by the value of MSC Income Fund’s total investments. The income test is generally measured by dividing the absolute value of the combined sum of total investment income, net realized gain (loss) and net unrealized appreciation (depreciation) from the relevant Control Investment for the period being tested by the absolute value of MSC Income Fund’s change in net assets resulting from operations for the same period. Rules 3-09 and 4-08(g) of Regulation S-X require MSC Income Fund to include (1) separate audited financial statements of an unconsolidated majority-owned subsidiary (Control Investments in which MSC Income Fund owns greater than 50% of the voting securities) in an annual report and (2) summarized financial information of a Control Investment in a quarterly report, respectively, if certain thresholds of the investment or income tests are exceeded and the unconsolidated portfolio company qualifies as a significant subsidiary.
As of December 31, 2023, 2022 and 2021, MSC Income Fund had no single investment that qualified as a significant subsidiary under either the investment or income tests.
NOTE D — INVESTMENT IN SIGNAL PEAK CLO 7, LTD.
On December 16, 2021, MSC Income Fund sold its entire position in the Signal Peak CLO 7, Ltd., a limited liability company which invested primarily in broadly-syndicated loans, for $17.4 million, resulting in a realized loss of $3.7 million. For the year December 31, 2021, MSC Income Fund recognized $2.2 million of interest income in respect of its investment in Signal Peak CLO.
NOTE E — DEBT
Summary of MSC Income Fund’s debt as of December 31, 2023 is as follows:
| | | | | | | | | | | | | | | | | | | | | | | |
| Outstanding Balance | | Unamortized Debt Issuance
Costs (1) | | Recorded Value | | Estimated Fair Value (2) |
| (dollars in thousands) |
| | | | | | | |
| SPV Facility | $ | 203,688 | | | $ | — | | | $ | 203,688 | | | $ | 203,688 | |
| | | | | | | |
| Series A Notes | 150,000 | | | (845) | | | 149,155 | | | 141,531 | |
| Corporate Facility | 132,000 | | | — | | | 132,000 | | | 132,000 | |
| Total Debt | $ | 485,688 | | | $ | (845) | | | $ | 484,843 | | | $ | 477,219 | |
_____________________________
(1)The unamortized debt issuance costs for the Credit Facilities are reflected as Deferred financing costs on the Consolidated Balance Sheets, while the deferred debt issuance costs related to the Series A Notes are reflected as a contra-liability to the Series A Notes on the Consolidated Balance Sheets.
(2)Estimated fair value for outstanding debt if MSC Income Fund had adopted the fair value option under ASC 825. See discussion of the methods used to estimate the fair value of MSC Income Fund’s debt in Note B.9. — Summary of Significant Accounting Policies — Fair Value of Financial Instruments.
MSC INCOME FUND, INC.
Notes to the Consolidated Financial Statements (Continued)
Summary of MSC Income Fund’s debt as of December 31, 2022 is as follows:
| | | | | | | | | | | | | | | | | | | | | | | |
| Outstanding Balance | | Unamortized Debt Issuance Costs (1) | | Recorded Value | | Estimated Fair Value (2) |
| (dollars in thousands) |
| | | | | | | |
| SPV Facility | $ | 223,688 | | | $ | — | | | $ | 223,688 | | | $ | 223,688 | |
| | | | | | | |
| Series A Notes | 150,000 | | | (1,144) | | | 148,856 | | | 132,955 | |
| Corporate Facility | 98,000 | | | — | | | 98,000 | | | 98,000 | |
| Total Debt | $ | 471,688 | | | $ | (1,144) | | | $ | 470,544 | | | $ | 454,643 | |
_____________________________
(1)The unamortized debt issuance costs for the Credit Facilities are reflected as Deferred financing costs on the Consolidated Balance Sheets, while the deferred debt issuance costs related to the Series A Notes are reflected as a contra-liability to the Series A Notes on the Consolidated Balance Sheets.
(2)Estimated fair value for outstanding debt if MSC Income Fund had adopted the fair value option under ASC 825. See discussion of the methods used to estimate the fair value of MSC Income Fund’s debt in Note B.9. — Summary of Significant Accounting Policies — Fair Value of Financial Instruments.
Summarized interest expense for the years ended December 31, 2023, 2022 and 2021 is as follows:
| | | | | | | | | | | | | | | | | | | | | |
| | | Year Ended December 31, |
| | | | | 2023 | | 2022 | | 2021 |
| | | | | (dollars in thousands) |
| SPV Facility | | | | | $ | 22,184 | | | $ | 13,856 | | | $ | 8,255 | |
| Series A Notes | | | | | 6,358 | | | 6,167 | | | 653 | |
| Corporate Facility | | | | | 7,916 | | | 4,400 | | | 2,681 | |
| Deutsche Bank Credit Facility(1) | | | | | — | | | — | | | 1,045 | |
| Main Street Term Loan(2) | | | | | — | | | — | | | 1,835 | |
| Total Interest Expense | | | | | $ | 36,458 | | | $ | 24,423 | | | $ | 14,469 | |
_____________________________
(1)Deutsche Bank Credit Facility was fully repaid and extinguished on February 3, 2021.
(2)Main Street Term Loan was fully repaid and extinguished on October 22, 2021.
MSC INCOME FUND, INC.
Notes to the Consolidated Financial Statements (Continued)
Corporate Facility
MSC Income Fund is a party to a senior secured revolving credit agreement dated March 6, 2017 (as amended, the “Corporate Facility”) with EverBank (formerly known as TIAA Bank), as administrative agent, and with EverBank and other financial institutions as lenders. As of December 31, 2023, the Corporate Facility included (i) total commitments of $165.0 million, (ii) an accordion feature with the right to request an increase in commitments under the facility from new and existing lenders on the same terms and conditions as the existing commitments up to $200.0 million of total commitments and (iii) a revolving period and maturity date to September 1, 2025 and March 1, 2026, respectively, with two, one-year extension options subject to lender approval.
Borrowings under the Corporate Facility bear interest, subject to MSC Income Fund’s election, on a per annum basis at a rate equal to (i) SOFR plus 2.50% or (ii) the base rate plus 1.40%. The base rate is defined as the higher of (a) the Prime rate, (b) the Federal Funds Rate (as defined in the credit agreement) plus 0.5% or (c) SOFR plus 1.1%. Additionally, MSC Income Fund pays an annual unused commitment fee of 0.30% per annum on the unused lender commitments if more than 50% or more of the lender commitments are being used and an annual unused commitment fee of 0.625% per annum on the unused lender commitments if less than 50% of the lender commitments are being used. Borrowings under the Corporate Facility are secured by a first lien on all of the assets of MSIF and its subsidiaries, excluding the assets of Structured Subsidiaries or immaterial subsidiaries, as well as all of the assets, and a pledge of equity ownership interests, of any future subsidiaries of MSIF (other than Structured Subsidiaries or immaterial subsidiaries). In connection with the Corporate Facility, MSIF has made customary representations and warranties and is required to comply with various covenants, reporting requirements and other customary requirements for similar credit facilities. Effective April 27, 2023, the reference rate under the Corporate Facility was amended from LIBOR to SOFR plus an applicable credit spread adjustment of 0.10%.
As of December 31, 2023, the interest rate on the Corporate Facility was 7.84%. The average interest rate for borrowings under the Corporate Facility was 7.54% and 4.11% for the years ended December 31, 2023 and 2022, respectively. As of December 31, 2023, MSC Income Fund was in compliance with all financial covenants of the Corporate Facility.
SPV Facility
MSIF Funding LLC (“MSIF Funding”), a wholly-owned Structured Subsidiary that primarily holds originated loan investments, is party to a senior secured revolving credit facility dated February 3, 2021 (as amended, the “SPV Facility” and, together with the Corporate Facility, the “Credit Facilities”) with JPMorgan Chase Bank, National Association (“JPM”), as administrative agent, and U.S. Bank, N.A., as collateral agent and collateral administrator, JPM and other financial institutions as lenders and MSIF as portfolio manager. In August 2023, the SPV facility was amended to extend the revolving period expiration date from February 3, 2024 to February 3, 2027 and the maturity date from February 3, 2025 to February 3, 2028. Additionally, total commitments were reduced from $325.0 million to $300.0 million. Advances under the SPV Facility bear interest at a per annum rate equal to the three month SOFR in effect, plus the applicable margin of 3.00%. MSIF Funding also pays a commitment fee of 0.75% per annum on the average daily unused amount of the financing commitments until February 2, 2027. As of December 31, 2023, the SPV Facility included total commitments of $300.0 million and an accordion feature, with the right to request an increase of total commitments and borrowing availability up to $450.0 million. The SPV Facility is secured by a collateral loan on the assets of MSIF Funding. In connection with the SPV Facility, MSIF Funding has made customary representations and warranties and is required to comply with various covenants, reporting requirements and other customary requirements for similar credit facilities.
As of December 31, 2023, the interest rate on the SPV Facility was 8.39%. The average interest rate for borrowings under the SPV Facility was 8.09% and 4.71% for the years ended December 31, 2023 and 2022, respectively. As of December 31, 2023, MSIF Funding was in compliance with all financial covenants of the SPV Facility.
Series A Notes
Pursuant to a Master Note Purchase Agreement dated October 21, 2021 (the “Note Purchase Agreement”), MSC Income Fund issued $77.5 million of 4.04% Series A Senior Notes due 2026 (the “Series A Notes”) upon entering into the Note Purchase Agreement and an additional $72.5 million on January 21, 2022. The Series A Notes bear a fixed interest rate of 4.04% per year and will mature on October 30, 2026, unless redeemed, purchased or prepaid prior to such date by the Company in accordance with their terms.
MSC INCOME FUND, INC.
Notes to the Consolidated Financial Statements (Continued)
Interest on the Series A Notes is due semiannually on April 30 and October 30 each year, beginning on April 30, 2022. The Series A Notes may be redeemed in whole or in part at any time or from time to time at MSC Income Fund’s option at par plus accrued interest to the prepayment date and, if applicable, a make-whole premium. In addition, MSC Income Fund is obligated to offer to prepay the Series A Notes at par plus accrued and unpaid interest up to, but excluding, the date of prepayment, if certain change in control events occur. In the event that a Below Investment Grade Event (as defined in the Note Purchase Agreement) occurs, the Series A Notes will bear interest at a fixed rate of 5.04% per year from the date of the occurrence of the Below Investment Grade Event to and until the date on which the Below Investment Grade Event ends. The Series A Notes are general unsecured obligations of MSIF that rank pari passu with all outstanding and future unsecured unsubordinated indebtedness issued by MSIF.
The Note Purchase Agreement also contains customary events of default with customary cure and notice periods, including, without limitation, nonpayment, incorrect representation in any material respect, breach of covenant, cross-default under other indebtedness of MSIF or subsidiary guarantors subject to a cure pass-through, certain judgments and orders and certain events of bankruptcy. As of December 31, 2023, MSC Income Fund was in compliance with all financial covenants of the Note Purchase Agreement.
Main Street Term Loan
On January 27, 2021, the Company entered into a term loan agreement (the “Main Street Term Loan”) with Main Street, which initially provided up to an aggregate principal amount of $40.0 million in borrowings. The Company paid a 1.0% upfront fee to Main Street on the closing date. On July 27, 2021, the Company entered into an amendment to the Main Street Term Loan that allowed the Company to draw an additional $20.0 million, with another $15.0 million available to be drawn in two separate $7.5 million tranches (each a “Delayed Draw Term Loan”) at a later date.
Borrowings under the Main Street Term Loan were expressly subordinated and junior in right of payment to all secured indebtedness of the Company. On October 22, 2021, in connection with the issuance of the Series A Notes (discussed above), the Company fully repaid all borrowings outstanding under the Main Street Term Loan, and the Main Street Term Loan was extinguished. As a result, the Company recorded a loss on the extinguishment of debt in the amount of $0.3 million, which represented the write-off of the unamortized deferred financing fees related to the Main Street Term Loan.
Deutsche Bank Credit Facility
On May 18, 2015, HMS Funding I LLC (“HMS Funding”), a wholly-owned Structured Subsidiary, entered into an amended and restated credit agreement (as amended, the “Deutsche Bank Credit Facility”) among HMS Funding, as borrower, MSC Income Fund, as equity holder and as servicer, Deutsche Bank AG, New York Branch (“Deutsche Bank”), as administrative agent, the financial institutions party thereto as lenders (together with Deutsche Bank, the “HMS Funding Lenders”), and U.S. Bank National Association, as collateral agent and collateral custodian. On February 3, 2021, the total amount outstanding on the facility under the Deutsche Bank Credit Facility was fully repaid. As a result, MSC Income Fund recorded a loss on the extinguishment of debt in the amount of $2.1 million, which represented the write-off of the unamortized deferred financing fees related to the Deutsche Bank Credit Facility.
For the year ended December 31, 2021, the average interest rate for borrowings under the Deutsche Bank Credit Facility, excluding amortization of deferred financing costs was 2.93% per annum.
MSC INCOME FUND, INC.
Notes to the Consolidated Financial Statements (Continued)
A summary of the Company’s contractual payment obligations for the repayment of outstanding indebtedness at December 31, 2023 is as follows:
| | | | | | | | | | | | | | | | | | | | | | | | | | | | | | | | | | | | | | | | | |
| 2024 | | 2025 | | 2026 | | 2027 | | 2028 | | Thereafter | | Total |
| (dollars in thousands) |
SPV Facility (1) | $ | — | | | $ | — | | | $ | — | | | $ | — | | | $ | 203,688 | | | $ | — | | | $ | 203,688 | |
Series A Notes (2) | — | | | — | | | 150,000 | | | — | | | — | | | — | | | 150,000 | |
Corporate Facility (3) | — | | | — | | | 132,000 | | | — | | | — | | | — | | | 132,000 | |
| Total | $ | — | | | $ | — | | | $ | 282,000 | | | $ | — | | | $ | 203,688 | | | $ | — | | | $ | 485,688 | |
_____________________________
(1)At December 31, 2023, MSIF Funding had $96.3 million of undrawn lender commitments under the SPV Facility; however, MSIF Funding’s borrowing ability is limited by leverage and borrowing base restrictions imposed by the SPV Facility and the 1940 Act, as discussed above.
(2)MSC Income Fund issued $77.5 million of Series A Notes upon entering into the Note Purchase Agreement on October 22, 2021 and an additional $72.5 million on January 21, 2022.
(3)At December 31, 2023, MSC Income Fund had $33.0 million of undrawn lender commitments under the Corporate Facility; however, MSC Income Fund’s borrowing ability is limited by leverage and borrowing base restrictions imposed by the Corporate Facility and the 1940 Act, as discussed above.
NOTE F — FINANCIAL HIGHLIGHTS
The following is a schedule of financial highlights of MSC Income Fund for the years ended December 31, 2023, 2022, 2021, 2020 and 2019:
| | | | | | | | | | | | | | | | | | | | | | | | | | | | | |
| Year Ended December 31, |
Per Share Data (7): | 2023 | | 2022 | | 2021 | | 2020 | | 2019 |
| NAV at the beginning of the period | $ | 15.22 | | | $ | 15.36 | | | $ | 14.56 | | | $ | 15.54 | | | $ | 15.92 | |
| Net investment income (1)(6) | 1.44 | | | 1.32 | | | 1.34 | | | 1.18 | | | 1.42 | |
| Net realized loss (1)(2) | (0.85) | | | (0.10) | | | (0.07) | | | (1.32) | | | (0.47) | |
| Net unrealized appreciation (depreciation) (1)(2) | 1.16 | | | (0.04) | | | 0.62 | | | (0.08) | | | 0.08 | |
| Income tax provision (1)(2) | (0.10) | | | (0.04) | | | (0.05) | | | (0.03) | | | (0.02) | |
| Net increase (decrease) in net assets resulting from operations (1) | 1.65 | | | 1.14 | | | 1.84 | | | (0.25) | | | 1.01 | |
| Dividends paid from net investment income | (1.40) | | | (1.29) | | | (1.05) | | | (0.70) | | | (1.35) | |
Distributions paid from capital gains | — | | | — | | | — | | | — | | | (0.05) | |
Distributions paid or accrued (3) | (1.40) | | | (1.29) | | | (1.05) | | | (0.70) | | | (1.40) | |
| Accretive effect of stock repurchases (repurchasing shares below NAV) (4) | 0.06 | | | — | | | — | | | — | | | — | |
| Other (5)(6) | 0.01 | | | 0.01 | | | 0.01 | | | (0.03) | | | 0.01 | |
| NAV at the end of the period | $ | 15.54 | | | $ | 15.22 | | | $ | 15.36 | | | $ | 14.56 | | | $ | 15.54 | |
| Shares outstanding at the end of the period | 40,054,433 | | | 40,053,000 | | | 39,913,303 | | | 39,804,152 | | | 39,231,689 | |
_____________________________
(1)Based on weighted-average number of common shares outstanding for the period.
(2)Net realized gains or losses, net unrealized appreciation or depreciation and income tax provision or benefit can fluctuate significantly from period to period.
(3)Represents stockholder dividends paid or accrued for the period.
(4)Shares repurchased in connection with the modified Dutch auction tender offers. See Note H — Share Repurchases for additional information.
MSC INCOME FUND, INC.
Notes to the Consolidated Financial Statements (Continued)
(5)Includes the impact of the different share amounts as a result of calculating certain per share data based on the weighted-average basic shares outstanding during the period and certain per share data based on the shares outstanding as of a period end or transaction date.
(6)Reclassifications have been made to certain prior year per share data. The 2020 “Other” and 2019 “Net investment income” per share amounts have been adjusted to reflect the income tax provision effect separately rather than as a component of these values.
(7)Per share data and shares outstanding have been adjusted for the periods shown to reflect the Reverse Stock Split on a retrospective basis.
| | | | | | | | | | | | | | | | | | | | | | | | | | | | | |
| Year Ended December 31, |
| 2023 | | 2022 | | 2021 | | 2020 | | 2019 |
| (dollars in thousands) |
| NAV at end of period | $ | 622,307 | | $ | 609,665 | | $ | 613,170 | | $ | 579,624 | | $ | 609,305 |
| Average NAV | $ | 613,525 | | $ | 611,214 | | $ | 593,440 | | $ | 557,382 | | $ | 622,708 |
| Average outstanding debt | $ | 487,271 | | $ | 494,957 | | $ | 321,973 | | $ | 386,084 | | $ | 474,000 |
| | | | | | | | | |
| Ratios to average NAV: | | | | | | | | | |
| Ratio of total expenses, including income tax expense, to average NAV(1)(2)(4) | 12.63 | % | | 8.60 | % | | 6.51 | % | | 7.38 | % | | 9.11 | % |
| Ratio of operating expenses to average NAV(2)(4) | 12.02 | % | | 8.33 | % | | 6.20 | % | | 7.16 | % | | 9.11 | % |
| Ratio of operating expenses, excluding interest expense, to average NAV(2)(4) | 6.07 | % | | 4.33 | % | | 3.76 | % | | 4.07 | % | | 4.86 | % |
| Ratio of operating expenses, excluding interest expense and incentive fees, to average NAV(2)(4) | 4.02 | % | | 3.98 | % | | 3.66 | % | | 4.07 | % | | 4.22 | % |
| Ratio of net investment income to average NAV(4) | 9.40 | % | | 8.65 | % | | 8.99 | % | | 8.40 | % | | 8.84 | % |
| Portfolio turnover ratio | 21.82 | % | | 18.92 | % | | 35.39 | % | | 8.93 | % | | 33.30 | % |
| Total return based on change in NAV(3)(4) | 10.86 | % | | 7.43 | % | | 12.71 | % | | (1.80) | % | | 6.41 | % |
_____________________________
(1)Total expenses are the sum of operating expenses and net income tax provision or benefit. Net income tax provision or benefit includes the accrual of net deferred tax provision or benefit relating to the net unrealized appreciation or depreciation on portfolio investments held in the Taxable Subsidiaries and due to the change in the loss carryforwards, which are non-cash in nature and may vary significantly from period to period. MSC Income Fund is required to include net deferred tax provision or benefit in calculating its total expenses even though these net deferred taxes are not currently payable or receivable.
(2)Unless otherwise noted, operating expenses include interest, management fees, incentive fees and general and administrative expenses.
(3)Total return is calculated based on the change in NAV per share and stockholder distributions declared per share during the reporting period, divided by the NAV per share at the beginning of the period. The total return does not reflect the sales load from the sale of MSC Income Fund’s common stock.
(4)Net of expense waivers of $8.3 million, $4.5 million, $4.3 million, $3.6 million and $3.1 million in 2023, 2022, 2021, 2020 and 2019, respectively. Excluding these expense waivers, the expense and income ratios are as follows:
MSC INCOME FUND, INC.
Notes to the Consolidated Financial Statements (Continued)
| | | | | | | | | | | | | | | | | | | | | | | | | | | | | |
| Year Ended December 31, |
| 2023 | | 2022 | | 2021 | | 2020 | | 2019 |
| Ratio of total expenses, including income tax expense, to average NAV(1)(2) | 13.98 | % | | 9.33 | % | | 7.24 | % | | 8.11 | % | | 9.84 | % |
| Ratio of operating expenses to average NAV(2) | 13.37 | % | | 9.06 | % | | 6.92 | % | | 7.89 | % | | 9.84 | % |
| Ratio of operating expenses, excluding interest expense, to average NAV(2) | 7.43 | % | | 5.07 | % | | 4.49 | % | | 4.80 | % | | 5.58 | % |
| Ratio of operating expenses, excluding interest expense and incentive fees, to average NAV(2) | 5.38 | % | | 4.72 | % | | 4.39 | % | | 4.80 | % | | 4.95 | % |
| Ratio of net investment income to average NAV | 8.05 | % | | 7.90 | % | | 8.26 | % | | 7.67 | % | | 8.11 | % |
| Total return based on change in NAV(3) | 9.50 | % | | 6.69 | % | | 11.98 | % | | (2.20) | % | | 5.85 | % |
_____________________________
See footnotes (1), (2), (3) and (4) immediately prior to this table.
NOTE G — DIVIDENDS, DISTRIBUTIONS AND TAXABLE INCOME
MSC Income Fund currently pays quarterly dividends to its stockholders. Future quarterly dividends, if any, will be determined by its Board of Directors on a quarterly basis. MSC Income Fund paid or accrued dividends to its common stockholders of $56.1 million, or $1.40 per share, during the year ended December 31, 2023, compared to $51.6 million, or $1.29 per share, during the year ended December 31, 2022. For tax purposes, the 2023 dividends, which included the effects of dividends on an accrual basis, totaled $56.1 million, or $1.40 per share, and were comprised of (i) ordinary income totaling $1.192 per share and (ii) qualified dividend income totaling $0.208 per share. As of December 31, 2023, MSC Income Fund estimates that it has generated undistributed taxable income of $14.7 million, or $0.36 per share, that will be carried forward toward distributions to be paid in 2024. Per share amounts have been adjusted to reflect the Reverse Stock Split on a retrospective basis.
MSIF has elected to be treated for U.S. federal income tax purposes as a RIC. MSIF’s taxable income includes the taxable income generated by MSIF and certain of its subsidiaries, including the Structured Subsidiaries, which are treated as disregarded entities for tax purposes. As a RIC, MSIF generally will not pay corporate-level U.S. federal income taxes on any net ordinary taxable income or capital gains that MSIF distributes to its stockholders. MSIF must generally distribute at least 90% of its “investment company taxable income” (which is generally its net ordinary taxable income and realized net short-term capital gains in excess of realized net long-term capital losses) and 90% of its tax-exempt income to maintain its RIC status (pass-through tax treatment for amounts distributed). As part of maintaining RIC status, undistributed taxable income (subject to a 4% non-deductible U.S. federal excise tax) pertaining to a given fiscal year may be distributed up to twelve months subsequent to the end of that fiscal year, provided such dividends are declared on or prior to the later of (i) filing of the U.S. federal income tax return for the applicable fiscal year or (ii) the fifteenth day of the ninth month following the close of the year in which such taxable income was generated.
The determination of the tax attributes for MSC Income Fund’s distributions is made annually, based upon its taxable income for the full year and distributions paid for the full year. Therefore, a determination made on an interim basis may not be representative of the actual tax attributes of distributions for a full year. Ordinary dividend distributions from a RIC do not qualify for the 20% maximum tax rate (plus a 3.8% Medicare surtax, if applicable) on dividend income from domestic corporations and qualified foreign corporations, except to the extent that the RIC received the income in the form of qualifying dividends from domestic corporations and qualified foreign corporations. The tax attributes for distributions will generally include both ordinary income and qualified dividends, but may also include either one or both of capital gains and return of capital.
MSC INCOME FUND, INC.
Notes to the Consolidated Financial Statements (Continued)
The tax character of distributions paid for the years ended December 31, 2023, 2022 and 2021 was as follows:
| | | | | | | | | | | | | | | | | |
| Year Ended December 31, |
| 2023 | | 2022 | | 2021 |
| (dollars in thousands) |
| Ordinary income (1) | $ | 47,756 | | | $ | 61,854 | | | $ | 29,797 | |
| Qualified dividends | 8,301 | | | 1,727 | | | 92 | |
| Distributions on tax basis | $ | 56,057 | | | $ | 63,581 | | | $ | 29,889 | |
Listed below is a reconciliation of “Net increase in net assets resulting from operations” to taxable income and to total distributions declared to common stockholders for the years ended December 31, 2023, 2022 and 2021.
| | | | | | | | | | | | | | | | | |
| Year Ended December 31, |
| 2023 | | 2022 | | 2021 |
| (estimated, dollars in thousands) |
| Net increase in net assets resulting from operations | $ | 66,209 | | | $ | 45,588 | | | $ | 73,636 | |
| Net unrealized (appreciation) depreciation | (46,319) | | | 1,702 | | | (25,095) | |
| Income tax provision | 3,769 | | | 1,643 | | | 1,890 | |
| Pre-tax book (income) loss not consolidated for tax purposes | 4,241 | | | (9,748) | | | (17,640) | |
| Book income and tax income differences, including debt origination, structuring fees, dividends, realized gains and changes in estimates | 22,228 | | | 9,820 | | | 3,171 | |
| Estimated taxable income (1) | 50,128 | | | 49,005 | | | 35,962 | |
| Taxable income earned in prior year and carried forward for distribution in current year | 20,674 | | | 23,276 | | | 29,173 | |
| Taxable income earned prior to period end and carried forward for distribution next period | (28,764) | | | (33,491) | | | (35,250) | |
| Dividend accrued as of period end and paid in the following period | 14,019 | | | 12,817 | | | 11,974 | |
| Taxable income earned to be carried forward | (14,745) | | | (20,674) | | | (23,276) | |
| Total distributions accrued or paid to common stockholders | $ | 56,057 | | | $ | 51,607 | | | $ | 41,859 | |
_____________________________
(1)MSIF’s taxable income for each period is an estimate and will not be finally determined until MSIF files its tax return for each year. Therefore, the final taxable income, and the taxable income earned in each period and carried forward for distribution in the following period, may be different than this estimate.
The Taxable Subsidiaries primarily hold certain equity investments for MSC Income Fund. The Taxable Subsidiaries permit MSC Income Fund to hold equity investments in portfolio companies which are “pass-through” entities for tax purposes and to continue to comply with the “source-of-income” requirements contained in the RIC tax provisions of the Code. The Taxable Subsidiaries are consolidated with MSIF for U.S. GAAP financial reporting purposes, and the portfolio investments held by the Taxable Subsidiaries are included in MSC Income Fund’s consolidated financial statements as portfolio investments and recorded at fair value. The Taxable Subsidiaries are not consolidated with MSIF for income tax purposes and may generate income tax expense, or benefit, and tax assets and liabilities, as a result of their ownership of certain portfolio investments. The taxable income, or loss, of the Taxable Subsidiaries may differ from their book income, or loss, due to temporary book and tax timing differences and permanent differences. The Taxable Subsidiaries are each taxed at corporate income tax rates based on their taxable income. The income tax expense, or benefit, if any, and the related tax assets and liabilities, of the Taxable Subsidiaries are reflected in MSC Income Fund’s consolidated financial statements.
MSC INCOME FUND, INC.
Notes to the Consolidated Financial Statements (Continued)
The income tax provision for MSC Income Fund is generally composed of (i) deferred tax expense (benefit), which is primarily the result of the net activity relating to the portfolio investments held in the Taxable Subsidiaries, including changes in loss carryforwards, changes in net unrealized appreciation or depreciation, changes in valuation allowance and other temporary book tax differences, and (ii) current tax expense, which is primarily the result of current U.S. federal income and state taxes and excise taxes on MSC Income Fund’s estimated undistributed taxable income. The income tax expense, or benefit, and the related tax assets and liabilities generated by the Taxable Subsidiaries, if any, are reflected in MSC Income Fund’s Consolidated Statements of Operations. MSC Income Fund’s provision for income taxes was comprised of the following for the years ended December 31, 2023, 2022 and 2021:
| | | | | | | | | | | | | | | | | | | | | |
| | | Year Ended December 31, |
| | | | | 2023 | | 2022 | | 2021 |
| | | | | (dollars in thousands) |
| Current tax expense: | | | | | | | | | |
| Federal | | | | | $ | 13 | | | $ | 33 | | | $ | — | |
| State | | | | | 340 | | | 495 | | | 495 | |
| Excise | | | | | 519 | | | 753 | | | 1,395 | |
| Total current tax expense | | | | | 872 | | | 1,281 | | | 1,890 | |
| Deferred tax expense (benefit): | | | | | | | | | |
| Federal | | | | | 3,450 | | | 351 | | | — | |
| State | | | | | (553) | | | 11 | | | — | |
| Total deferred tax expense | | | | | 2,897 | | | 362 | | | — | |
| | | | | | | | | |
| Total income tax provision | | | | | $ | 3,769 | | | $ | 1,643 | | | $ | 1,890 | |
MSIF operates in a manner to maintain its RIC status and to eliminate corporate-level U.S. federal income tax (other than the 4% excise tax) by distributing sufficient investment company taxable income and long-term capital gains. As a result, MSIF will have an effective tax rate equal to 0% before the excise tax and income taxes incurred by the Taxable Subsidiaries. As such, a reconciliation of the differences between MSC Income Fund’s reported income tax expense and its tax expense at the federal statutory rate of 21% is not meaningful.
As of December 31, 2023, the cost of investments for U.S. federal income tax purposes was $1,035.0 million, with such investments having an estimated net unrealized appreciation of $57.9 million, composed of gross unrealized appreciation of $154.3 million and gross unrealized depreciation of $96.4 million. As of December 31, 2022, the cost basis of investments for tax purposes was $1,059.9 million, with such investments having an estimated net unrealized appreciation of $8.3 million, composed of gross unrealized appreciation of $122.6 million and gross unrealized depreciation of $114.3 million.
MSC INCOME FUND, INC.
Notes to the Consolidated Financial Statements (Continued)
The following table sets forth the significant components of net deferred tax assets and liabilities as of December 31, 2023 and 2022:
| | | | | | | | | | | |
| Year Ended
December 31, |
| 2023 | | 2022 |
| (dollars in thousands) |
| Deferred tax assets: | | | |
| Net operating loss carryforwards | $ | 671 | | | $ | 398 | |
| Interest expense carryforwards | 3,258 | | | 1,426 | |
| General business and foreign tax credit carryforwards | 329 | | | 156 | |
| Capital loss carryforwards | 6,041 | | | 10,013 | |
| Total deferred tax assets | 10,299 | | | 11,993 | |
| Deferred tax liabilities: | | | |
| Net basis differences in portfolio investments | (1,484) | | | (3,777) | |
| Net unrealized appreciation of portfolio investments | (12,074) | | | (8,578) | |
| Total deferred tax liabilities | (13,558) | | | (12,355) | |
| Total deferred tax liabilities, net | $ | (3,259) | | | $ | (362) | |
The net deferred tax liability at December 31, 2023 was $3.3 million. The net deferred tax liability at December 31, 2022 was $0.4 million. Management believes that the realization of the deferred tax assets is more likely than not based on expectations as to future taxable income and scheduled reversals of temporary differences. Accordingly, MSC Income Fund did not record a valuation allowance related to its deferred tax assets as of December 31, 2023 and 2022.
At December 31, 2023, for U.S. federal income tax purposes, the Taxable Subsidiaries had net operating loss carryforwards from prior years which, if unused, will expire in 2037. Any net operating losses generated in 2018 and future periods are not subject to expiration and will carry forward indefinitely until utilized. The net capital loss carryforwards of the Taxable Subsidiaries will expire in various taxable years 2025 through 2027. Additionally, the Taxable Subsidiaries have interest expense limitation carryforwards, which have an indefinite carryforward period. In addition, as of December 31, 2023, for U.S. federal income tax purposes at the RIC level, MSIF did not have capital loss carryforwards available to offset future capital gains, to the extent available and permitted by U.S. federal income tax law.
NOTE H — SHARE REPURCHASES
Under the terms of its share repurchase program, MSC Income Fund offers to purchase shares at the NAV per share on the repurchase date. The amount of shares of MSC Income Fund’s common stock to be repurchased during any calendar quarter may be equal to the lesser of (i) the number of shares of common stock MSC Income Fund could repurchase with the proceeds it received from the issuance of common stock under MSC Income Fund’s dividend reinvestment plan or (ii) 2.5% of the weighted-average number of shares of common stock outstanding in the prior four calendar quarters. Repurchase offers are currently limited to the number of shares of common stock MSC Income Fund can repurchase with 90% of the cash retained as a result of issuances of common stock under its dividend reinvestment plan.
At the discretion of the Board of Directors, MSC Income Fund may also use cash on hand, cash available from borrowings and cash from the sale of investments as of the end of the applicable period to repurchase shares. MSC Income Fund’s Board of Directors may amend, suspend or terminate the share repurchase program upon 30 days’ notice.
In addition to its share repurchase program, during the fiscal year ended December 31, 2023, MSC Income Fund used proceeds from the sale of their shares during 2023 to complete three modified Dutch auction tender offers, pursuant to which MSC Income Fund offered to purchase up to a specified amount of shares of its common stock at the lowest clearing purchase price elected by participating stockholders within a specified range that allowed MSC Income Fund to purchase the maximum amount offered. All shares purchased in a “Dutch auction” tender offer were purchased at the clearing purchase price. SEC rules permitted MSC Income Fund to increase the number of shares accepted for purchase in any offer by up to 2% of MSC Income Fund’s outstanding shares without amending the offer.
MSC INCOME FUND, INC.
Notes to the Consolidated Financial Statements (Continued)
Since inception of its share repurchase program, MSC Income Fund has funded the repurchase of $153.5 million in shares of common stock, including the shares repurchased by MSC Income Fund under the “Dutch auction” tender offers, as of December 31, 2023. For the years ended December 31, 2023, 2022 and 2021, MSC Income Fund funded $24.4 million, $16.0 million and $10.1 million, respectively, for shares of its common stock tendered for repurchase under the plan. For the year ended December 31, 2023, MSC Income Fund purchased 633,834 shares (as adjusted to reflect the Reverse Stock Split on a retrospective basis) of its common stock for $7.8 million through its modified Dutch auction tender offers.
Repurchases of MSC Income Fund’s common stock pursuant to its share repurchase program and modified Dutch auction tender offers for the years ended December 31, 2023, 2022 and 2021 are as follows:
| | | | | | | | | | | | | | | | | | | | | | | |
| Period | Total number of shares purchased (as adjusted to reflect the Reverse Stock Split) | | Average price paid per share (as adjusted to reflect the Reverse Stock Split) | | Total number of shares purchased as part of publicly announced plans or programs (as adjusted to reflect the Reverse Stock Split) | | Approximate dollar value of shares that may yet be purchased under the plans or programs |
| | | | | | | |
| | | | | | | |
| | | | | | | |
| | | | | | | |
| | | | | | | |
| April 1 through June 30, 2021 | 191,756 | | $ | 14.92 | | | 191,756 | | N/A |
| July 1 through September 30, 2021 | 219,146 | | 15.14 | | | 219,146 | | N/A |
| October 1 through December 31, 2021 | 255,657 | | 15.20 | | | 255,657 | | N/A |
| January 1 through March 31, 2022 | 244,516 | | 15.50 | | | 244,516 | | N/A |
| April 1 through June 30, 2022 | 268,032 | | 15.54 | | | 268,032 | | N/A |
| July 1 through September 30, 2022 | 263,754 | | 15.28 | | | 263,754 | | N/A |
| October 1 through December 31, 2022 | 261,155 | | 15.32 | | | 261,155 | | N/A |
| January 1 through March 31, 2023 | 259,744 | | 15.34 | | | 259,744 | | N/A |
| April 1 through June 30, 2023 (1) | 482,784 | | 13.17 | | | 482,784 | | N/A |
| July 1 through September 30, 2023 (2) | 489,290 | | 14.24 | | | 489,290 | | N/A |
| October 1 through December 31, 2023 (3) | 479,464 | | 14.23 | | | 479,464 | | N/A |
| Total | 3,415,298 | | | | 3,415,298 | | |
_____________________________
(1)Includes 203,452 shares (as adjusted to reflect the Reverse Stock Split on a retrospective basis) repurchased under the Dutch auction tender offer pursuant to the to the tender offer statement and Offer to Purchase filed with the SEC on May 15, 2023 at a price of $11.00 per share (as adjusted to reflect the Reverse Stock Split on a retrospective basis) for an aggregate cost of $2.2 million.
(2)Includes 216,460 shares (as adjusted to reflect the Reverse Stock Split on a retrospective basis) repurchased under the Dutch auction tender offer pursuant to the to the tender offer statement and Offer to Purchase filed with the SEC on June 14, 2023 at a price of $13.00 per share (as adjusted to reflect the Reverse Stock Split on a retrospective basis) for an aggregate cost of $2.8 million.
(3)Includes 213,922 shares (as adjusted to reflect the Reverse Stock Split on a retrospective basis) repurchased under the Dutch auction tender offer pursuant to the to the tender offer statement and Offer to Purchase filed with the SEC on November 15, 2023 at a price of $13.00 per share (as adjusted to reflect the Reverse Stock Split on a retrospective basis) for an aggregate cost of $2.8 million.
MSC INCOME FUND, INC.
Notes to the Consolidated Financial Statements (Continued)
NOTE I — DIVIDEND REINVESTMENT PLAN
MSC Income Fund’s dividend reinvestment plan (the “DRIP”) provides for the reinvestment of dividends on behalf of stockholders. As a result, if MSC Income Fund declares a cash dividend, stockholders who have “opted in” to the DRIP will have their cash dividend automatically reinvested into additional shares of MSC Income Fund common stock. The number of shares of common stock to be issued to a stockholder under the DRIP shall be determined by dividing the total dollar amount of the distribution payable to such stockholder by a price per share of common stock determined by MSC Income Fund’s Board of Directors or a committee thereof, in its sole discretion, that is (i) not less than the NAV per share of common stock determined in good faith by the Board of Directors or a committee thereof, in its sole discretion, within 48 hours prior to the payment of the distribution and (ii) not more than 2.5% greater than the NAV per share as of such date.
Summarized DRIP information for the years ended December 31, 2023, 2022 and 2021 is as follows (shares have been adjusted to reflect the Reverse Stock Split on a retrospective basis):
| | | | | | | | | | | | | | | | | |
| Year Ended December 31, |
| 2023 | | 2022 | | 2021 |
| (dollars in thousands) |
| DRIP participation | $ | 18,417 | | | $ | 17,750 | | | $ | 11,160 | |
| Shares issued for DRIP | 1,172,623 | | | 1,129,806 | | | 730,888 | |
NOTE J — COMMITMENTS AND CONTINGENCIES
At December 31, 2023, MSC Income Fund had the following outstanding commitments (in thousands):
| | | | | | | | |
| Investments with equity capital commitments that have not yet funded: | | Amount |
| | |
| Brightwood Capital Fund III, LP | | $ | 216 | |
| Freeport First Lien Loan Fund III LP | | 8,340 | |
| HPEP 3, L.P. | | 1,308 | |
| | |
| Total Equity Commitments | | $ | 9,864 |
| | |
| Investments with commitments to fund revolving loans that have not been fully drawn or term loans with additional commitments not yet funded: | | |
| | |
| CQ fluency, LLC | | $ | 4,500 | |
| Mako Steel, LP | | 4,057 | |
| Power System Solutions | | 3,989 | |
| Insight Borrower Corporation | | 3,888 | |
| AB Centers Acquisition Corporation | | 2,810 | |
| Garyline, LLC | | 2,626 | |
| SI East, LLC | | 2,125 | |
| Mini Melts of America, LLC | | 1,988 | |
| Bluestem Brands, Inc. | | 1,840 | |
| American Health Staffing Group, Inc. | | 1,667 | |
| IG Parent Corporation | | 1,667 | |
| ArborWorks, LLC | | 1,481 | |
| Infolinks Media Buyco, LLC | | 1,260 | |
| Burning Glass Intermediate Holding Company, Inc. | | 1,239 | |
| Bettercloud, Inc. | | 1,216 | |
| Richardson Sales Solutions | | 1,061 | |
MSC INCOME FUND, INC.
Notes to the Consolidated Financial Statements (Continued)
| | | | | | | | |
| HEADLANDS OP-CO LLC | | 1,000 | |
| IG Investor, LLC | | 1,000 | |
| NexRev LLC | | 1,000 | |
| SPAU Holdings, LLC | | 1,000 | |
| Roof Opco, LLC | | 972 | |
| Bond Brand Loyalty ULC | | 900 | |
| Classic H&G Holdco, LLC | | 860 | |
| Engineering Research & Consulting, LLC | | 828 | |
| VVS Holdco, LLC | | 800 | |
| Cody Pools, Inc. | | 786 | |
| Purge Rite, LLC | | 781 | |
| Acumera, Inc. | | 768 | |
| NinjaTrader, LLC | | 750 | |
| Imaging Business Machines, L.L.C. | | 692 | |
| Centre Technologies Holdings, LLC | | 600 | |
| Paragon Healthcare, Inc. | | 571 | |
| Invincible Boat Company, LLC. | | 561 | |
| AVEX Aviation Holdings, LLC | | 512 | |
| Evergreen North America Acquisitions, LLC | | 501 | |
| Wall Street Prep, Inc. | | 500 | |
| Watterson Brands, LLC | | 484 | |
| GRT Rubber Technologies LLC | | 468 | |
| JTI Electrical & Mechanical, LLC | | 440 | |
| RA Outdoors LLC | | 438 | |
| Microbe Formulas, LLC | | 434 | |
| PTL US Bidco, Inc | | 427 | |
| CaseWorthy, Inc. | | 400 | |
| Trantech Radiator Topco, LLC | | 400 | |
| Chamberlin Holding LLC | | 400 | |
| Johnson Downie Opco, LLC | | 400 | |
| Channel Partners Intermediateco, LLC | | 381 | |
| ITA Holdings Group, LLC | | 366 | |
| Escalent, Inc. | | 349 | |
| South Coast Terminals Holdings, LLC | | 343 | |
| Gamber-Johnson Holdings, LLC | | 300 | |
| Pinnacle TopCo, LLC | | 285 | |
| Batjer TopCo, LLC | | 230 | |
| Metalforming Holdings, LLC | | 205 | |
| Career Team Holdings, LLC | | 200 | |
| ATS Operating, LLC | | 200 | |
| Mystic Logistics Holdings, LLC | | 200 | |
| Orttech Holdings, LLC | | 200 | |
| Analytical Systems Keco Holdings, LLC | | 145 | |
| Elgin AcquireCo, LLC | | 123 | |
| Clad-Rex Steel, LLC | | 100 | |
| Gulf Publishing Holdings, LLC | | 100 | |
| AAC Holdings, Inc. | | 71 | |
MSC INCOME FUND, INC.
Notes to the Consolidated Financial Statements (Continued)
| | | | | | | | |
| Inspire Aesthetics Management, LLC | | 43 | |
| Adams Publishing Group, LLC | | 5 | |
| Interface Security Systems, L.L.C | | 1 | |
| | |
| Total Loan Commitments | | $ | 60,934 | |
| | |
| Total Commitments | | $ | 70,798 | |
MSC Income Fund will fund its unfunded commitments from the same sources it uses to fund its investment commitments that are funded at the time they are made (which are typically through existing cash and cash equivalents and borrowings under the Credit Facilities). MSC Income Fund follows a process to manage its liquidity and ensure that it has available capital to fund its unfunded commitments as necessary. MSC Income Fund had no unrealized appreciation or depreciation on the outstanding unfunded commitments as of December 31, 2023.
MSC Income Fund may, from time to time, be involved in litigation arising out of its operations in the normal course of business or otherwise. Furthermore, third parties may try to impose liability on MSC Income Fund in connection with the activities of its portfolio companies. While the outcome of any current legal proceedings cannot at this time be predicted with certainty, MSC Income Fund does not expect any current matters will materially affect its financial condition or results of operations; however, there can be no assurance whether any pending legal proceedings will have a material adverse effect on MSC Income Fund’s financial condition or results of operations in any future reporting period.
NOTE K — RELATED PARTY TRANSACTIONS
1.Advisory Agreements and Conditional Expense Reimbursement Waivers
On October 30, 2020, MSC Income Fund entered into the Investment Advisory Agreement with the Adviser, which states that the Adviser will oversee the management of MSC Income Fund’s activities and is responsible for making investment decisions with respect to, and providing day‑to‑day management and administration of, MSC Income Fund’s Investment Portfolio. The Investment Advisory Agreement was most recently re-approved by the Board of Directors, including a majority of members who are not “interested” persons (as defined by the 1940 Act) of MSC Income Fund or the Adviser, on August 10, 2023.
Pursuant to the Investment Advisory Agreement, MSC Income Fund pays the Adviser a base management fee and incentive fees as compensation for the services described above. The base management fee is calculated at an annual rate of 1.75% of MSC Income Fund’s average gross assets. The term “gross assets” means total assets of MSC Income Fund as disclosed on MSC Income Fund’s Consolidated Balance Sheets. “Average gross assets” are calculated based on MSC Income Fund’s gross assets at the end of the two most recently completed calendar quarters. The base management fee is payable quarterly in arrears. The base management fee is expensed as incurred.
The incentive fee under the Investment Advisory Agreement consists of two parts. The first part, referred to as the subordinated incentive fee on income, is calculated and payable quarterly in arrears based on Pre-Incentive Fee Net Investment Income (as defined below) for the immediately preceding quarter. The subordinated incentive fee on income is equal to 20.0% of MSC Income Fund’s Pre-Incentive Fee Net Investment Income for the immediately preceding quarter, expressed as a quarterly rate of return on adjusted capital at the beginning of the most recently completed calendar quarter, exceeding 1.875% (or 7.5% annualized), subject to a “catch up” feature (as described below).
MSC INCOME FUND, INC.
Notes to the Consolidated Financial Statements (Continued)
For this purpose, Pre-Incentive Fee Net Investment Income means interest income, dividend income and any other income (including any other fees such as commitment, origination, structuring, diligence and consulting fees or other fees that MSC Income Fund receives from portfolio companies) accrued during the calendar quarter, minus MSC Income Fund’s operating expenses for the quarter (including the management fee, expenses payable under any proposed administration agreement and any interest expense and dividends paid on any issued and outstanding preferred stock, but excluding taxes and the incentive fee). Pre-Incentive Fee Net Investment Income includes, in the case of investments with a deferred interest feature (such as original issue discount debt instruments and PIK interest and zero coupon securities), accrued income that MSC Income Fund has not yet received in cash. Pre-Incentive Fee Net Investment Income does not include any realized capital gains, realized capital losses or unrealized capital appreciation or depreciation. For purposes of this fee, adjusted capital means cumulative gross proceeds generated from sales of MSC Income Fund’s common stock (including proceeds from MSC Income Fund’s DRIP) reduced for non-liquidating distributions, other than distributions of profits, paid to MSC Income Fund’s stockholders and amounts paid for share repurchases pursuant to MSC Income Fund’s share repurchase program. The subordinated incentive fee on income is expensed in the quarter in which it is incurred.
The calculation of the subordinated incentive fee on income for each quarter is as follows:
•No subordinated incentive fee on income shall be payable to the Adviser in any calendar quarter in which MSC Income Fund’s Pre-Incentive Fee Net Investment Income does not exceed the hurdle rate of 1.875% (or 7.5% annualized) on adjusted capital;
•100% of MSC Income Fund’s Pre-Incentive Fee Net Investment Income, if any, that exceeds the hurdle rate but is less than or equal to 2.34375% in any calendar quarter (9.375% annualized) shall be payable to the Adviser. This portion of the subordinated incentive fee on income is referred to as the “catch up” and is intended to provide the Adviser with an incentive fee of 20.0% on all of MSC Income Fund’s Pre-Incentive Fee Net Investment Income as if the hurdle rate did not apply when the Pre-Incentive Fee Net Investment Income exceeds 2.34375% (9.375% annualized) in any calendar quarter; and
•For any quarter in which MSC Income Fund’s Pre-Incentive Fee Net Investment Income exceeds 2.34375% (9.375% annualized), the subordinated incentive fee on income shall equal 20.0% of the amount of MSC Income Fund’s Pre-Incentive Fee Net Investment Income, as the hurdle rate and catch-up will have been achieved.
The second part of the incentive fee, referred to as the incentive fee on capital gains, is an incentive fee on realized capital gains earned from the portfolio of MSC Income Fund and is determined and payable in arrears as of the end of each calendar year (or upon termination of the Investment Advisory Agreement). This fee equals 20.0% of MSC Income Fund’s incentive fee capital gains, which equals MSC Income Fund’s realized capital gains on a cumulative basis from inception, calculated as of the end of each calendar year, computed net of all realized capital losses and unrealized capital depreciation on a cumulative basis, less the aggregate amount of any previously paid capital gain incentive fees. At the end of each reporting period, MSC Income Fund estimates the incentive fee on capital gains and accrues the fee based on a hypothetical liquidation of its portfolio. Therefore, the accrual includes both net realized gains and net unrealized gains (the net unrealized difference between the fair value and the par value of its portfolio), if any. The incentive fee accrued pertaining to the unrealized gain is neither earned nor payable to the Adviser until such time it is realized.
For the years ended December 31, 2023, 2022 and 2021, MSC Income Fund incurred base management fees of $19.8 million, $19.8 million and $17.3 million, respectively. For the years ended December 31, 2023, 2022 and 2021, MSC Income Fund incurred subordinated incentive fees on income of $12.6 million, $2.1 million and $0.6 million, respectively. For the years ended December 31, 2023, 2022 and 2021, MSC Income Fund did not incur any capital gains incentive fees.
Pursuant to the Investment Advisory Agreement, MSC Income Fund is required to pay or reimburse the Adviser for administrative services expenses, which include all costs and expenses related to MSC Income Fund’s day-to-day administration and management not related to advisory services, whether such administrative services were performed by a third-party service provider or the Adviser or its affiliates (to the extent performed by the Adviser or its affiliates, the “Internal Administrative Services”). Internal Administrative Services include, but are not limited to, the cost of an Adviser’s personnel performing accounting and compliance functions and other administrative services on behalf of MSC Income Fund.
MSC INCOME FUND, INC.
Notes to the Consolidated Financial Statements (Continued)
The Adviser waived reimbursement of all Internal Administrative Services expenses from October 30, 2020 through December 31, 2021. On January 1, 2022, the Adviser assumed responsibility of certain administrative services that were previously provided for MSC Income Fund by a third-party sub-administrator. After December 31, 2021, the Adviser continued to waive reimbursement of all Internal Administrative Services expenses, except for the cost of the services previously provided by the sub-administrator. For the years ended December 31, 2023, 2022 and 2021, MSC Income Fund incurred Internal Administrative Services Expenses of $8.9 million, $5.1 million and $4.3 million, respectively. For the years ended December 31, 2023, 2022 and 2021, the Adviser waived the reimbursements of Internal Administrative Services expenses of $8.3 million, $4.5 million and $4.3 million, respectively. Waived Internal Administrative Services expenses are permanently waived and are not subject to future reimbursement.
2. Offering Costs
In accordance with MSC Income Fund’s previous investment advisory agreement with the previous investment adviser (“HMS Adviser”), MSC Income Fund reimbursed HMS Adviser for any offering costs that were paid on MSC Income Fund’s behalf, which consisted of, among other costs, actual legal, accounting, bona fide out-of-pocket itemized and detailed due diligence costs, printing, filing fees, transfer agent costs, postage, escrow fees, advertising and sales literature and other costs incurred in connection with the offering of MSC Income Fund’s common stock, including through MSC Income Fund’s DRIP. HMS Adviser was responsible for the payment of offering costs to the extent they exceeded 1.5% of the aggregate gross stock offering proceeds. Pursuant to the transaction whereby the Adviser became the investment adviser to MSC Income Fund, HMS Adviser agreed to permanently waive reimbursement of organizational and offering expenses except for $0.6 million which remained payable to HMS Adviser and would be reimbursed as part of future issuances of common stock by MSC Income Fund. For the years ended December 31, 2023 and 2022, MSC Income Fund reimbursed HMS Adviser $0.1 million and $0.3 million, respectively, in connection with stock issuances. As of June 30, 2023, MSC Income Fund’s reimbursement obligation to HMS Adviser for organizational and offering expenses was fully repaid.
3. Indemnification
The Investment Advisory Agreement provides that the Adviser and its officers, directors, controlling persons and any other person or entity affiliated with it acting as MSC Income Fund’s agent are entitled to indemnification (including reasonable attorneys’ fees and amounts reasonably paid in settlement) for any liability or loss suffered by such indemnitee, and such indemnitee will be held harmless for any loss or liability suffered by MSC Income Fund, if (i) the indemnitee has determined, in good faith, that the course of conduct which caused the loss or liability was in MSC Income Fund’s best interests, (ii) the indemnitee was acting on behalf of or performing services for MSC Income Fund, (iii) the liability or loss suffered was not the result of negligence, willful malfeasance, bad faith or misconduct by the indemnitee or an affiliate thereof acting as MSC Income Fund’s agent and (iv) the indemnification or agreement to hold the indemnitee harmless is only recoverable out of MSC Income Fund’s net assets and not from MSC Income Fund’s stockholders.
4. Co-Investment
In the ordinary course of business, MSC Income Fund enters into transactions with other parties that may be considered related party transactions. MSC Income Fund has implemented certain policies and procedures, both written and unwritten, to ensure that it does not engage in any prohibited transactions with any persons affiliated with MSC Income Fund. If such affiliations are found to exist, MSC Income Fund seeks the Board of Directors and/or appropriate Board of Directors committee review and approval for such transactions and otherwise comply with, or seek, orders for exemptive relief from the SEC, as appropriate.
MSC INCOME FUND, INC.
Notes to the Consolidated Financial Statements (Continued)
MSC Income Fund has received an exemptive order from the SEC permitting co-investments among MSC Income Fund, Main Street and other funds and clients advised by the Adviser in certain negotiated transactions where co-investing would otherwise be prohibited under the 1940 Act. MSC Income Fund has made co-investments, and in the future intends to continue to make co-investments with Main Street and other funds and clients advised by the Adviser, in accordance with the conditions of the order. The order requires, among other things, that the Adviser and Main Street consider whether each such investment opportunity is appropriate for MSC Income Fund, Main Street and the other funds and clients advised by the Adviser, as applicable, and if it is appropriate, to propose an allocation of the investment opportunity between such parties. Because the Adviser is wholly-owned by Main Street and is not managing MSC Income Fund’s investment activities as its sole activity, this may provide the Adviser an incentive to allocate opportunities to other participating funds and clients instead of MSC Income Fund. However, the Adviser has policies and procedures in place to manage this conflict, including oversight by the independent members of the Board of Directors. Additional information regarding the operation of the co-investment program is set forth in the order granting exemptive relief, which may be reviewed on the SEC’s website at www.sec.gov. In addition to the co-investment program described above, MSC Income Fund also co-invests in syndicated deals and other transactions where price is the only negotiated point by MSC Income Fund and its affiliates.
5. Other Related Party Transactions
On January 27, 2021, MSC Income Fund entered into the Main Street Term Loan, which initially provided for an aggregate principal amount of $40.0 million in borrowings. MSC Income Fund paid a 1.0% upfront fee to Main Street on the closing date.
On July 27, 2021, MSC Income Fund entered into an amendment to the Main Street Term Loan that allowed MSC Income Fund to initially draw an additional $20.0 million, with another $15.0 million available to be drawn in two separate $7.5 million tranches at a later date. Following the amendment, as of September 30, 2021, the aggregate principal amount outstanding under the Main Street Term Loan was $60.0 million bearing interest at a fixed rate of 5.00% per annum and maturing on January 27, 2026.
Borrowings under the Main Street Term Loan were expressly subordinated and junior in right of payment to all secured indebtedness of MSC Income Fund. The Main Street Term Loan was unanimously approved by the Board of Directors, including each director who is not an “interested person,” as such term is defined in Section 2(a)(19) of the 1940 Act, of MSC Income Fund or the Adviser. On October 22, 2021, MSC Income Fund fully repaid all borrowings outstanding under the Main Street Term Loan and the Main Street Term Loan was extinguished.
On May 2, 2022, the Company sold 47,349 shares (as adjusted to reflect the Reverse Stock Split on a retrospective basis) of its common stock to Main Street at $15.84 per share (as adjusted to reflect the Reverse Stock Split on a retrospective basis), the price at which the Company issued new shares in connection with reinvestments of the May 2, 2022 dividend pursuant to the DRIP, for total proceeds to the Company of $750,000. The issuance and sale were made pursuant to the exemption from registration under Section 4(a)(2) of the Securities Act of 1933, as amended (the “Securities Act”), and were unanimously approved by the Board of Directors, including each director who is not an “interested person,” as such term is defined in Section 2(a)(19) of the 1940 Act, of the Company or the Adviser.
On May 1, 2023, the Company sold 127,877 shares (as adjusted to reflect the Reverse Stock Split on a retrospective basis) of its common stock to Main Street at $15.64 per share (as adjusted to reflect the Reverse Stock Split on a retrospective basis), the price at which the Company issued new shares in connection with reinvestments of the May 1, 2023 dividend pursuant to the DRIP, for total proceeds to the Company of $2.0 million. The issuance and sale were made pursuant to the exemption from registration under Section 4(a)(2) of the Securities Act and were unanimously approved by the Board of Directors, including each director who is not an “interested person,” as such term is defined in Section 2(a)(19) of the 1940 Act, of the Company or the Adviser.
MSC INCOME FUND, INC.
Notes to the Consolidated Financial Statements (Continued)
On August 1, 2023, the Company sold 174,271 shares (as adjusted to reflect the Reverse Stock Split on a retrospective basis) of its common stock to Main Street at $15.78 per share (as adjusted to reflect the Reverse Stock Split on a retrospective basis), the price at which the Company issued new shares in connection with reinvestments of the August 1, 2023 dividend pursuant to the DRIP, for total proceeds to the Company of $2.8 million. The issuance and sale were made pursuant to the exemption from registration under Section 4(a)(2) of the Securities Act and were unanimously approved by the Board of Directors, including each director who is not an “interested person,” as such term is defined in Section 2(a)(19) of the 1940 Act, of the Company or the Adviser.
On November 1, 2023, the Company sold 237,944 shares (as adjusted to reflect the Reverse Stock Split on a retrospective basis) of its common stock to Main Street at $15.76 per share (as adjusted to reflect the Reverse Stock Split on a retrospective basis), the price at which the Company issued new shares in connection with reinvestments of the November 1, 2023 dividend pursuant to the DRIP, for total proceeds to the Company of $3,750,000. The issuance and sale were made pursuant to the exemption from registration under Section 4(a)(2) of the Securities Act and were unanimously approved by the Board of Directors, including each director who is not an “interested person,” as such term is defined in Section 2(a)(19) of the 1940 Act, of the Company or the Adviser.
In September 2023, pursuant to the August Dutch auction tender offer, Main Street purchased 57,693 shares (as adjusted to reflect the Reverse Stock Split on a retrospective basis) of MSC Income Fund common stock from MSC Income Fund stockholders at the August Clearing Price, or $13.00 per share (as adjusted to reflect the Reverse Stock Split on a retrospective basis), for an aggregate cost of $0.8 million. See Note H – Share Repurchases for more information. The August Dutch auction tender offer, including Main Street’s participation, were unanimously approved by the Board of Directors, including each director who is not an “interested person,” as such term is defined in Section 2(a)(19) of the 1940 Act, of the Company or the Adviser.
NOTE L — SUBSEQUENT EVENTS
On January 31, 2024, the Company sold 157,035 shares (as adjusted to reflect the Reverse Stock Split on a retrospective basis) of its common stock to Main Street at $15.92 per share (as adjusted to reflect the Reverse Stock Split on a retrospective basis), the price at which the Company issued new shares in connection with reinvestments of the January 31, 2024 dividend pursuant to the DRIP, for total proceeds to the Company of $2.5 million. The issuance and sale were made pursuant to the exemption from registration under Section 4(a)(2) of the Securities Act and were unanimously approved by the Board of Directors, including each director who is not an “interested person,” as such term is defined in Section 2(a)(19) of the 1940 Act, of the Company or the Adviser.
On January 31, 2024, MSC Income Fund repurchased 259,087 shares (as adjusted to reflect the Reverse Stock Split on a retrospective basis) of its common stock validly tendered and not withdrawn on the terms set forth in the tender offer statement on Schedule TO and Offer to Purchase filed with the SEC on December 21, 2023. The shares were repurchased at a price of $15.62 per share (as adjusted to reflect the Reverse Stock Split on a retrospective basis), which was MSC Income Fund’s NAV per share as of January 31, 2024, for an aggregate purchase price of $4.0 million (an amount equal to 90% of the proceeds MSC Income Fund received from the issuance of shares under MSC Income Fund’s DRIP from the January 31, 2024 dividend payment).
On February 5, 2024, MSC Income Fund commenced a modified “Dutch Auction” tender offer (the “February Dutch Auction Tender Offer”) pursuant to the Offer to Purchase, dated February 5, 2024, which expired on March 4, 2024. Pursuant to the February Dutch Auction Tender Offer, MSC Income Fund repurchased 178,572 shares (as adjusted to reflect the Reverse Stock Split on a retrospective basis) on March 8, 2024, at a price of $14.00 per share (as adjusted to reflect the Reverse Stock Split on a retrospective basis) for an aggregate cost of $2.5 million, excluding fees and expenses related to the February Dutch Auction Tender Offer.
On March 7, 2024, the Board of Directors declared a quarterly cash dividend of $0.37 per share (as adjusted to reflect the Reverse Stock Split on a retrospective basis) payable May 1, 2024 to stockholders of record as of March 29, 2024. Additionally, the Board of Directors approved a repurchase offer pursuant to the Company’s share repurchase program in an amount equal to 90% of the proceeds resulting from shares issued in lieu of cash distributions from the May 1, 2024 dividend payment.
MSC INCOME FUND, INC.
Consolidated Schedule of Investments In and Advances to Affiliates
December 31, 2023
(dollars in thousands)
| | | | | | | | | | | | | | | | | | | | | | | | | | | | | | | | | | | | | | | | | | | | | | | | | | | | | | | | | | | | | | | | | |
| Company | Total Rate | Base Rate | Spread | PIK Rate | Type of Investment(1)(10)(11) | | Geography | | Amount of
Realized
Gain/(Loss) | | Amount of
Unrealized
Gain/(Loss) | | Amount of
Interest,
Fees or
Dividends
Credited to
Income(2) | | December 31,
2022 Fair Value (13) | | Gross
Additions(3) | | Gross
Reductions(4) | | December 31,
2023 Fair Value (13) |
| Control Investments | | | | | | | | | | | | | | | | | | | | | |
| Copper Trail Fund Investments | | | | | LP Interests (CTMH, LP) | | (9) | | $ | — | | | $ | — | | | $ | 38 | | | $ | 588 | | | $ | — | | | $ | 20 | | | $ | 568 | |
| GRT Rubber Technologies LLC | 11.48% | SF+ | 6.00% | | Secured Debt (12) | | (8) | | — | | | 3 | | | 88 | | | 330 | | | 852 | | | — | | | 1,182 | |
| 13.48% | SF+ | 8.00% | | Secured Debt | | (8) | | — | | | (50) | | | 2,696 | | | 19,943 | | | 51 | | | 50 | | | 19,944 | |
| | | | | Member Units | | (8) | | — | | | — | | | 90 | | | 21,890 | | | — | | | — | | | 21,890 | |
| Harris Preston Fund Investments | | | | | LP Interests (2717 MH, L.P.) | | (8) | | 2,223 | | | (952) | | | 142 | | | 7,552 | | | 2,796 | | | 4,298 | | | 6,050 | |
| Volusion, LLC | 10.00% | | | | Secured Debt | | (8) | | — | | | — | | | 69 | | | — | | | 900 | | | — | | | 900 | |
| 11.50% | | | | Secured Debt | | (8) | | (1,366) | | | 780 | | | 71 | | | 6,392 | | | — | | | 6,392 | | | — | |
| 8.00% | | | | Unsecured Convertible Debt | | (8) | | (175) | | | 175 | | | — | | | — | | | 175 | | | 175 | | | — | |
| | | | | Preferred Member Units | | (8) | | — | | | — | | | 1 | | | — | | | — | | | — | | | — | |
| | | | | Preferred Member Units | | (8) | | — | | | (596) | | | — | | | — | | | 4,906 | | | 1,796 | | | 3,110 | |
| | | | | Preferred Member Units | | (8) | | — | | | — | | | — | | | — | | | — | | | — | | | — | |
| | | | | Common Stock | | (8) | | — | | | (1,104) | | | — | | | — | | | 1,104 | | | 1,104 | | | — | |
| | | | | Warrants | | (8) | | — | | | 1,104 | | | — | | | — | | | — | | | — | | | — | |
Other
Amounts related to
investments transferred to
or from other
1940 Act classification
during the period | | | | | | | | | 1,541 | | | (649) | | | (94) | | | (6,392) | | | 6,392 | | | — | | | — | |
| Total Control Investments | | | | | | | | | $ | 2,223 | | | $ | (1,289) | | | $ | 3,101 | | | $ | 50,303 | | | $ | 17,176 | | | $ | 13,835 | | | $ | 53,644 | |
| Affiliate Investments | | | | | | | | | | | | | | | | | | | | | |
| AFG Capital Group, LLC | | | | | Preferred Member Units | | (8) | | $ | 1,800 | | | $ | (2,050) | | | $ | — | | | $ | 2,350 | | | $ | 1,800 | | | $ | 4,150 | | | $ | — | |
| Analytical Systems Keco Holdings, LLC | 15.38% | SF+ | 10.00% | | Secured Debt (12) | | (8) | | — | | | — | | | 4 | | | (2) | | | 56 | | | — | | | 54 | |
| 15.38% | SF+ | 10.00% | | Secured Debt | | (8) | | — | | | — | | | 188 | | | 1,135 | | | 21 | | | 136 | | | 1,020 | |
| 14.13% | | | | Preferred Member Units | | (8) | | — | | | — | | | — | | | — | | | — | | | — | | | — | |
| | | | | Preferred Member Units | | (8) | | — | | | 330 | | | — | | | 880 | | | 330 | | | — | | | 1,210 | |
| | | | | Warrants | | (8) | | — | | | — | | | — | | | — | | | — | | | — | | | — | |
| ATX Networks Corp. | | L+ | 7.50% | | Secured Debt | | (6) | | — | | | (102) | | | 856 | | | 6,368 | | | 545 | | | 6,913 | | | — | |
| 10.00% | | | | Unsecured Debt | | (6) | | — | | | (276) | | | 1,135 | | | 2,614 | | | 1,135 | | | 3,749 | | | — | |
| | | | | Common Stock | | (6) | | 3,178 | | | (3,290) | | | — | | | 3,290 | | | 3,178 | | | 6,468 | | | — | |
| Barfly Ventures, LLC | | | | | Member Units | | (5) | | — | | | 273 | | | — | | | 1,107 | | | 273 | | | — | | | 1,380 | |
| Batjer TopCo, LLC | 10.00% | | | | Secured Debt (12) | | (8) | | — | | | 1 | | | — | | | (1) | | | 1 | | | — | | | — | |
| 10.00% | | | | Secured Debt (12) | | (8) | | — | | | — | | | 2 | | | — | | | 70 | | | 40 | | | 30 | |
| 10.00% | | | | Secured Debt | | (8) | | — | | | 15 | | | 129 | | | 1,205 | | | 21 | | | 51 | | | 1,175 | |
| | | | | Preferred Stock | | (8) | | — | | | 225 | | | 76 | | | 455 | | | 225 | | | — | | | 680 | |
| Brewer Crane Holdings, LLC | 15.46% | L+ | 10.00% | | Secured Debt | | (9) | | — | | | — | | | 224 | | | 1,491 | | | 8 | | | 125 | | | 1,374 | |
| | | | | Preferred Member Units | | (9) | | — | | | (370) | | | 30 | | | 1,770 | | | — | | | 370 | | | 1,400 | |
| Centre Technologies Holdings, LLC | | SF+ | 9.00% | | Secured Debt (12) | | (8) | | — | | | — | | | 3 | | | — | | | — | | | — | | | — | |
| 14.48% | SF+ | 9.00% | | Secured Debt | | (8) | | — | | | 29 | | | 572 | | | 3,731 | | | 663 | | | — | | | 4,394 | |
| | | | | Preferred Member Units | | (8) | | — | | | 590 | | | 30 | | | 2,170 | | | 590 | | | — | | | 2,760 | |
| Chamberlin Holding LLC | | SF+ | 6.00% | | Secured Debt (12) | | (8) | | — | | | 49 | | | 11 | | | — | | | — | | | — | | | — | |
| 13.49% | SF+ | 8.00% | | Secured Debt | | (8) | | — | | | (4) | | | 553 | | | 4,236 | | | 4 | | | 335 | | | 3,905 | |
MSC INCOME FUND, INC.
Consolidated Schedule of Investments In and Advances to Affiliates (Continued)
December 31, 2023
(dollars in thousands)
| | | | | | | | | | | | | | | | | | | | | | | | | | | | | | | | | | | | | | | | | | | | | | | | | | | | | | | | | | | | | | | | | |
| Company | Total Rate | Base Rate | Spread | PIK Rate | Type of Investment(1)(10)(11) | | Geography | | Amount of
Realized
Gain/(Loss) | | Amount of
Unrealized
Gain/(Loss) | | Amount of
Interest,
Fees or
Dividends
Credited to
Income(2) | | December 31,
2022 Fair Value (13) | | Gross
Additions(3) | | Gross
Reductions(4) | | December 31,
2023 Fair Value (13) |
| | | | | Member Units | | (8) | | — | | | 1,599 | | | 1,045 | | | 5,728 | | | 1,602 | | | — | | | 7,330 | |
| | | | | Member Units | | (8) | | — | | | 37 | | | 23 | | | 678 | | | 38 | | | 1 | | | 715 | |
| Charps, LLC | | | | | Preferred Member Units | | (5) | | — | | | 590 | | | 366 | | | 3,330 | | | 590 | | | — | | | 3,920 | |
| Clad-Rex Steel, LLC | 11.50% | | | | Secured Debt (12) | | (5) | | — | | | — | | | — | | | — | | | — | | | — | | | — | |
| 11.50% | | | | Secured Debt | | (5) | | — | | | (37) | | | 284 | | | 2,620 | | | — | | | 517 | | | 2,103 | |
| 10.00% | | | | Secured Debt | | (5) | | — | | | — | | | 26 | | | 260 | | | — | | | 9 | | | 251 | |
| | | | | Member Units | | (5) | | — | | | (760) | | | 69 | | | 2,060 | | | — | | | 760 | | | 1,300 | |
| | | | | Member Units | | (5) | | — | | | 55 | | | — | | | 152 | | | 130 | | | — | | | 282 | |
| Cody Pools, Inc. | 12.50% | | | | Secured Debt (12) | | (8) | | — | | | 2 | | | 1 | | | — | | | — | | | — | | | — | |
| 12.50% | | | | Secured Debt | | (8) | | — | | | 22 | | | 562 | | | — | | | 7,872 | | | 761 | | | 7,111 | |
| | L+ | 10.50% | | Secured Debt | | (8) | | — | | | (11) | | | 26 | | | 273 | | | 14 | | | 287 | | | — | |
| | L+ | 10.50% | | Secured Debt | | (8) | | — | | | (96) | | | 500 | | | 6,882 | | | — | | | 6,882 | | | — | |
| | | | | Preferred Member Units | | (8) | | — | | | 3,570 | | | 1,219 | | | 14,550 | | | 3,570 | | | — | | | 18,120 | |
| Colonial Electric Company LLC | | | | | Secured Debt | | (6) | | — | | | — | | | 12 | | | — | | | 400 | | | 400 | | | — | |
| 12.00% | | | | Secured Debt | | (6) | | — | | | (41) | | | 471 | | | 5,729 | | | 34 | | | 356 | | | 5,407 | |
| | | | | Preferred Member Units | | (6) | | — | | | 360 | | | — | | | — | | | 600 | | | — | | | 600 | |
| | | | | Preferred Member Units | | (6) | | — | | | (370) | | | — | | | 2,290 | | | — | | | 370 | | | 1,920 | |
| Compass Systems & Sales, LLC | 13.50% | | | | Secured Debt | | (5) | | — | | | — | | | — | | | — | | | — | | | — | | | — | |
| 13.50% | | | | Secured Debt | | (5) | | — | | | — | | | 69 | | | — | | | 4,175 | | | — | | | 4,175 | |
| | | | | Preferred Equity | | (5) | | — | | | — | | | — | | | — | | | 1,863 | | | — | | | 1,863 | |
| Datacom, LLC | 7.50% | | | | Secured Debt | | (8) | | — | | | — | | | 4 | | | 25 | | | 89 | | | 65 | | | 49 | |
| 10.00% | | | | Secured Debt | | (8) | | — | | | (14) | | | 107 | | | 865 | | | 22 | | | 43 | | | 844 | |
| | | | | Preferred Member Units | | (8) | | — | | | (290) | | | — | | | 300 | | | — | | | 290 | | | 10 | |
| Digital Products Holdings LLC | 15.38% | SF+ | 10.00% | | Secured Debt | | (5) | | — | | | (17) | | | 586 | | | 3,878 | | | — | | | 205 | | | 3,673 | |
| | | | | Preferred Member Units | | (5) | | — | | | — | | | 50 | | | 2,459 | | | — | | | — | | | 2,459 | |
| Direct Marketing Solutions, Inc. | 14.00% | | | | Secured Debt | | (9) | | — | | | (2) | | | 13 | | | — | | | 227 | | | 10 | | | 217 | |
| 14.00% | | | | Secured Debt | | (9) | | — | | | (19) | | | 730 | | | 5,352 | | | 19 | | | 369 | | | 5,002 | |
| | | | | Preferred Stock | | (9) | | — | | | (380) | | | 43 | | | 5,558 | | | — | | | 378 | | | 5,180 | |
| Flame King Holdings, LLC | | L+ | 6.50% | | Secured Debt | | (9) | | — | | | (15) | | | 121 | | | 1,900 | | | 15 | | | 1,915 | | | — | |
| | L+ | 9.00% | | Secured Debt | | (9) | | — | | | (123) | | | 478 | | | 5,300 | | | 123 | | | 5,423 | | | — | |
| | | | | Preferred Equity | | (9) | | — | | | 2,570 | | | 814 | | | 4,400 | | | 2,570 | | | — | | | 6,970 | |
| Freeport Financial Funds | | | | | LP Interests (Freeport First Lien Loan Fund III LP) (12) | | (5) | | — | | | — | | | 598 | | | 5,848 | | | — | | | 2,143 | | | 3,705 | |
| Gamber-Johnson Holdings, LLC | | SF+ | 7.50% | | Secured Debt (12) | | (5) | | — | | | — | | | 2 | | | — | | | — | | | — | | | — | |
| 10.50% | SF+ | 7.50% | | Secured Debt | | (5) | | — | | | (88) | | | 1,727 | | | 16,020 | | | 88 | | | 2,588 | | | 13,520 | |
| | | | | Member Units | | (5) | | — | | | 11,460 | | | 1,491 | | | 12,720 | | | 11,460 | | | — | | | 24,180 | |
| GFG Group, LLC | 8.00% | | | | Secured Debt | | (5) | | — | | | (25) | | | 263 | | | 2,836 | | | 25 | | | 525 | | | 2,336 | |
| | | | | Preferred Member Units | | (5) | | — | | | 1,080 | | | 200 | | | 1,790 | | | 1,080 | | | — | | | 2,870 | |
| Gulf Publishing Holdings, LLC | | SF+ | 9.50% | | Secured Debt (12) | | (8) | | — | | | — | | | — | | | — | | | — | | | — | | | — | |
| 12.50% | | | | Secured Debt | | (8) | | — | | | — | | | 73 | | | 571 | | | — | | | — | | | 571 | |
| | | | | Preferred Equity | | (8) | | — | | | (330) | | | — | | | 950 | | | — | | | 330 | | | 620 | |
| | | | | Member Units | | (8) | | — | | | — | | | — | | | — | | | — | | | — | | | — | |
MSC INCOME FUND, INC.
Consolidated Schedule of Investments In and Advances to Affiliates (Continued)
December 31, 2023
(dollars in thousands)
| | | | | | | | | | | | | | | | | | | | | | | | | | | | | | | | | | | | | | | | | | | | | | | | | | | | | | | | | | | | | | | | | |
| Company | Total Rate | Base Rate | Spread | PIK Rate | Type of Investment(1)(10)(11) | | Geography | | Amount of
Realized
Gain/(Loss) | | Amount of
Unrealized
Gain/(Loss) | | Amount of
Interest,
Fees or
Dividends
Credited to
Income(2) | | December 31,
2022 Fair Value (13) | | Gross
Additions(3) | | Gross
Reductions(4) | | December 31,
2023 Fair Value (13) |
| HPEP 3, L.P. | | | | | LP Interests (HPEP 3, L.P.) (12) | | (8) | | — | | | 156 | | | 4 | | | 4,331 | | | 403 | | | 509 | | | 4,225 | |
| IG Investor, LLC | | | | | Secured Debt (12) | | (6) | | — | | | — | | | 5 | | | — | | | 173 | | | 200 | | | (27) | |
| 13.00% | | | | Secured Debt | | (6) | | — | | | — | | | 692 | | | — | | | 9,179 | | | 110 | | | 9,069 | |
| | | | | Common Equity | | (6) | | — | | | — | | | — | | | — | | | 3,774 | | | 174 | | | 3,600 | |
| Independent Pet Partners Intermediate Holdings, LLC | | | | | Common Equity | | (6) | | — | | | (220) | | | — | | | — | | | 6,540 | | | 220 | | | 6,320 | |
| Integral Energy Services | 13.16% | SF+ | 7.50% | | Secured Debt | | (8) | | — | | | (787) | | | 2,773 | | | 18,425 | | | 94 | | | 2,287 | | | 16,232 | |
| 10.00% | | | 10.00% | Preferred Equity | | (8) | | — | | | 85 | | | — | | | — | | | 350 | | | — | | | 350 | |
| | | | | Common Stock | | (8) | | — | | | (1,300) | | | 50 | | | 1,490 | | | — | | | 1,300 | | | 190 | |
| Kickhaefer Manufacturing Company, LLC | 12.00% | | | | Secured Debt | | (5) | | — | | | (18) | | | 668 | | | 5,093 | | | 58 | | | 218 | | | 4,933 | |
| 9.00% | | | | Secured Debt | | (5) | | — | | | — | | | 86 | | | 961 | | | — | | | 10 | | | 951 | |
| | | | | Preferred Equity | | (5) | | — | | | 620 | | | — | | | 1,800 | | | 620 | | | — | | | 2,420 | |
| | | | | Member Units | | (5) | | — | | | (30) | | | 29 | | | 713 | | | — | | | 30 | | | 683 | |
| Market Force Information, LLC | | L+ | 11.00% | | Secured Debt | | (9) | | (6,465) | | | 6,060 | | | — | | | 403 | | | 6,060 | | | 6,463 | | | — | |
| | | | | Member Units | | (9) | | (4,160) | | | 4,160 | | | — | | | — | | | 4,160 | | | 4,160 | | | — | |
| MH Corbin Holding LLC | 13.00% | | | | Secured Debt | | (5) | | — | | | 307 | | | 190 | | | 1,137 | | | 308 | | | 189 | | | 1,256 | |
| | | | | Preferred Member Units | | (5) | | — | | | 80 | | | — | | | — | | | 80 | | | — | | | 80 | |
| | | | | Preferred Member Units | | (5) | | — | | | — | | | — | | | — | | | — | | | — | | | — | |
| Mystic Logistics Holdings, LLC | | | | | Secured Debt (12) | | (6) | | — | | | — | | | 1 | | | — | | | — | | | — | | | — | |
| 10.00% | | | | Secured Debt | | (6) | | — | | | — | | | 146 | | | 1,436 | | | — | | | — | | | 1,436 | |
| | | | | Common Stock | | (6) | | — | | | 890 | | | 1,131 | | | 5,708 | | | 890 | | | — | | | 6,598 | |
| NexRev LLC | 10.00% | | | | Secured Debt (12) | | (8) | | — | | | — | | | — | | | — | | | — | | | — | | | — | |
| 10.00% | | | | Secured Debt | | (8) | | — | | | 708 | | | 289 | | | 2,119 | | | 729 | | | 413 | | | 2,435 | |
| | | | | Preferred Member Units | | (8) | | — | | | 1,310 | | | 166 | | | 280 | | | 1,310 | | | — | | | 1,590 | |
| NuStep, LLC | 11.98% | SF+ | 6.50% | | Secured Debt | | (5) | | — | | | (2) | | | 120 | | | 1,100 | | | 1 | | | 202 | | | 899 | |
| 12.00% | | | | Secured Debt | | (5) | | — | | | — | | | 564 | | | 4,603 | | | 3 | | | — | | | 4,606 | |
| | | | | Preferred Member Units | | (5) | | — | | | 300 | | | — | | | 2,010 | | | 300 | | | — | | | 2,310 | |
| | | | | Preferred Member Units | | (5) | | — | | | — | | | — | | | 1,290 | | | — | | | — | | | 1,290 | |
| Oneliance, LLC | 16.48% | SF+ | 11.00% | | Secured Debt | | (7) | | — | | | (7) | | | 231 | | | 1,380 | | | 6 | | | 47 | | | 1,339 | |
| | | | | Preferred Stock | | (7) | | — | | | — | | | — | | | 264 | | | 18 | | | — | | | 282 | |
| Orttech Holdings, LLC | | SF+ | 11.00% | | Secured Debt (12) | | (5) | | — | | | 2 | | | 1 | | | (2) | | | 2 | | | — | | | — | |
| 16.48% | SF+ | 11.00% | | Secured Debt | | (5) | | — | | | 58 | | | 955 | | | 5,814 | | | 86 | | | 390 | | | 5,510 | |
| | | | | Preferred Stock | | (5) | | — | | | 1,320 | | | 274 | | | 2,940 | | | 1,320 | | | — | | | 4,260 | |
| Pinnacle TopCo, LLC | 8.00% | | | | Secured Debt (12) | | (8) | | — | | | — | | | 1 | | | — | | | 105 | | | — | | | 105 | |
| 13.00% | | | | Secured Debt | | (8) | | — | | | — | | | 34 | | | — | | | 7,472 | | | — | | | 7,472 | |
| | | | | Preferred Equity | | (8) | | — | | | — | | | — | | | — | | | 3,135 | | | — | | | 3,135 | |
| Robbins Bros. Jewelry, Inc. | 12.50% | | | | Secured Debt | | (9) | | — | | | — | | | 4 | | | (8) | | | 2 | | | — | | | (6) | |
| 12.50% | | | | Secured Debt | | (9) | | — | | | (323) | | | 507 | | | 3,902 | | | 18 | | | 499 | | | 3,421 | |
| | | | | Preferred Equity | | (9) | | — | | | (1,650) | | | — | | | 1,650 | | | — | | | 1,650 | | | — | |
| SI East, LLC | 11.25% | | | | Secured Debt (12) | | (7) | | — | | | 6 | | | 28 | | | — | | | 625 | | | 250 | | | 375 | |
| 12.47% | | | | Secured Debt | | (7) | | — | | | 161 | | | 1,278 | | | — | | | 18,179 | | | — | | | 18,179 | |
| 9.50% | | | | Secured Debt | | (7) | | — | | | (134) | | | 1,403 | | | 29,929 | | | — | | | 29,929 | | | — | |
MSC INCOME FUND, INC.
Consolidated Schedule of Investments In and Advances to Affiliates (Continued)
December 31, 2023
(dollars in thousands)
| | | | | | | | | | | | | | | | | | | | | | | | | | | | | | | | | | | | | | | | | | | | | | | | | | | | | | | | | | | | | | | | | |
| Company | Total Rate | Base Rate | Spread | PIK Rate | Type of Investment(1)(10)(11) | | Geography | | Amount of
Realized
Gain/(Loss) | | Amount of
Unrealized
Gain/(Loss) | | Amount of
Interest,
Fees or
Dividends
Credited to
Income(2) | | December 31,
2022 Fair Value (13) | | Gross
Additions(3) | | Gross
Reductions(4) | | December 31,
2023 Fair Value (13) |
| | | | | Preferred Member Units | | (7) | | — | | | 1,737 | | | 399 | | | 4,550 | | | 1,840 | | | — | | | 6,390 | |
| Student Resource Center, LLC | 8.50% | | | 8.50% | Secured Debt | | (6) | | — | | | (1,881) | | | 364 | | | 5,063 | | | 244 | | | 1,764 | | | 3,543 | |
| | | | | Preferred Equity | | (6) | | — | | | — | | | — | | | — | | | — | | | — | | | — | |
| Tedder Industries, LLC | 12.00% | | | | Secured Debt | | (9) | | — | | | (28) | | | 56 | | | 460 | | | — | | | 28 | | | 432 | |
| 12.00% | | | | Secured Debt | | (9) | | — | | | (218) | | | 466 | | | 3,780 | | | 3 | | | 218 | | | 3,565 | |
| | | | | Preferred Member Units | | (9) | | — | | | (1,920) | | | — | | | 1,920 | | | — | | | 1,920 | | | — | |
| | | | | Preferred Member Units | | (9) | | — | | | (141) | | | — | | | — | | | 124 | | | 124 | | | — | |
| | | | | Preferred Member Units | | (9) | | — | | | (165) | | | — | | | — | | | 165 | | | 165 | | | — | |
| Trantech Radiator Topco, LLC | 8.00% | | | | Secured Debt (12) | | (7) | | — | | | (2) | | | 3 | | | — | | | 2 | | | 2 | | | — | |
| 12.00% | | | | Secured Debt | | (7) | | — | | | (14) | | | 255 | | | 1,980 | | | 14 | | | 14 | | | 1,980 | |
| | | | | Common Stock | | (7) | | — | | | 1,230 | | | 29 | | | 1,950 | | | 1,230 | | | — | | | 3,180 | |
| VVS Holdco LLC | | SF+ | 6.00% | | Secured Debt (12) | | (5) | | — | | | — | | | 10 | | | (5) | | | 5 | | | — | | | — | |
| 11.50% | | | | Secured Debt | | (5) | | — | | | — | | | 904 | | | 7,421 | | | 55 | | | 550 | | | 6,926 | |
| | | | | Preferred Equity | | (5) | | — | | | (30) | | | 54 | | | 2,990 | | | 100 | | | 30 | | | 3,060 | |
Other
Amounts related to
investments transferred to
or from other
1940 Act classification
during the period | | | | | | | | | (1,541) | | | 649 | | | (151) | | | — | | | — | | | — | | | — | |
| Total Affiliate investments | | | | | | | | | $ | (7,188) | | | $ | 25,116 | | | $ | 29,805 | | | $ | 277,000 | | | $ | 115,308 | | | $ | 101,029 | | | $ | 291,279 | |
_____________________________(1)The principal amount, the ownership detail for equity investments and if the investment is income producing is included in the Consolidated Schedule of Investments included in Item 8. Consolidated Financial Statements.
(2)Represents the total amount of interest, fees and dividends credited to income for the portion of the period for which an investment was included in Control or Affiliate categories, respectively. For investments transferred between Control and Affiliate categories during the period, any income or investment balances related to the time period it was in the category other than the one shown at period end is included in “Amounts related to investments transferred to or from other 1940 Act classifications during the period.”
(3)Gross additions include increases in the cost basis of investments resulting from new portfolio investments, follow-on investments and accrued PIK interest, and the exchange of one or more existing securities for one or more new securities. Gross additions also include net increases in unrealized appreciation or net decreases in net unrealized depreciation as well as the movement of an existing portfolio company into this category and out of a different category.
(4)Gross reductions include decreases in the cost basis of investments resulting from principal repayments or sales and the exchange of one or more existing securities for one or more new securities. Gross reductions also include net increases in net unrealized depreciation or net decreases in unrealized appreciation as well as the movement of an existing portfolio company out of this category and into a different category.
(5)Portfolio company located in the Midwest region as determined by location of the corporate headquarters. The fair value as of December 31, 2023 for affiliate investments located in this region was $107,201. This represented 17.2% of net assets as of December 31, 2023.
MSC INCOME FUND, INC.
Consolidated Schedule of Investments In and Advances to Affiliates (Continued)
December 31, 2023
(dollars in thousands)
(6)Portfolio company located in the Northeast region as determined by location of the corporate headquarters. The fair value as of December 31, 2023 for affiliate investments located in this region was $38,466. This represented 6.2% of net assets as of December 31, 2023.
(7)Portfolio company located in the Southeast region as determined by location of the corporate headquarters. The fair value as of December 31, 2023 for affiliate investments located in this region was $31,725. This represented 5.1% of net assets as of December 31, 2023.
(8)Portfolio company located in the Southwest region as determined by location of the corporate headquarters. The fair value as of December 31, 2023 for control investments located in this region was $53,076. This represented 8.5% of net assets as of December 31, 2023. The fair value as of December 31, 2023 for affiliate investments located in this region was $86,332. This represented 13.9% of net assets as of December 31, 2023.
(9)Portfolio company located in the West region as determined by location of the corporate headquarters. The fair value as of December 31, 2023 for control investments located in this region was $568. This represented 0.1% of net assets as of December 31, 2023. The fair value as of December 31, 2023 for affiliate investments located in this region was $27,555. This represented 4.4% of net assets as of December 31, 2023.
(10)All of the Company’s portfolio investments are generally subject to restrictions on resale as “restricted securities,” unless otherwise noted.
(11)This schedule should be read in conjunction with the Consolidated Schedule of Investments and Notes to the Consolidated Financial Statements included in Item 8. Consolidated Financial Statements. Supplemental information can be located within the Consolidated Schedule of Investments including end of period interest rate, preferred dividend rate, maturity date, investments not paid currently in cash and investments whose value was determined using significant unobservable inputs.
(12)Investment has an unfunded commitment as of December 31, 2023 (see Note J — Commitments and Contingencies in Item 8. Consolidated Financial Statements). The fair value of the investment includes the impact of the fair value of any unfunded commitments.
(13)Negative fair value is the result of the capitalized discount being greater than the principal amount outstanding on the loan.
MSC INCOME FUND, INC.
Consolidated Schedule of Investments In and Advances to Affiliates
December 31, 2022
(dollars in thousands)
| | | | | | | | | | | | | | | | | | | | | | | | | | | | | | | | | | | | | | | | | | | | | | | | | | | | | | | | | | | | | | | | | |
| Company | Total Rate | Base Rate | Spread | PIK Rate | Type of Investment(1)(10)(11) | | Geography | | Amount of
Realized
Gain/(Loss) | | Amount of
Unrealized
Gain/(Loss) | | Amount of
Interest,
Fees or
Dividends
Credited to
Income(2) | | December 31,
2021 Fair Value | | Gross
Additions(3) | | Gross
Reductions(4) | | December 31,
2022 Fair Value (13) |
| Control Investments | | | | | | | | | | | | | | | | | | | | | |
| GRT Rubber Technologies LLC | 10.12% | L+ | 6.00% | | Secured Debt | | (8) | | $ | — | | | $ | 6 | | | $ | 7 | | | $ | — | | | $ | 330 | | | $ | — | | | $ | 330 | |
| 12.12% | L+ | 8.00% | | Secured Debt | | (8) | | — | | | (32) | | | 1,972 | | | 19,152 | | | 824 | | | 33 | | | 19,943 | |
| | | | | Member Units | | (8) | | — | | | (860) | | | 1,244 | | | 22,750 | | | — | | | 860 | | | 21,890 | |
| Harris Preston Fund Investments | | | | | LP Interests (2717 MH, L.P.) | | (8) | | — | | | 2,389 | | | — | | | 3,971 | | | 3,581 | | | — | | | 7,552 | |
| Copper Trail Fund Investments | | | | | LP Interests (CTMH, LP) | | (9) | | — | | | — | | | — | | | 710 | | | — | | | 122 | | | 588 | |
Other
Amounts related to
investments transferred to
or from other
1940 Act classification
during the period | | | | | | | | | — | | | — | | | — | | | — | | | — | | | — | | | — | |
| Total Control Investments | | | | | | | | | $ | — | | | $ | 1,503 | | | $ | 3,223 | | | $ | 46,583 | | | $ | 4,735 | | | $ | 1,015 | | | $ | 50,303 | |
| Affiliate Investments | | | | | | | | | | | | | | | | | | | | | |
| AFG Capital Group, LLC | 10.00% | | | | Secured Debt | | (8) | | $ | — | | | $ | — | | | $ | 1 | | | $ | 36 | | | $ | — | | | $ | 36 | | | $ | — | |
| | | | | Preferred Member Units | | (8) | | — | | | 420 | | | 50 | | | 1,930 | | | 420 | | | — | | | 2,350 | |
| Analytical Systems Keco Holdings, LLC | | L+ | 10.00% | | Secured Debt | | (8) | | — | | | — | | | 2 | | | (4) | | | 2 | | | — | | | (2) | |
| 14.13% | L+ | 10.00% | | Secured Debt | | (8) | | — | | | — | | | 174 | | | 1,182 | | | 23 | | | 70 | | | 1,135 | |
| 14.13% | | | | Preferred Member Units | | (8) | | — | | | — | | | — | | | — | | | — | | | — | | | — | |
| | | | | Preferred Member Units | | (8) | | — | | | (340) | | | — | | | 1,220 | | | — | | | 340 | | | 880 | |
| | | | | Warrants | | (8) | | — | | | — | | | — | | | — | | | — | | | — | | | — | |
| ATX Networks Corp. | 12.23% | L+ | 7.50% | | Secured Debt | | (6) | | — | | | 135 | | | 756 | | | 7,121 | | | 364 | | | 1,117 | | | 6,368 | |
| 10.00% | | | 10.00% | Unsecured Debt | | (6) | | — | | | 309 | | | 327 | | | 1,977 | | | 637 | | | — | | | 2,614 | |
| | | | | Common Stock | | (6) | | — | | | 3,290 | | | — | | | — | | | 3,290 | | | — | | | 3,290 | |
| Barfly Ventures, LLC | | | | | Member Units | | (5) | | — | | | 463 | | | — | | | 643 | | | 464 | | | — | | | 1,107 | |
| Batjer TopCo, LLC | | | | | Secured Debt | | (8) | | — | | | — | | | — | | | — | | | 50 | | | 51 | | | (1) | |
| 11.00% | | | | Secured Debt | | (8) | | — | | | — | | | 116 | | | — | | | 1,205 | | | — | | | 1,205 | |
| | | | | Preferred Stock | | (8) | | — | | | — | | | 70 | | | — | | | 455 | | | — | | | 455 | |
| Brewer Crane Holdings, LLC | 14.12% | L+ | 10.00% | | Secured Debt | | (9) | | — | | | — | | | 220 | | | 2,005 | | | 10 | | | 524 | | | 1,491 | |
| | | | | Preferred Member Units | | (9) | | — | | | (160) | | | 207 | | | 1,930 | | | — | | | 160 | | | 1,770 | |
| Centre Technologies Holdings, LLC | | L+ | 9.00% | | Secured Debt | | (8) | | — | | | — | | | 7 | | | — | | | 360 | | | 360 | | | — | |
| 13.13% | L+ | 9.00% | | Secured Debt | | (8) | | — | | | 115 | | | 445 | | | 2,216 | | | 1,612 | | | 97 | | | 3,731 | |
| | | | | Preferred Member Units | | (8) | | — | | | 639 | | | 30 | | | 1,460 | | | 710 | | | — | | | 2,170 | |
| Chamberlin Holding LLC | | L+ | 6.00% | | Secured Debt | | (8) | | — | | | — | | | 2 | | | — | | | — | | | — | | | — | |
| 12.13% | L+ | 8.00% | | Secured Debt | | (8) | | — | | | (42) | | | 486 | | | 4,454 | | | 42 | | | 260 | | | 4,236 | |
| | | | | Member Units | | (8) | | — | | | (300) | | | 463 | | | 6,030 | | | — | | | 302 | | | 5,728 | |
| | | | | Member Units | | (8) | | — | | | 180 | | | 19 | | | 385 | | | 293 | | | — | | | 678 | |
| Charps, LLC | | | | | Preferred Member Units | | (5) | | — | | | (170) | | | 190 | | | 3,500 | | | — | | | 170 | | | 3,330 | |
| Clad-Rex Steel, LLC | | SF+ | 9.00% | | Secured Debt | | (5) | | — | | | — | | | 1 | | | — | | | — | | | — | | | — | |
| 13.23% | SF+ | 9.00% | | Secured Debt | | (5) | | — | | | — | | | 304 | | | 2,620 | | | — | | | — | | | 2,620 | |
| 10.00% | | | | Secured Debt | | (5) | | — | | | — | | | 27 | | | 268 | | | — | | | 8 | | | 260 | |
| | | | | Member Units | | (5) | | — | | | (500) | | | 190 | | | 2,560 | | | — | | | 500 | | | 2,060 | |
| | | | | Member Units | | (5) | | — | | | 20 | | | — | | | 133 | | | 19 | | | — | | | 152 | |
| Cody Pools, Inc. | 15.38% | L+ | 10.50% | | Secured Debt | | (8) | | — | | | 11 | | | 20 | | | (6) | | | 1,033 | | | 754 | | | 273 | |
| 15.38% | L+ | 10.50% | | Secured Debt | | (8) | | — | | | (30) | | | 963 | | | 7,187 | | | 30 | | | 335 | | | 6,882 | |
MSC INCOME FUND, INC.
Consolidated Schedule of Investments In and Advances to Affiliates (Continued)
December 31, 2022
(dollars in thousands)
| | | | | | | | | | | | | | | | | | | | | | | | | | | | | | | | | | | | | | | | | | | | | | | | | | | | | | | | | | | | | | | | | |
| Company | Total Rate | Base Rate | Spread | PIK Rate | Type of Investment(1)(10)(11) | | Geography | | Amount of
Realized
Gain/(Loss) | | Amount of
Unrealized
Gain/(Loss) | | Amount of
Interest,
Fees or
Dividends
Credited to
Income(2) | | December 31,
2021 Fair Value | | Gross
Additions(3) | | Gross
Reductions(4) | | December 31,
2022 Fair Value (13) |
| | | | | Preferred Member Units | | (8) | | — | | | 2,640 | | | 1,004 | | | 11,910 | | | 2,640 | | | — | | | 14,550 | |
| Colonial Electric Company LLC | | | | | Secured Debt | | (6) | | — | | | — | | | 12 | | | — | | | 400 | | | 400 | | | — | |
| 12.00% | | | | Secured Debt | | (6) | | — | | | — | | | 761 | | | 6,007 | | | 37 | | | 315 | | | 5,729 | |
| | | | | Preferred Member Units | | (6) | | — | | | 10 | | | 349 | | | 2,280 | | | 10 | | | — | | | 2,290 | |
| Datacom, LLC | 7.50% | | | | Secured Debt | | (8) | | — | | | — | | | — | | | — | | | 25 | | | — | | | 25 | |
| 7.50% | | | | Secured Debt | | (8) | | — | | | 20 | | | 98 | | | 852 | | | 43 | | | 30 | | | 865 | |
| | | | | Preferred Member Units | | (8) | | — | | | 10 | | | 11 | | | 290 | | | 10 | | | — | | | 300 | |
| Digital Products Holdings LLC | 14.13% | L+ | 10.00% | | Secured Debt | | (5) | | — | | | — | | | 510 | | | 4,186 | | | 22 | | | 330 | | | 3,878 | |
| | | | | Preferred Member Units | | (5) | | — | | | — | | | 50 | | | 2,459 | | | — | | | — | | | 2,459 | |
| Direct Marketing Solutions, Inc. | | L+ | 11.00% | | Secured Debt | | (9) | | — | | | 5 | | | 42 | | | (7) | | | 757 | | | 750 | | | — | |
| 15.13% | L+ | 11.00% | | Secured Debt | | (9) | | — | | | 46 | | | — | | | — | | | 5,352 | | | — | | | 5,352 | |
| | L+ | 11.00% | | Secured Debt | | (9) | | — | | | (54) | | | 661 | | | 4,705 | | | — | | | 4,705 | | | — | |
| | | | | Preferred Stock | | (9) | | — | | | 970 | | | 343 | | | 4,590 | | | 968 | | | — | | | 5,558 | |
| Flame King Holdings, LLC | 10.75% | L+ | 6.50% | | Secured Debt | | (9) | | — | | | 15 | | | 167 | | | 1,581 | | | 319 | | | — | | | 1,900 | |
| 13.25% | L+ | 9.00% | | Secured Debt | | (9) | | — | | | 123 | | | 706 | | | 5,145 | | | 155 | | | — | | | 5,300 | |
| | | | | Preferred Equity | | (9) | | — | | | 1,800 | | | 538 | | | 2,600 | | | 1,800 | | | — | | | 4,400 | |
| Freeport Financial Funds | | | | | LP Interests (Freeport First Lien Loan Fund III LP) | | (5) | | — | | | (57) | | | 421 | | | 7,231 | | | — | | | 1,383 | | | 5,848 | |
| Gamber-Johnson Holdings, LLC | | SF+ | 8.50% | | Secured Debt | | (5) | | — | | | — | | | 2 | | | — | | | — | | | — | | | — | |
| 11.50% | SF+ | 8.50% | | Secured Debt | | (5) | | — | | | 272 | | | 113 | | | — | | | 16,020 | | | — | | | 16,020 | |
| | L+ | 7.50% | | Secured Debt | | (5) | | — | | | (17) | | | 559 | | | 5,400 | | | — | | | 5,400 | | | — | |
| | | | | Member Units | | (5) | | — | | | 290 | | | 224 | | | 12,430 | | | 290 | | | — | | | 12,720 | |
| GFG Group, LLC | 9.00% | | | | Secured Debt | | (5) | | — | | | (26) | | | 329 | | | 3,136 | | | 26 | | | 326 | | | 2,836 | |
| | | | | Preferred Member Units | | (5) | | — | | | 40 | | | 144 | | | 1,750 | | | 40 | | | — | | | 1,790 | |
| Gulf Publishing Holdings, LLC | | L+ | 9.50% | | Secured Debt | | (8) | | — | | | — | | | 2 | | | 64 | | | — | | | 64 | | | — | |
| | | | 6.25% | Secured Debt | | (8) | | (1,455) | | | 962 | | | 126 | | | 2,429 | | | — | | | 2,429 | | | — | |
| 12.50% | | | | Secured Debt | | (8) | | — | | | (29) | | | 19 | | | — | | | 600 | | | 29 | | | 571 | |
| | | | | Member Units | | (8) | | — | | | — | | | — | | | — | | | — | | | — | | | — | |
| | | | | Preferred Equity | | (8) | | — | | | (450) | | | — | | | — | | | 1,400 | | | 450 | | | 950 | |
| HPEP 3, L.P. | | | | | LP Interests (HPEP 3, L.P.) | | (8) | | 779 | | | 254 | | | (50) | | | 4,712 | | | 587 | | | 968 | | | 4,331 | |
| Kickhaefer Manufacturing Company, LLC | 11.50% | | | | Secured Debt | | (5) | | — | | | 18 | | | 630 | | | 5,040 | | | 53 | | | — | | | 5,093 | |
| 9.00% | | | | Secured Debt | | (5) | | — | | | — | | | 88 | | | 970 | | | — | | | 9 | | | 961 | |
| | | | | Preferred Equity | | (5) | | — | | | (1,280) | | | — | | | 3,080 | | | — | | | 1,280 | | | 1,800 | |
| | | | | Member Units | | (5) | | — | | | 98 | | | 28 | | | 615 | | | 99 | | | 1 | | | 713 | |
| Market Force Information, LLC | 12.00% | | | 12.00% | Secured Debt | | (9) | | — | | | (1,831) | | | — | | | 2,234 | | | — | | | 1,831 | | | 403 | |
| | | | | Member Units | | (9) | | — | | | — | | | — | | | — | | | — | | | — | | | — | |
| MH Corbin Holding LLC | 13.00% | | | | Secured Debt | | (5) | | — | | | 175 | | | 250 | | | 1,484 | | | 177 | | | 524 | | | 1,137 | |
| | | | | Preferred Member Units | | (5) | | — | | | — | | | — | | | — | | | — | | | — | | | — | |
| | | | | Preferred Member Units | | (5) | | — | | | — | | | — | | | — | | | — | | | — | | | — | |
| Mystic Logistics Holdings, LLC | | | | | Secured Debt | | (6) | | — | | | — | | | 1 | | | — | | | — | | | — | | | — | |
| 10.00% | | | | Secured Debt | | (6) | | — | | | — | | | 152 | | | 1,595 | | | — | | | 159 | | | 1,436 | |
| | | | | Common Stock | | (6) | | — | | | 3,500 | | | 1,050 | | | 2,210 | | | 3,498 | | | — | | | 5,708 | |
| NexRev LLC | | | | | Secured Debt | | (8) | | — | | | — | | | 7 | | | 199 | | | — | | | 199 | | | — | |
| 11.00% | | | | Secured Debt | | (8) | | — | | | (188) | | | 486 | | | 3,311 | | | — | | | 1,192 | | | 2,119 | |
MSC INCOME FUND, INC.
Consolidated Schedule of Investments In and Advances to Affiliates (Continued)
December 31, 2022
(dollars in thousands)
| | | | | | | | | | | | | | | | | | | | | | | | | | | | | | | | | | | | | | | | | | | | | | | | | | | | | | | | | | | | | | | | | |
| Company | Total Rate | Base Rate | Spread | PIK Rate | Type of Investment(1)(10)(11) | | Geography | | Amount of
Realized
Gain/(Loss) | | Amount of
Unrealized
Gain/(Loss) | | Amount of
Interest,
Fees or
Dividends
Credited to
Income(2) | | December 31,
2021 Fair Value | | Gross
Additions(3) | | Gross
Reductions(4) | | December 31,
2022 Fair Value (13) |
| | | | | Preferred Member Units | | (8) | | — | | | (723) | | | 20 | | | 670 | | | 333 | | | 723 | | | 280 | |
| NuStep, LLC | 10.63% | L+ | 6.50% | | Secured Debt | | (5) | | — | | | 2 | | | 78 | | | 430 | | | 670 | | | — | | | 1,100 | |
| 12.00% | | | | Secured Debt | | (5) | | — | | | (1) | | | 545 | | | 4,310 | | | 294 | | | 1 | | | 4,603 | |
| | | | | Preferred Member Units | | (5) | | — | | | (1,370) | | | — | | | 3,380 | | | — | | | 1,370 | | | 2,010 | |
| | | | | Preferred Member Units | | (5) | | — | | | 775 | | | — | | | — | | | 1,290 | | | — | | | 1,290 | |
| Oneliance, LLC | 15.13% | L+ | 11.00% | | Secured Debt | | (7) | | — | | | — | | | 190 | | | 1,374 | | | 6 | | | — | | | 1,380 | |
| | | | | Preferred Stock | | (7) | | — | | | — | | | 1 | | | 264 | | | — | | | — | | | 264 | |
| Orttech Holdings, LLC | | L+ | 11.00% | | Secured Debt | | (5) | | — | | | — | | | 5 | | | 41 | | | 1 | | | 44 | | | (2) | |
| 15.13% | L+ | 11.00% | | Secured Debt | | (5) | | — | | | — | | | 815 | | | 5,937 | | | 27 | | | 150 | | | 5,814 | |
| | | | | Preferred Stock | | (5) | | — | | | 440 | | | 225 | | | 2,500 | | | 440 | | | — | | | 2,940 | |
| Robbins Bros. Jewelry, Inc. | | | | | Secured Debt | | (9) | | — | | | — | | | 5 | | | — | | | 2 | | | 10 | | | (8) | |
| 12.50% | | | | Secured Debt | | (9) | | — | | | — | | | 529 | | | — | | | 3,977 | | | 75 | | | 3,902 | |
| | | | | Preferred Equity | | (9) | | — | | | 420 | | | 62 | | | — | | | 1,650 | | | — | | | 1,650 | |
| SI East, LLC | | | | | Secured Debt | | (7) | | — | | | — | | | 78 | | | 750 | | | 1,250 | | | 2,000 | | | — | |
| 9.50% | | | | Secured Debt | | (7) | | — | | | 76 | | | 2,708 | | | 21,200 | | | 10,375 | | | 1,646 | | | 29,929 | |
| | | | | Preferred Member Units | | (7) | | — | | | 690 | | | 216 | | | 3,860 | | | 690 | | | — | | | 4,550 | |
| Sonic Systems International, LLC | 11.24% | L+ | 7.50% | | Secured Debt | | (8) | | — | | | 282 | | | 1,676 | | | 13,738 | | | 4,687 | | | — | | | 18,425 | |
| | | | | Common Stock | | (8) | | — | | | (94) | | | 50 | | | 1,250 | | | 334 | | | 94 | | | 1,490 | |
| Student Resource Center, LLC | 13.27% | L+ | 8.50% | | Secured Debt | | (6) | | — | | | — | | | — | | | — | | | 5,063 | | | — | | | 5,063 | |
| | | | | Secured Debt | | (6) | | (6,651) | | | 4,438 | | | 12 | | | — | | | 6,524 | | | 6,524 | | | — | |
| | | | | Preferred Equity | | (6) | | — | | | — | | | — | | | — | | | — | | | — | | | — | |
| Tedder Industries, LLC | 12.00% | | | | Secured Debt | | (9) | | — | | | — | | | 55 | | | 259 | | | 201 | | | — | | | 460 | |
| 12.00% | | | | Secured Debt | | (9) | | — | | | (17) | | | 505 | | | 3,754 | | | 43 | | | 17 | | | 3,780 | |
| | | | | Preferred Member Units | | (9) | | — | | | (391) | | | — | | | 2,145 | | | 166 | | | 391 | | | 1,920 | |
| Trantech Radiator Topco, LLC | | | | | Secured Debt | | (7) | | — | | | 3 | | | 3 | | | (6) | | | 6 | | | — | | | — | |
| 12.00% | | | | Secured Debt | | (7) | | — | | | (17) | | | 273 | | | 2,180 | | | 17 | | | 217 | | | 1,980 | |
| | | | | Common Stock | | (7) | | — | | | (210) | | | 29 | | | 2,160 | | | — | | | 210 | | | 1,950 | |
| VVS Holdco LLC | | L+ | 6.00% | | Secured Debt | | (5) | | — | | | — | | | 13 | | | 292 | | | 203 | | | 500 | | | (5) | |
| 11.50% | | | | Secured Debt | | (5) | | — | | | — | | | 932 | | | 7,375 | | | 46 | | | — | | | 7,421 | |
| | | | | Preferred Equity | | (5) | | — | | | 30 | | | 129 | | | 2,960 | | | 30 | | | — | | | 2,990 | |
Other
Amounts related to
investments transferred to
or from other
1940 Act classification
during the period | | | | | | | | | — | | | — | | | — | | | — | | | — | | | — | | | — | |
| Total Affiliate investments | | | | | | | | | $ | (7,327) | | | $ | 15,689 | | | $ | 24,057 | | | $ | 234,158 | | | $ | 84,672 | | | $ | 41,830 | | | $ | 277,000 | |
_____________________________(1)The principal amount, the ownership detail for equity investments and if the investment is income producing is included in the Consolidated Schedule of Investments included in Item 8. Consolidated Financial Statements.
MSC INCOME FUND, INC.
Consolidated Schedule of Investments In and Advances to Affiliates (Continued)
December 31, 2022
(dollars in thousands)
(2)Represents the total amount of interest, fees and dividends credited to income for the portion of the period for which an investment was included in Control or Affiliate categories, respectively. For investments transferred between Control and Affiliate categories during the period, any income or investment balances related to the time period it was in the category other than the one shown at period end is included in “Amounts related to investments transferred to or from other 1940 Act classifications during the period.”
(3)Gross additions include increases in the cost basis of investments resulting from new portfolio investments, follow-on investments and accrued PIK interest, and the exchange of one or more existing securities for one or more new securities. Gross additions also include net increases in unrealized appreciation or net decreases in net unrealized depreciation as well as the movement of an existing portfolio company into this category and out of a different category.
(4)Gross reductions include decreases in the cost basis of investments resulting from principal repayments or sales and the exchange of one or more existing securities for one or more new securities. Gross reductions also include net increases in net unrealized depreciation or net decreases in unrealized appreciation as well as the movement of an existing portfolio company out of this category and into a different category.
(5)Portfolio company located in the Midwest region as determined by location of the corporate headquarters. The fair value as of December 31, 2022 for affiliate investments located in this region was $92,945. This represented 15.2% of net assets as of December 31, 2022.
(6)Portfolio company located in the Northeast region as determined by location of the corporate headquarters. The fair value as of December 31, 2022 for affiliate investments located in this region was $32,498. This represented 5.3% of net assets as of December 31, 2022.
(7)Portfolio company located in the Southeast region as determined by location of the corporate headquarters. The fair value as of December 31, 2022 for affiliate investments located in this region was $40,053. This represented 6.6% of net assets as of December 31, 2022.
(8)Portfolio company located in the Southwest region as determined by location of the corporate headquarters. The fair value as of December 31, 2022 for control investments located in this region was $49,715. This represented 8.2% of net assets as of December 31, 2022. The fair value as of December 31, 2022 for affiliate investments located in this region was $73,626. This represented 12.1% of net assets as of December 31, 2022.
(9)Portfolio company located in the West region as determined by location of the corporate headquarters. The fair value as of December 31, 2022 for control investments located in this region was $588. This represented 0.1% of net assets as of December 31, 2022. The fair value as of December 31, 2022 for affiliate investments located in this region was $37,878. This represented 6.2% of net assets as of December 31, 2022.
(10)All of the Company’s portfolio investments are generally subject to restrictions on resale as “restricted securities,” unless otherwise noted.
(11)This schedule should be read in conjunction with the Consolidated Schedule of Investments and Notes to the Consolidated Financial Statements included in Item 8. Consolidated Financial Statements. Supplemental information can be located within the Consolidated Schedule of Investments including end of period interest rate, preferred dividend rate, maturity date, investments not paid currently in cash and investments whose value was determined using significant unobservable inputs.
(12)Investment has an unfunded commitment as of December 31, 2022 (see Note J — Commitments and Contingencies in Item 8. Consolidated Financial Statements). The fair value of the investment includes the impact of the fair value of any unfunded commitments.
(13)Negative fair value is the result of the capitalized discount being greater than the principal amount outstanding on the loan.
5,500,000 Shares
Common Stock
________________________________________________
PROSPECTUS
January 28, 2025
________________________________________________
| | | | | | | | | | | | | | |
Joint Book-Running Managers |
| RBC Capital Markets | Truist Securities | Raymond James | UBS Investment Bank | Keefe, Bruyette & Woods |
| | | | A Stifel Company |
| | | | | | | | | | | |
Co-Managers |
Sanders Morris | B. Riley Securities | Citizens JMP |
| | | |
| Clear Street | Comerica Securities | Texas Capital Securities | Zions Capital Markets |
| | | |